New accounts open at 1:200. Email 400@400FX.com & we will give you 1:400
*  Tight Spreads
*  Guaranteed Stop-Loss
*  Commission Free
*  Begin Trading From $100
*  24/7 Trading
*  Online Credit Card Payment
*  Customized Leverage  - up to 1:400
*  Over 50 Currency Pairs
*  Full Margin Usage
*  Negative Balance Protection
Among iFOREX's unique benefits:
FOREX - Online Forex
Trading since 1996

For over 10 years, iFOREX has been committed to providing clients the tools and support necessary to capitalize on the fantastic opportunities available in the currency trading market.

Begin trading in 5 minutes with as little as $100 and take advantage
of iFOREX's commission free, tight spread and 2 trading platforms.


Register and a forex specialist will contact you for a free one-on-one training session.
Choose 400fx.com for your FOREX currency, gold and silver trading

As an introducing broker for iforex.com you get their years of experience plus
the extras that 400fx.com will give you

If you open an account for 10,000 or more after trading volume we will give you money in your account!  As you move your cursor around,  the clock follows you. We did that on this page to help you remember 400fx.com offers you more! If you put your cursor in the scroll bar, the clock will be in the corner.

Your choice of trading leverage  1:200  or 1:400

www.400fx.com  offers you a FREE FOREX trading tip:

Look at the economic calendars for when the government releases their reports.  This often affects the currency rates.  If you would like when you open your account we will send you information on days where these reports may be affecting pricing.

week of 30/03/2007 , , week of 14/04/2007 , week of 24/04/2007 ,
week of 12/05/2007 , week of 18/05/2007 , week of 25/05/2007
week of 02/06/2007 , week of 08/06/2007 week of 15/06/2007 week of 23/06/2007 week of 29/06/2007
week of 06/07/2007 week of 13/07/2007 week of 21/07/2007 week of 28/07/2007
week of 04/08/2007 week of 11/08/2007 week of 18/08/2007 week of 24/08/2007 week of 31/08/2007
week of 06/09/2007 week of 14/09/2007 ,   week of 21/09/2007 ,   week of 28/09/2007
                  week of 05/10/2007 week of 12/10/2007 ,   week of 15/10/2007 ,   week of 22/10/2007 ,   week of 29/10/2007 ,
week of 05/11/2007 ,   week of 19/11/2007 ,   week of 25/11/2007
week of 3/12/2007 ,   week of 10/12/2007 ,   Schedule


Results for January 2008 - December 2008, January - December 2009, January - December 2010, January 2011 - November 2011


Results of week of 11/27/2011 to 12/02/2011

27 November 2011 to 2 December 2011


Sun., Nov 27


      Period      Actual       Forecast       Previous      


New Zealand Dollar NZD 07:00 PM NBNZ Business Confidence NOV 18.3 9 13.2


Philippine Peso PHP 10:30 PM GDP (Q-o-Q) Q3 0.3% 1% 0.6%


Philippine Peso PHP 10:30 PM GDP (Y-o-Y) Q3 3.2% 3.9% 3.1 (R)%


Mon., Nov 28

Lithuanian Litas LTL 12:00 AM M2 Money Supply (M-o-M) OCT - - 0.98%

Lithuanian Litas LTL 12:00 AM M2 Money Supply (Y-o-Y) OCT 8.14% - 9.22%

Euro EUR 12:00 AM M2 Money Supply (M-o-M) OCT 0.04% - 0.35%

Euro EUR 12:00 AM M2 Money Supply (Y-o-Y) OCT -1.31% - -0.43%

Macedonia Denar MKD 12:00 AM Industrial Production (Y-o-Y) OCT -3.8% - -2.3%

Macedonia Denar MKD 12:00 AM Manufacturing Production (Y-o-Y) OCT -5.3% - -0.3%

Euro EUR 02:00 AM Consumer Confidence Index NOV 1.5 - 1.3

Thai Baht THB 02:00 AM Manufacturing Production (M-o-M) NOV -38.87% - 2.38%

Thai Baht THB 02:00 AM Manufacturing Production (Y-o-Y) NOV -35.8% - -0.33%

Thai Baht THB 02:00 AM Capacity Utilization (M-o-M) OCT -29.15% - 0.78%

Hungarian Forint HUF 03:00 AM Unemployment Rate AUG - OCT 10.8% - 10.7%

Hungarian Forint HUF 03:00 AM Participation Rate AUG - OCT 56.4% - 56.3%

Euro EUR 03:00 AM PPI (M-o-M) OCT 0.1% - -0.1%

Euro EUR 03:00 AM PPI (Y-o-Y) OCT 3.8% - 3.8%

Swedish Krona SEK 03:30 AM Retail Sales (M-o-M) OCT 0.4% - -0.4 (R)%

Swedish Krona SEK 03:30 AM Exports OCT 103.3B - 109.7 (R)B

Swedish Krona SEK 03:30 AM Trade Balance OCT 7.8B - 10.4 (R)B

Swedish Krona SEK 03:30 AM Imports OCT 95.5B - 99.3 (R)B

Swedish Krona SEK 03:30 AM Retail Sales (Y-o-Y) OCT -0.5% - -0.6%

Lithuanian Litas LTL 04:00 AM Retail Sales (M-o-M) OCT 0.7% - -2.5%

Lithuanian Litas LTL 04:00 AM Retail Sales (Y-o-Y) OCT 17.8% - 20.9%

Euro EUR 04:00 AM M3 Money Supply (3M) OCT 2.8% 2.85% 2.6%

Euro EUR 04:00 AM M2 Money Supply (Y-o-Y) OCT - - 3.1%

Euro EUR 04:00 AM M3 Money Supply (Y-o-Y) OCT 2.6% 3% 3.0 (R)%

Pound Sterling (British Pound) GBP 06:00 AM CBI Distributive Trades Report NOV -19 -17.33 -11

Euro EUR 06:00 AM Retail Sales (M-o-M) OCT 0.1% - -0.7 (R)%

Euro EUR 06:00 AM Retail Sales (Y-o-Y) OCT -3.8% - -3.8 (R)%

Euro EUR 07:00 AM GfK Consumer Confidence Survey DEC 5.6 5.27 5.4 (R)

Euro EUR 08:00 AM CPI (M-o-M) NOV P - 0.1% 0.0%

Euro EUR 08:00 AM CPI (Y-o-Y) NOV P 2.4% 2.5% 2.5%

Euro EUR 08:00 AM CPI - EU Harmonised (M-o-M) NOV P 0.1% -0.1% 0.1%

Euro EUR 08:00 AM CPI - EU Harmonised (Y-o-Y) NOV P 2.8% 2.9% 2.9%

US Dollar USD 10:00 AM New Home Sales - Median Prices OCT 212.3K - 213.3 (R)K

US Dollar USD 10:00 AM New Home Sales - Units OCT 307K 311.67K 303 (R)K

Japanese Yen JPY 06:30 PM Unemployment Rate OCT - 4.17% 4.1%

Japanese Yen JPY 06:30 PM Job-To-Applicant Ratio OCT - - 0.67

Japanese Yen JPY 06:30 PM Household Spending (Y-o-Y) OCT - - -1.9%

South Korea Won KRW 07:00 PM Current Account Balance - BoP OCT - - 3.1B

Japanese Yen JPY 07:50 PM Retail Trade (M-o-M) OCT - - -1.5%

Japanese Yen JPY 07:50 PM Retail Trade (Y-o-Y) OCT - - -1.2%

Japanese Yen JPY 07:50 PM Wholesale Sales (Y-o-Y) OCT - - 0.6%

Japanese Yen JPY 07:50 PM Large Retailers' Sales OCT - - -3.6%

Philippine Peso PHP 10:30 PM GDP (Q-o-Q) Q3 - - 0.6%

Philippine Peso PHP 10:30 PM GDP (Y-o-Y) Q3 - - 3.4%

New Zealand Dollar NZD 11:00 PM Official Foreign Reserves OCT - - 26.71B


Tue., Nov 29

Period Actual Forecast Previous

Brazilian Real BRL 12:00 AM Monetary Policy Meeting Minutes - - - -

Hungarian Forint HUF 12:00 AM Monetary Policy Meeting - - - -

Singapore Dollar SGD 01:00 AM PPI (Y-o-Y) OCT - - 11.0%

Singapore Dollar SGD 01:00 AM PPI (M-o-M) OCT - - 2.0%

South African Rand ZAR 01:00 AM M3 Money Supply (Y-o-Y) NOV - - 6.80%

Swiss Franc CHF 02:00 AM UBS Consumption Indicator OCT - - 0.84

Pound Sterling (British Pound) GBP 02:00 AM Nationwide House Prices (M-o-M) NOV - - 0.4%

Euro EUR 03:00 AM Consumer Confidence Index NOV - -29.1 -30.1

Euro EUR 03:00 AM Flash CPI - EU Harmonised (Y-o-Y) NOV - 2.75% 3.0%

Euro EUR 03:00 AM Retail Sales (Y-o-Y) OCT - -5.5% -5.5%

Swedish Krona SEK 03:30 AM GDP (Q-o-Q) Q3 - 0.2% 0.9%

Swedish Krona SEK 03:30 AM GDP (Y-o-Y) Q3 - 3.1% 4.9%

Lithuanian Litas LTL 04:00 AM GDP (Q-o-Q) Q3 - - 0.4%

Lithuanian Litas LTL 04:00 AM GDP (Y-o-Y) Q3 - - 6.3%

Euro EUR 04:00 AM Hourly Wages (Y-o-Y) OCT - - 1.7%

Euro EUR 04:00 AM Hourly Wages (M-o-M) OCT - - 0.3%

Lithuanian Litas LTL 04:00 AM Consumer Confidence Index NOV - - -23

Euro EUR 04:00 AM PMI Manufacturing SEP - - 48.0

Pound Sterling (British Pound) GBP 04:30 AM M4 Money Supply (M-o-M) OCT - - -0.4%

Pound Sterling (British Pound) GBP 04:30 AM Mortgage Approvals OCT - 36K 50.97K

Pound Sterling (British Pound) GBP 04:30 AM M4 Money Supply (Y-o-Y) OCT - - -1.7%

Pound Sterling (British Pound) GBP 04:30 AM Net Lending Sec. on Dwellings OCT - - 0.3B

South African Rand ZAR 04:30 AM GDP (Y-o-Y) Q3 - - 3.0%

South African Rand ZAR 04:30 AM GDP (Q-o-Q) Q3 - - 1.3%

Pound Sterling (British Pound) GBP 04:30 AM Net Consumer Credit OCT - 0.3B 0.6B

Iceland Krona ISK 05:00 AM PPI (Y-o-Y) OCT - - 13.9%

Iceland Krona ISK 05:00 AM PPI (M-o-M) OCT - - -0.6%

Euro EUR 05:00 AM PPI (Y-o-Y) OCT - - 8.3%

Euro EUR 05:00 AM PPI (M-o-M) OCT - - 0.8%

Euro EUR 05:00 AM Consumer Confidence Index NOV - - -53.0

Euro EUR 05:00 AM PPI (Y-o-Y) OCT - - 1.5%

Euro EUR 05:00 AM PPI (M-o-M) OCT - - 1.8%

Euro EUR 05:00 AM Consumer Confidence Index NOV - - -19.9

Croatian Kuna HRK 05:00 AM Industrial Production (Y-o-Y) OCT - - -2.3%

Croatian Kuna HRK 05:00 AM Industrial Production (M-o-M) OCT - - 4.0%

Croatian Kuna HRK 05:00 AM Manufacturing Production (M-o-M) OCT - - 3.9%

Croatian Kuna HRK 05:00 AM Manufacturing Production (Y-o-Y) OCT - - -2.6%

Norwegian Krone NOK 05:00 AM M2 Money Supply (Y-o-Y) OCT - - 8.9%

Euro EUR 05:00 AM Business Climate Indicator NOV - -0.42 -0.18

Euro EUR 05:00 AM Industrial Confidence Index NOV - -7.4 -6.6

Euro EUR 05:00 AM Services Confidence Index NOV - 0.5 0.2

Euro EUR 05:00 AM Economic Confidence Index NOV - 93.72 94.8

Euro EUR 05:15 AM CPI (Y-o-Y) NOV - 3.3% 3.57%

Euro EUR 05:15 AM CPI (M-o-M) NOV - 0% 0.15%

Hungarian Forint HUF 08:00 AM Interest Rate Decision - - - 6.00%

Canadian Dollar CAD 08:30 AM Current Account Balance - BoP Q3 - -12B -15.3B

US Dollar USD 09:00 AM S&P/Case-Shiller Composite-20 (Y-o-Y) SEP - -3% -3.8%

US Dollar USD 09:00 AM S&P/Case-Shiller Home Price Index SEP - - 142.84

US Dollar USD 10:00 AM House Price Index (Q-o-Q) Q3 - 0.2% -0.62%

US Dollar USD 10:00 AM House Price Index (M-o-M) SEP - -0.3% -0.1%

US Dollar USD 10:00 AM Consumer Confidence Index NOV - 43.6 39.8

South Korea Won KRW 07:00 PM Industrial Production (M-o-M) OCT - 0.5% 1.1%

South Korea Won KRW 07:00 PM Industrial Production (Y-o-Y) OCT - 5.5% 6.8%

Pound Sterling (British Pound) GBP 07:01 PM GfK Consumer Confidence Survey NOV - - -32

Japanese Yen JPY 07:50 PM Industrial Production (M-o-M) OCT P - 1.5% -3.3%

Japanese Yen JPY 07:50 PM Industrial Production (Y-o-Y) OCT P - -1.73% -3.3%

Japanese Yen JPY 08:30 PM Labor Cash Earnings (Y-o-Y) OCT - - 0.0%

Australian Dollar AUD 09:30 PM Private Capital Expenditure Q3 - - 4.9%

New Zealand Dollar NZD 11:00 PM M3 Money Supply (M-o-M) OCT - - 0.6%

New Zealand Dollar NZD 11:00 PM M3 Money Supply (Y-o-Y) OCT - - 5.0%


Wed., Nov 30

Period Actual Forecast Previous

Indian Rupee INR 12:00 AM GDP (Y-o-Y) Q2 - 6.75% 7.7%

Thai Baht THB 12:00 AM Financial Account Balance - BoP Q3 - - -710.9M

Thai Baht THB 12:00 AM Current Account Balance - BoP Q3 - - 1.82B

Malaysian Ringgit MYR 12:00 AM PPI (Y-o-Y) OCT - - 15.1%

Malaysian Ringgit MYR 12:00 AM PPI (M-o-M) OCT - - -0.7%

Euro EUR 12:00 AM Current Account Balance - BoP SEP - - -117M

Euro EUR 12:00 AM Capital Account Balance - BoP SEP - - 935M

Malaysian Ringgit MYR 12:00 AM M2 Money Supply (Y-o-Y) OCT - - 13.05%

Euro EUR 12:00 AM Financial Account Balance - BoP SEP - - -3.88B

Malaysian Ringgit MYR 12:00 AM M2 Money Supply (M-o-M) OCT - - 2.6%

Indonesia Rupiah IDR 12:00 AM Exports OCT - - 17.82B

Indonesia Rupiah IDR 12:00 AM Imports OCT - - 15.10B

Indonesia Rupiah IDR 12:00 AM Trade Balance OCT - - 2.72B

Brazilian Real BRL 12:00 AM M2 Money Supply (M-o-M) OCT - - 2.2%

Brazilian Real BRL 12:00 AM M2 Money Supply (Y-o-Y) OCT - - 21.8%

Brazilian Real BRL 12:00 AM M4 Money Supply (M-o-M) OCT - - 1.0%

Brazilian Real BRL 12:00 AM M4 Money Supply (Y-o-Y) OCT - - 14.6%

Brazilian Real BRL 12:00 AM Monetary Policy Meeting - - - -

Brazilian Real BRL 12:00 AM Interest Rate Decision - - 11 11.50

Euro EUR 12:00 AM M3 Money Supply (M-o-M) OCT - - -0.85%

Euro EUR 12:00 AM M3 Money Supply (Y-o-Y) OCT - - 4.96%

Euro EUR 12:00 AM Retail Sales (Y-o-Y) OCT - - -6.3%

Macedonia Denar MKD 12:00 AM Wholesale Sales (M-o-M) SEP - - -1.2%

Macedonia Denar MKD 12:00 AM Retail Trade (M-o-M) SEP - - -1.4%

Macedonia Denar MKD 12:00 AM Wholesale Sales (Y-o-Y) SEP - - 9.9%

Macedonia Denar MKD 12:00 AM Retail Trade (Y-o-Y) SEP - - 0.2%

Australian Dollar AUD 12:30 AM M3 Money Supply (M-o-M) OCT - - 2.58%

Australian Dollar AUD 12:30 AM M3 Money Supply (Y-o-Y) OCT - - 9.82%

Estonian Kroon EEK 01:00 AM Retail Sales (M-o-M) OCT - - -8.0%

Estonian Kroon EEK 01:00 AM Retail Sales (Y-o-Y) OCT - - 4.0%

Euro EUR 02:00 AM Retail Sales (M-o-M) OCT - 0% 0.4%

Euro EUR 02:00 AM Retail Sales (Y-o-Y) OCT - 3.3% 0.3%

Euro EUR 02:45 AM Consumer Spending (M-o-M) OCT - -0.05% -0.5%

Euro EUR 02:45 AM Consumer Spending (Y-o-Y) OCT - -1.1% -1.3%

Turkish Lira TRY 03:00 AM Imports OCT - - 21.20B

Turkish Lira TRY 03:00 AM Exports OCT - - 10.79B

Turkish Lira TRY 03:00 AM Trade Balance OCT - -7.8B -10.41B

Danish Krone DKK 03:00 AM GDP (Y-o-Y) Q3 P - - 1.8%

Danish Krone DKK 03:00 AM GDP (Q-o-Q) Q3 P - - 1.0%

Swedish Krona SEK 03:30 AM Financial Account Balance - BoP Q3 - - -10.8B

Swedish Krona SEK 03:30 AM Current Account Balance - BoP Q3 - - 61.3B

Swedish Krona SEK 03:30 AM Capital Account Balance - BoP Q3 - - -1.8B

Thai Baht THB 03:30 AM Exports OCT - - 21.26B

Thai Baht THB 03:30 AM Imports OCT - - 18.84B

Thai Baht THB 03:30 AM Trade Balance OCT - - 2.42B

Euro EUR 03:30 AM PPI (M-o-M) OCT - - 0.6%

Euro EUR 03:30 AM PPI (Y-o-Y) OCT - - 9.6%

Euro EUR 03:45 AM PPI (Y-o-Y) SEP - - 5.2%

Euro EUR 03:45 AM PPI (M-o-M) SEP - - 0.2%

Polish Zloty PLN 04:00 AM GDP (Q-o-Q) Q3 - - 1.1%

Polish Zloty PLN 04:00 AM GDP (Y-o-Y) Q3 - - 4.5%

Euro EUR 04:00 AM Unemployment Rate OCT - 8.5% 8.3%

Norwegian Krone NOK 04:00 AM Retail Sales (M-o-M) OCT - - -0.7%

Norwegian Krone NOK 04:00 AM Retail Sales (Y-o-Y) OCT - - 2.5%

Bulgarian Lev BGN 04:00 AM PPI (M-o-M) OCT - - 1.5%

Bulgarian Lev BGN 04:00 AM PPI (Y-o-Y) OCT - - 8.5%

Euro EUR 04:00 AM CB Coincidence Index OCT - - 0.1%

Euro EUR 04:00 AM CB Leading Index OCT - - -0.7%

Hungarian Forint HUF 04:00 AM PPI (Y-o-Y) OCT - - 4.1%

Hungarian Forint HUF 04:00 AM PPI (M-o-M) OCT - - 3.3%

Euro EUR 04:30 AM Unemployment Rate Q3 - - 7.8%

Euro EUR 04:30 AM GDP (Y-o-Y) Q3 - - 1.0%

Euro EUR 04:30 AM GDP (Q-o-Q) Q3 - - 0.1%

Euro EUR 04:30 AM CPI (Y-o-Y) NOV - - 2.7%

Euro EUR 04:30 AM CPI - EU Harmonised (Y-o-Y) NOV - - 2.9%

Euro EUR 04:30 AM CPI (M-o-M) NOV - - 0.7%

Euro EUR 04:30 AM CPI - EU Harmonised (M-o-M) NOV - - 0.8%

Euro EUR 04:30 AM Retail Sales (Y-o-Y) OCT - - 1.7%

Euro EUR 04:30 AM Retail Sales (M-o-M) OCT - - -2.1%

Euro EUR 05:00 AM PPI (Y-o-Y) OCT - - 4.5%

Euro EUR 05:00 AM Flash CPI - EU Harmonised (Y-o-Y) NOV - 2.80% 3.0%

Euro EUR 05:00 AM PPI (M-o-M) OCT - - 0.2%

Czech Koruna CZK 05:00 AM M2 Money Supply (Y-o-Y) OCT - - 4.4%

Czech Koruna CZK 05:00 AM M2 Money Supply (M-o-M) OCT - - 0.86%

Euro EUR 05:00 AM Retail Trade (M-o-M) SEP - - -2.8%

Euro EUR 05:00 AM Retail Trade (Y-o-Y) SEP - - -1.5%

Euro EUR 05:00 AM CPI (M-o-M) NOV P - - 0.6%

Euro EUR 05:00 AM CPI (Y-o-Y) NOV P - - 3.4%

Euro EUR 05:00 AM CPI - EU Harmonised (M-o-M) NOV P - -0.3% 0.9%

Euro EUR 05:00 AM CPI - EU Harmonised (Y-o-Y) NOV P - 3.4% 3.8%

Euro EUR 05:00 AM Unemployment Rate OCT - 7.1% 5.8%

Euro EUR 05:00 AM Unemployment Rate OCT - 10.3% 10.2%

Swiss Franc CHF 05:30 AM KOF Swiss Leading Indicator NOV - 0.4 0.80

Euro EUR 06:00 AM Industrial Production (Y-o-Y) SSEP - - -12.0%

Euro EUR 06:00 AM Industrial Production (M-o-M) SEP - - -27.9%

Euro EUR 06:00 AM PPI (M-o-M) OCT - - 0.99%

Euro EUR 06:00 AM PPI (Y-o-Y) OCT - - 6.3%

Latvian Lats LVL 06:00 AM Retail Sales (M-o-M) OCT - - 0.9%

Latvian Lats LVL 06:00 AM Retail Sales (Y-o-Y) OCT - - 8.1%

Croatian Kuna HRK 06:00 AM Exports OCT - - 0.86B

Croatian Kuna HRK 06:00 AM Imports OCT - - 1.34B

Croatian Kuna HRK 06:00 AM Trade Balance OCT - - -478.73M

Euro EUR 06:00 AM Industrial Production (Y-o-Y) OCT - - -2.0%

Euro EUR 06:00 AM Unemployment Rate NOV - - 14.4%

US Dollar USD 07:00 AM MBA Mortgage Applications NOV 25 - - -1.2%

South African Rand ZAR 08:00 AM Exports OCT - - 67.77B

South African Rand ZAR 08:00 AM Imports OCT - - 65.25B

South African Rand ZAR 08:00 AM Trade Balance OCT - - 2.51B

US Dollar USD 08:15 AM ADP Employment Change NOV - 145K 110K

Canadian Dollar CAD 08:30 AM GDP (M-o-M) SEP - - 0.3%

Canadian Dollar CAD 08:30 AM Industrial Production (M-o-M) OCT - - 0.4%

Canadian Dollar CAD 08:30 AM Industrial Product Price (Y-o-Y) OCT - - 5.3%

Canadian Dollar CAD 08:30 AM Raw Materials Price Index (Y-o-Y) OCT - - 15.2%

Canadian Dollar CAD 08:30 AM Raw Materials Price Index (M-o-M) OCT - - 1.4%

US Dollar USD 08:30 AM Non-Farm Productivity (Q-o-Q) Q3 F - 2.63% 3.1%

US Dollar USD 08:30 AM Non-Farm Productivity (Y-o-Y) Q3 F - - 1.1%

US Dollar USD 08:30 AM Real Time Compensations (Q-o-Q) Q3 F - - -2.4%

US Dollar USD 08:30 AM Real Time Compensations (Y-o-Y) Q3 F - - -1.4%

US Dollar USD 08:30 AM Unit Labor Cost (Q-o-Q) Q3 F - -2.25% -2.4%

US Dollar USD 08:30 AM Unit Labor Cost (Y-o-Y) Q3 F - - 1.2%

Canadian Dollar CAD 08:30 AM GDP (Q-o-Q) Q3 - - -0.1%

US Dollar USD 09:45 AM Chicago PMI NOV - 58.23 58.4

US Dollar USD 10:00 AM Pending Home Sales Index OCT - 1.83% -4.6%

US Dollar USD 10:30 AM EIA Crude Oil Inventory (Barrels) NOV 25 - - 330.8M

US Dollar USD 01:00 PM EIA Crude Oil Price NOV 25 - - 99.27

Argentine Peso ARS 03:00 PM Industrial Production (M-o-M) OCT - - 0.6%

Argentine Peso ARS 03:00 PM Capacity Utilization (M-o-M) OCT - - 83.6%

Argentine Peso ARS 03:00 PM Industrial Production (Y-o-Y) OCT - - 5.1%

Australian Dollar AUD 06:30 PM PMI Manufacturing NOV - - 47.4

Japanese Yen JPY 06:50 PM Foreigners Buying Japan Stocks (Yen) NOV 20 - NOV 26 - - -77.2B

Japanese Yen JPY 06:50 PM Foreigners Buying Japan Bonds (Yen) NOV 20 - NOV 26 - - 660.3B

Japanese Yen JPY 06:50 PM Japan Buying Foreign Bonds (Yen) NOV 20 - NOV 26 - - -1005.1B

Japanese Yen JPY 06:50 PM Japan Buying Foreign Stocks (Yen) NOV 20 - NOV 26 - - -13.2B

Japanese Yen JPY 07:50 PM Industrial Production (M-o-M) OCT P - - -3.3%

South Korea Won KRW 08:00 PM PMI Manufacturing NOV - - 48.0

Australian Dollar AUD 08:30 PM Retail Sales (Y-o-Y) OCT - - 2.4%

Australian Dollar AUD 08:30 PM Retail Sales (M-o-M) OCT - 0.40% 0.4%

Australian Dollar AUD 08:30 PM Retail Sales (Y-o-Y) OCT - - 2.4%

Australian Dollar AUD 08:30 PM Building Approvals (M-o-M) OCT - 3% -13.6%

Australian Dollar AUD 08:30 PM Building Approvals (Y-o-Y) OCT - -14% -12.0%

Euro EUR 09:00 PM PMI Manufacturing NOV - - 48.0


Thu., Dec 01

Period Actual Forecast Previous

Iceland Krona ISK 12:00 AM Financial Account Balance - BoP Q3 - - -162.1B

Iceland Krona ISK 12:00 AM Current Account Balance - BoP Q3 - - -58.0B

Indonesia Rupiah IDR 12:00 AM Core CPI (M-o-M) NOV - 0.4% -0.12%

Indonesia Rupiah IDR 12:00 AM Core CPI (Y-o-Y) NOV - 4.4% 4.43%

Indonesia Rupiah IDR 12:00 AM CPI (M-o-M) NOV - - -0.12%

Indonesia Rupiah IDR 12:00 AM CPI (Y-o-Y) NOV - - 4.42%

Indian Rupee INR 12:00 AM Exports OCT - - 24.82B

Indian Rupee INR 12:00 AM Trade Balance NOV - - -9.77B

Indian Rupee INR 12:00 AM Imports OCT - - 34.59B

Philippine Peso PHP 12:00 AM Interest Rate Decision - - - 6.50%

Macedonia Denar MKD 12:00 AM CPI (Y-o-Y) NOV - - 3.3%

Macedonia Denar MKD 12:00 AM CPI (M-o-M) NOV - - 0.3%

US Dollar USD 12:00 AM EIA Natural Gas Inventory (Cubic Feet) NOV 25 - - 3852B

Thai Baht THB 12:30 AM PPI (M-o-M) NOV - - -0.5%

Thai Baht THB 12:30 AM Core CPI (M-o-M) NOV - 0.1% 0.07%

Thai Baht THB 12:30 AM PPI (Y-o-Y) NOV - - 4.2%

Thai Baht THB 12:30 AM Core CPI (Y-o-Y) NOV - 2.9% 2.9%

Australian Dollar AUD 12:30 AM RBA Commodity Index (Y-o-Y) NOV - - 15.9%

Thai Baht THB 12:30 AM CPI (Y-o-Y) NOV - 4.45% 4.2%

Thai Baht THB 12:30 AM CPI (M-o-M) NOV - 0.45% 0.19%

Indian Rupee INR 01:00 AM PMI Manufacturing NOV - - 52.0

Euro EUR 01:30 AM ILO Mainland Unemployment Rate Q3 - - 9.1%

Swiss Franc CHF 01:45 AM GDP (Q-o-Q) Q3 - 0.1% 0.4%

Swiss Franc CHF 01:45 AM GDP (Y-o-Y) Q3 - 1.8% 2.3%

Danish Krone DKK 03:00 AM Unemployment Rate OCT - - 6.2%

Euro EUR 03:00 AM PMI Manufacturing NOV - - 50.1

Swiss Franc CHF 03:30 AM SVME - Purchasing Manager Index NOV - - 46.9

Turkish Lira TRY 04:00 AM PMI Manufacturing NOV - - 53.3

Polish Zloty PLN 04:00 AM PMI Manufacturing NOV - - 51.7

Danish Krone DKK 04:00 AM Retail Sales (M-o-M) OCT - - 0.0%

Danish Krone DKK 04:00 AM Retail Sales (Y-o-Y) OCT - - -1.2%

Norwegian Krone NOK 04:00 AM PMI Manufacturing NOV - - 50.8

Euro EUR 04:15 AM PMI Manufacturing NOV - 43.4 43.9

Czech Koruna CZK 04:30 AM PMI Manufacturing NOV - - 51.7

Hong Kong Dollar HKD 04:30 AM Retail Sales (Y-o-Y) OCT - - 15.2%

Euro EUR 04:45 AM PMI Manufacturing NOV - - 43.3

Euro EUR 04:50 AM PMI Manufacturing NOV - - 48.5

Euro EUR 04:55 AM PMI Manufacturing NOV - - 49.1

Euro EUR 05:00 AM PMI Manufacturing NOV - - 40.5

Euro EUR 05:00 AM PMI Manufacturing NOV - 46.4 47.1

Pound Sterling (British Pound) GBP 05:30 AM PMI Manufacturing NOV - 46.7 47.4

Euro EUR 06:00 AM CPI (Y-o-Y) NOV - - 3.04%

Euro EUR 06:00 AM CPI (M-o-M) NOV - - 1.45%

Brazilian Real BRL 08:00 AM Exports NOV - - 15.09B

Brazilian Real BRL 08:00 AM Imports NOV - - 14.52B

Brazilian Real BRL 08:00 AM Trade Balance NOV - - 0.57B

Brazilian Real BRL 08:00 AM PMI Manufacturing NOV - - 46.5

Canadian Dollar CAD 09:30 AM PMI Manufacturing NOV - - 53.7

US Dollar USD 10:00 AM ISM Manufacturing Prices Index NOV - 43 41.0

US Dollar USD 10:00 AM ISM Manufacturing New Orders Index NOV - - 52.4

US Dollar USD 10:00 AM ISM Manufacturing Survey NOV - 51.4 50.8

US Dollar USD 10:00 AM Construction Spending - Residential OCT - - 0.7%

US Dollar USD 10:00 AM Construction Spending - Total OCT - 0.32% 0.2%

South Korea Won KRW 07:00 PM CPI (Y-o-Y) NOV - - 3.9%

South Korea Won KRW 07:00 PM CPI (M-o-M) NOV - - -0.2%

South Korea Won KRW 07:00 PM Core CPI (M-o-M) NOV - - -0.2%

South Korea Won KRW 07:00 PM Core CPI (Y-o-Y) NOV - - 3.7%

Japanese Yen JPY 07:50 PM Capital Spending (Q-o-Q) Q3 - -2.5% -7.8%

Japanese Yen JPY 07:50 PM Capital Spending excl Software Q3 - - -8.2%


Fri., Dec 02

Period Actual Forecast Previous

Euro EUR 12:00 AM Unemployment Rate NOV - - 3.9%

New Leu RON 12:00 AM Official Foreign Reserves NOV - - 32.20B

Estonian Kroon EEK 01:00 AM Industrial Production (M-o-M) OCT - - -11.0%

Estonian Kroon EEK 01:00 AM Manufacturing Production (Y-o-Y) OCT - - 6.5%

Estonian Kroon EEK 01:00 AM Manufacturing Production (M-o-M) OCT - - -11.6%

Estonian Kroon EEK 01:00 AM Industrial Production (Y-o-Y) OCT - - 5.5%

Hungarian Forint HUF 03:00 AM Exports SEP F - - 7.15B

Hungarian Forint HUF 03:00 AM Trade Balance SEP F - - 741.5M

Hungarian Forint HUF 03:00 AM Imports SEP F - - 6.41B

New Leu RON 04:00 AM PPI (Y-o-Y) OCT - 8.6% 8.1%

New Leu RON 04:00 AM PPI (M-o-M) OCT - - 0.9%

Swiss Franc CHF 04:15 AM Retail Sales (M-o-M) OCT - - 0.1%

Swiss Franc CHF 04:15 AM Retail Sales (Y-o-Y) OCT - - -0.9%

Pound Sterling (British Pound) GBP 05:30 AM PMI Construction NOV - 52.4 53.9

Euro EUR 06:00 AM PPI (M-o-M) OCT - 0% 0.3%

Euro EUR 06:00 AM PPI (Y-o-Y) OCT - 5.5% 5.8%

Latvian Lats LVL 06:00 AM Current Account Balance - BoP Q3 - - 31.8M

Latvian Lats LVL 06:00 AM Capital Account Balance - BoP Q3 - - 14.4M

Latvian Lats LVL 06:00 AM Financial Account Balance - BoP Q3 - - -7.7M

Brazilian Real BRL 07:00 AM Industrial Production (M-o-M) OCT - - -2.0%

Brazilian Real BRL 07:00 AM Industrial Production (Y-o-Y) OCT - - -1.6%

Canadian Dollar CAD 07:00 AM Net Change in Employment NOV - 15K -54.0K

Canadian Dollar CAD 07:00 AM Unemployment Rate NOV - 7.3% 7.3%

US Dollar USD 08:30 AM Avg Hourly Earnings NOV - - 19.53

US Dollar USD 08:30 AM Avg Weekly Hours NOV - - 33.7

US Dollar USD 08:30 AM Change in Manufacturing Payrolls NOV - 10K 5K

US Dollar USD 08:30 AM Non-Farm Payroll (M-o-M) NOV - 126.25K 80K

US Dollar USD 08:30 AM Unemployment Rate NOV - 9.03% 9.0%

Mexican Peso MXN 10:00 AM Interest Rate Decision - - 4.5% 4.50%


Sun., Dec 04

Period Actual Forecast Previous

Australian Dollar AUD 06:30 PM AiG Performance of Service Index NOV - - 48.8

Australian Dollar AUD 08:30 PM Company Operating Profit (Q-o-Q) Q3 - - 6.7%


Mon., Dec 05

Period Actual Forecast Previous

Danish Krone DKK 12:00 AM Official Foreign Reserves NOV - - 92.5B

Euro EUR 12:00 AM Official Foreign Reserves NOV - - 19.39B

Indian Rupee INR 01:00 AM PMI Composite NOV - - 50.3

Indian Rupee INR 01:00 AM PMI Services NOV - - 49.1

Euro EUR 02:00 AM GDP (Q-o-Q) Q3 - - 0.6%

Euro EUR 02:00 AM GDP (Y-o-Y) Q3 - - 2.9%

Euro EUR 03:00 AM PMI Services NOV - - 51.5

Turkish Lira TRY 04:00 AM CPI (M-o-M) NOV - - 3.27%

Turkish Lira TRY 04:00 AM CPI (Y-o-Y) NOV - - 7.66%

Turkish Lira TRY 04:00 AM PPI (Y-o-Y) NOV - - 12.58%

Turkish Lira TRY 04:00 AM PPI (M-o-M) NOV - - 1.60%

Euro EUR 04:00 AM Industrial Production (M-o-M) OCT - - -1.7%


Results of week of 11/20/2011 to 11/27/2011

20 November 2011 to 27 November 2011


Sun., Nov 20
Period Actual Forecast Previous
Japanese Yen JPY 06:50 PM Imports OCT 17.9% - 12.1%
Japanese Yen JPY 06:50 PM Exports OCT -3.7% - 2.3 (R)%
Japanese Yen JPY 06:50 PM Trade Balance OCT -273.8B - 296.2 (R)B
Singapore Dollar SGD 07:00 PM GDP (Y-o-Y) Q3 6.1% - 1.0%
Singapore Dollar SGD 07:00 PM GDP (Q-o-Q) Q3 1.9% - -6.4%
Pound Sterling (British Pound) GBP 07:01 PM Rightmove House Prices (M-o-M) NOV -3.1% - 2.8%
Pound Sterling (British Pound) GBP 07:01 PM Rightmove House Prices (Y-o-Y) NOV 1.2% - 1.2%
Singapore Dollar SGD 08:00 PM GDP (Y-o-Y) Q3 6.1% 6.2% 1.0 (R)%
Singapore Dollar SGD 08:00 PM GDP (Q-o-Q) Q3 1.9% 2.4% -6.4 (R)%
Thai Baht THB 10:30 PM GDP (Y-o-Y) Q3 3.5% 3.8% 2.7 (R)%
Thai Baht THB 10:30 PM GDP (Q-o-Q) Q3 0.5% 1.25% 0.0 (R)%
New Zealand Dollar NZD 11:00 PM Credit Card Spending (Y-o-Y) OCT 7.9% - 5.3 (R)%

Mon., Nov 21
Period Actual Forecast Previous
Singapore Dollar SGD 12:00 AM Wholesale Sales (Y-o-Y) Q3 1.8% - -0.9 (R)%
Singapore Dollar SGD 12:00 AM Wholesale Sales (Q-o-Q) Q3 -1.6% - 0.5 (R)%
Japanese Yen JPY 12:00 AM Coincidence Index SEP F 89.0 - 90.3 (R)
Japanese Yen JPY 12:00 AM Monetary Policy Meeting Minutes - - - -
Japanese Yen JPY 12:00 AM Lagging Index SEP F 86.2 - 84.4 (R)
Japanese Yen JPY 12:00 AM Leading Index SEP F 91.5 - 93.8 (R)
Singapore Dollar SGD 12:00 AM Capital Account Balance - BoP Q3 -129.1M - -133.7M
Singapore Dollar SGD 12:00 AM Current Account Balance - BoP Q3 14.89B - 14.46 (R)B
Singapore Dollar SGD 12:00 AM Financial Account Balance - BoP Q3 -2.08B - -6.21 (R)B
Japanese Yen JPY 12:30 AM All Industry Activity Index (M-o-M) SEP -0.9% -1% -0.3 (R)%
Estonian Kroon EEK 01:00 AM PPI (M-o-M) OCT -0.1% - 0.0%
Estonian Kroon EEK 01:00 AM PPI (Y-o-Y) OCT 3.3% - 3.7%
Swiss Franc CHF 03:00 AM M3 Money Supply (Y-o-Y) OCT 8.2% - 7.9 (R)%
Swiss Franc CHF 03:00 AM M3 Money Supply (M-o-M) OCT 0.99% - 0.15 (R)%
Swiss Franc CHF 03:00 AM Official Foreign Reserves OCT 372.28B - 385.43B
Bulgarian Lev BGN 04:00 AM Unemployment Rate Q3 10.2 % - 11.2 %
Euro EUR 04:00 AM Capital Account Balance - BoP SEP - - 2.2 (R)B
Euro EUR 04:00 AM Current Account Balance - BoP SEP 0.5B -3.25B -5.9 (R)B
Euro EUR 04:00 AM Financial Account Balance - BoP SEP 2.8B - 6.8 (R)B
Euro EUR 04:00 AM CB Coincidence Index SEP - - 0.1%
Euro EUR 04:00 AM CB Leading Index SEP -0.6% - -0.5%
Euro EUR 05:00 AM Trade Balance - Non EU OCT -0.81B - -1.46B
Polish Zloty PLN 08:00 AM Industrial Production (M-o-M) OCT -2.4% - 13.0%
Polish Zloty PLN 08:00 AM Manufacturing Production (M-o-M) OCT -3.5% - 14.1%
Polish Zloty PLN 08:00 AM Manufacturing Production (Y-o-Y) OCT 7.1% - 8.7%
Polish Zloty PLN 08:00 AM Industrial Production (Y-o-Y) OCT 6.5% 9.6% 7.7%
Polish Zloty PLN 08:00 AM PPI (M-o-M) OCT 0.1% - 1.4%
Polish Zloty PLN 08:00 AM PPI (Y-o-Y) OCT 8.% - 8.1%
Canadian Dollar CAD 08:30 AM Wholesale Sales (Y-o-Y) SEP 7.4% - 8.01 (R)%
Canadian Dollar CAD 08:30 AM Wholesale Sales (M-o-M) SEP 0.3% 0.43% 0.44 (R)%
US Dollar USD 10:00 AM Existing Home Sales - Inventories OCT 3.33M - 3.41 (R)M

Tue., Nov 22
Period Actual Forecast Previous
Euro EUR 12:00 AM Imports SEP 22.63B - 20.37B
Euro EUR 12:00 AM Exports SEP 17.78B - 15.44B
Euro EUR 12:00 AM Current Account Balance - BoP SEP -1.10B - -0.15B
Euro EUR 12:00 AM Capital Account Balance - BoP SEP 7.9M - 579.9M
Euro EUR 12:00 AM Financial Account Balance - BoP SEP 1.50B - 0.03B
Malaysian Ringgit MYR 12:00 AM Unemployment Rate SEP 3.3% - 3.1%
Euro EUR 12:00 AM Trade Balance SEP -4.85B -2.5B -4.93B
Swiss Franc CHF 02:00 AM Trade Balance OCT 2.15B - 1.91 (R)B
Swiss Franc CHF 02:00 AM Imports OCT 14.85B - 14.79 (R)B
Euro EUR 02:00 AM Unemployment Rate OCT 7.0% - 6.9%
South African Rand ZAR 02:00 AM Leading Index SEP 130.1 - 130.5 (R)
Swiss Franc CHF 02:00 AM Exports OCT 17.00B - 16.70 (R)B
Danish Krone DKK 03:00 AM Consumer Confidence Index NOV -9.2 - -6.6
Swedish Krona SEK 03:30 AM Unemployment Rate OCT 7.5% - 7.2%
Hong Kong Dollar HKD 03:30 AM CPI (Y-o-Y) OCT 5.8% 5.3% 5.8%
Lithuanian Litas LTL 04:00 AM Industrial Production (M-o-M) OCT -2.0% - 0.6%
Lithuanian Litas LTL 04:00 AM Industrial Production (Y-o-Y) OCT -1.3% - 8.3%
Lithuanian Litas LTL 04:00 AM Manufacturing Production (M-o-M) OCT -3.7% - -0.1%
Lithuanian Litas LTL 04:00 AM Manufacturing Production (Y-o-Y) OCT 0.5% - 9.4%
Euro EUR 04:00 AM CB Coincidence Index SEP -0.1% - -0.2 (R)%
Euro EUR 04:00 AM CB Leading Index SEP -1.4% - -2.3 (R)%
Norwegian Krone NOK 04:00 AM GDP (Y-o-Y) Q3 NSA 3.8% - -0.4%
Norwegian Krone NOK 04:00 AM GDP (Q-o-Q) Q3 0.8% 0.7% 1.0%
Pound Sterling (British Pound) GBP 04:30 AM Public Finances (PSNCR) OCT -0.64B 4.25B 20.30 (R)B
Pound Sterling (British Pound) GBP 04:30 AM Public Sector Net Borrowing OCT 3.40B 4B 10.21 (R)B
Croatian Kuna HRK 05:00 AM Unemployment Rate OCT 17.4% - 16.8%
Latvian Lats LVL 06:00 AM PPI (Y-o-Y) OCT 7.3% - 6.8%
Latvian Lats LVL 06:00 AM PPI (M-o-M) OCT - - -0.4%
Brazilian Real BRL 07:30 AM Capital Account Balance - BoP OCT 153M - 181M
Brazilian Real BRL 07:30 AM Current Account Balance - BoP OCT -3.11B -4.9B -2.20B
Brazilian Real BRL 07:30 AM Financial Account Balance - BoP OCT 3.02B - 2.89B
Mexican Peso MXN 08:00 AM GDP (Y-o-Y) Q3 4.5% 3.8% 3.2 (R)%
Polish Zloty PLN 08:00 AM Core CPI (M-o-M) OCT 0.3% - 0.2%
Polish Zloty PLN 08:00 AM Core CPI (Y-o-Y) OCT 2.8% - 2.6%
Mexican Peso MXN 08:00 AM GDP (Q-o-Q) Q3 SA 1.34% - 1.28 (R)%
Canadian Dollar CAD 08:30 AM Retail Sales (M-o-M) SEP 1.0% 0.6% 0.68 (R)%
Canadian Dollar CAD 08:30 AM Retail Sales - Ex. Auto (M-o-M) SEP 0.5% 0.5% 0.49 (R)%
Canadian Dollar CAD 08:30 AM Retail Sales (Y-o-Y) SEP 4.2% - 4.04 (R)%
Canadian Dollar CAD 08:30 AM Retail Sales - Ex. Auto (Y-o-Y) SEP 4.0% - 4.12 (R)%
US Dollar USD 08:30 AM Personal Consumption Expenditure (Y-o-Y) Q3 2.2% - 2.2%
US Dollar USD 08:30 AM GDP (Y-o-Y) Q3 1.5% - 1.6%
US Dollar USD 08:30 AM Core Personal Consumption Expenditure (Y-o-Y) Q3 1.6% - 1.3%
US Dollar USD 08:30 AM GDP (Q-o-Q) Q3 2.0% - 1.3%
US Dollar USD 08:30 AM GDP Deflator (Q-o-Q) Q3 2.5% 2.5% 2.5%
US Dollar USD 08:30 AM Personal Consumption Expenditure (Q-o-Q) Q3 2.3% - 0.7%
US Dollar USD 10:00 AM Richmond Fed Manufacturing Index NOV - -2 -6
US Dollar USD 02:00 PM Monetary Policy Meeting Minutes - - - -
Argentine Peso ARS 03:00 PM Exports OCT 7.53B - 7.96B
Argentine Peso ARS 03:00 PM Imports OCT 6.31B - 6.90B
Argentine Peso ARS 03:00 PM Trade Balance OCT 1.22B - 1.06B
Australian Dollar AUD 06:00 PM CB Leading Index SEP 0.1% -0.1% -0.1%
Australian Dollar AUD 06:00 PM CB Coincidence Index SEP 0.3% - 0.1 (R)%
Australian Dollar AUD 07:30 PM Consruction Work Done Q3 12.5% - 0.7%
Chinese Yuan Renminbi CNY 09:30 PM PMI Manufacturing NOV P 48.0 - 51.0

Wed., Nov 23
Period Actual Forecast Previous
Singapore Dollar SGD 12:00 AM CPI (Y-o-Y) OCT 5.4% 5.2% 5.5%
Turkish Lira TRY 12:00 AM Monetary Policy Meeting - - - -
Singapore Dollar SGD 12:00 AM CPI (M-o-M) OCT 0.4% 0.5% -0.2%
Euro EUR 02:45 AM Business Confidence Indicator NOV 95 - 97
Euro EUR 02:45 AM Production Outlook Indicator NOV -35 - -30
Euro EUR 02:45 AM Own-Company Production Outlook NOV -6 - 3
South African Rand ZAR 03:00 AM CPI (M-o-M) OCT 0.5% - 0.4%
South African Rand ZAR 03:00 AM CPI (Y-o-Y) OCT 6.0% - 5.7%
Euro EUR 03:00 AM PMI Manufacturing NOV P 47.6 - 48.5
Euro EUR 03:00 AM PMI Services NOV P 49.3 - 44.6
Euro EUR 03:00 AM PMI Composite NOV P 48.7 - 45.6
Euro EUR 03:30 AM PMI Manufacturing NOV P 47.9 - 49.1
Euro EUR 03:30 AM PMI Services NOV P 51.4 - 50.6
Euro EUR 03:30 AM PMI Composite NOV P 50.3 - 50.3
Malaysian Ringgit MYR 04:00 AM CPI (M-o-M) OCT 0.2% 0% 0.2%
Malaysian Ringgit MYR 04:00 AM CPI (Y-o-Y) OCT 3.4% 3.25% 3.4%
Norwegian Krone NOK 04:00 AM Unemployment Rate AUG - OCT 3.3% - 3.2%
Euro EUR 04:00 AM PMI Services NOV P 47.8 46.6 46.4
Euro EUR 04:00 AM PMI Composite NOV P 47.2 46.7 46.5
Euro EUR 04:00 AM PMI Manufacturing NOV P 46.4 47.3 47.1
Pound Sterling (British Pound) GBP 04:30 AM Monetary Policy Meeting Minutes - - - -
Pound Sterling (British Pound) GBP 04:30 AM BBA Loans for House Purchase OCT 35.30K - 33.50 (R)K
Iceland Krona ISK 05:00 AM Wage Cost Index (Y-o-Y) OCT 8.9% - 8.4%
Iceland Krona ISK 05:00 AM Wage Cost Index (M-o-M) OCT 0.7% 0.8% 0.8%
Bulgarian Lev BGN 05:00 AM M3 Money Supply (Y-o-Y) OCT 9.59% - 10.26%
Bulgarian Lev BGN 05:00 AM M3 Money Supply (M-o-M) OCT -0.48% - 0.45%
Euro EUR 05:00 AM Industrial New Orders (M-o-M) SEP -6.4% -3% 1.4 (R)%
Euro EUR 05:00 AM Industrial New Orders (Y-o-Y) SEP 1.6% -1.70% 5.9 (R)%
Latvian Lats LVL 06:00 AM Unemployment Rate Q3 14.4% - 16.2%
US Dollar USD 07:00 AM MBA Mortgage Applications NOV 18 -1.2% - -10.0%
Turkish Lira TRY 07:00 AM Interest Rate Decision - 5.75% 5.75% 5.75%
US Dollar USD 08:30 AM Personal Income (M-o-M) OCT 0.4% 0.28% 0.1%
US Dollar USD 08:30 AM Personal Consumption Expenditure Deflator (M-o-M) OCT -0.1% 0% 0.2%
US Dollar USD 08:30 AM Personal Consumption Expenditure Deflator (Y-o-Y) OCT 2.7% 2.7% 2.9%
US Dollar USD 08:30 AM Core PCE Deflator (M-o-M) OCT 0.1% 0.1% 0.0%
US Dollar USD 08:30 AM Core PCE Deflator (Y-o-Y) OCT 1.7% 1.7% 1.6%
US Dollar USD 08:30 AM Durable Goods Orders Ex. Defence (M-o-M) OCT 0.2% - -1.7 (R)%
US Dollar USD 08:30 AM Durable Goods Orders Ex. Transporation (M-o-M) OCT 0.7% 0% 0.6 (R)%
US Dollar USD 08:30 AM Durable Goods Orders (M-o-M) OCT -0.7% -1.55% -1.5 (R)%
US Dollar USD 08:30 AM Personal Spending (M-o-M) OCT 0.1% 0.38% 0.7 (R)%
US Dollar USD 08:30 AM Initial Jobless Claims NOV 19 393K 385K 391 (R)K
Mexican Peso MXN 09:00 AM Retail Sales (M-o-M) SEP 0.95% - 0.06( R)%
Mexican Peso MXN 09:00 AM Retail Sales (Y-o-Y) SEP 4.7% - 2.7%
Mexican Peso MXN 09:00 AM Wholesale Sales (M-o-M) SEP 1.35% - 0.60 (R)%
Mexican Peso MXN 09:00 AM Wholesale Sales (Y-o-Y) SEP 6.3% - 4.9%
US Dollar USD 09:55 AM Univ. of Mich. Consumer Confidence Index NOV 64.1 - 60.9
Mexican Peso MXN 10:00 AM Official Foreign Reserves NOV 18 140.05B - 140.38B
US Dollar USD 10:30 AM EIA Crude Oil Inventory (Barrels) NOV 18 330.8M - 337.0M
Mexican Peso MXN 11:00 AM CB Coincidence Index SEP 0.4% - 0.3%
Mexican Peso MXN 11:00 AM CB Leading Index SEP -0.7% - -1.1 (R)%
US Dollar USD 12:00 PM EIA Natural Gas Inventory (Cubic Feet) NOV 18 3852B - 3843 (R)B
US Dollar USD 01:00 PM EIA Crude Oil Price NOV 18 99.27 - 96.97
New Zealand Dollar NZD 04:45 PM Imports OCT 4.16B - 4.19B
New Zealand Dollar NZD 04:45 PM Exports OCT 3.88B - 3.44B
New Zealand Dollar NZD 04:45 PM Trade Balance OCT -282M -527M -751M

Thu., Nov 24
Period Actual Forecast Previous
Euro EUR 12:00 AM Unemployment Rate OCT 6.0% - 5.9%
Euro EUR 02:00 AM Captial Investment Q3 F 0.9% - 0.4 (R)%
Euro EUR 02:00 AM Construction Investment Q3 F -0.7% - -0.4 (R)%
Euro EUR 02:00 AM Domestic Demand Q3 F 0.4% - 0.2 (R)%
Euro EUR 02:00 AM GDP (Q-o-Q) Q3 F 0.5% - 0.3 (R)%
Euro EUR 02:00 AM GDP (Y-o-Y) Q3 F 2.5% - 3.0 (R)%
Euro EUR 02:00 AM Government Spending Q3 F 0.6% - 0.6 (R)%
Euro EUR 02:00 AM Private Consumption Q3 F 0.8% 0.2% -0.6 (R)%
Czech Koruna CZK 03:00 AM Consumer Confidence Index NOV 72.6 - 80.5
Czech Koruna CZK 03:00 AM Business Climate Indicator NOV 89.5 - 92.4
Hungarian Forint HUF 03:00 AM Retail Sales (M-o-M) SEP - - 0.4%
Euro EUR 03:00 AM Industrial Production (M-o-M) SEP -2.0% - 1.1%
Euro EUR 03:00 AM Industrial Production (Y-o-Y) SEP 2.7% - 5.6%
Hungarian Forint HUF 03:00 AM Retail Sales (Y-o-Y) SEP 0.3% - 0.4%
Swedish Krona SEK 03:15 AM Consumer Confidence Index NOV -7.4 - -7.5
Swedish Krona SEK 03:30 AM PPI (M-o-M) OCT -0.3% - -0.7%
Hong Kong Dollar HKD 03:30 AM Exports OCT 305.69B - 271.80B
Swedish Krona SEK 03:30 AM PPI (Y-o-Y) OCT 0.3% - -0.2%
Hong Kong Dollar HKD 03:30 AM Imports OCT 328.82B - 311.76B
Hong Kong Dollar HKD 03:30 AM Trade Balance OCT -23.14B -32.5B -39.96B
Euro EUR 04:00 AM Germany IFO - Business Climate NOV 106.6 104.88 106.4
Euro EUR 04:00 AM Germany IFO - Current Assessment NOV 116.7 114.9 116.7
Euro EUR 04:00 AM Germany IFO - Expectations NOV 97.3 96 97.0
South African Rand ZAR 04:30 AM PPI (M-o-M) OCT -0.3% - -3.3%
Euro EUR 04:30 AM Consumer Confidence Index NOV 96.5 91.85 93.3
Pound Sterling (British Pound) GBP 04:30 AM Total Business Investment (Q-o-Q) Q3 P -1.4% - 11.6%
Pound Sterling (British Pound) GBP 04:30 AM Total Business Investment (Y-o-Y) Q3 P 0.3% - 3.8%
Pound Sterling (British Pound) GBP 04:30 AM Index of Services (3M-o-3M) SEP 0.6% - 0.6%
Pound Sterling (British Pound) GBP 04:30 AM GDP (Q-o-Q) Q3 F 0.5% 0.4% 0.1%
Pound Sterling (British Pound) GBP 04:30 AM GDP (Y-o-Y) Q3 F 0.5% 0.4% 0.7%
South African Rand ZAR 04:30 AM PPI (Y-o-Y) OCT 10.6% - 10.5%
Brazilian Real BRL 06:00 AM Unemployment Rate OCT 5.8% 6.1% 6.0%
Euro EUR 06:00 AM PPI (M-o-M) OCT 0.3% - 1.2%
Euro EUR 06:00 AM PPI (Y-o-Y) OCT 2.5% - 0.2%
Pound Sterling (British Pound) GBP 07:00 AM CBI Monthly Industrial Trends NOV -19% - -11%
Turkish Lira TRY 07:30 AM Capacity Utilization Rate NOV 75.5% - 75.1%
Canadian Dollar CAD 08:30 AM Non-Farm Payroll (M-o-M) SEP 47.9K - 19 (R)K
Canadian Dollar CAD 08:30 AM Avg Weekly Earnings SEP 872.75 - 875.00 (R)
Euro EUR 09:00 AM Business Sentiment NOV -12.2 -11.25 -10.4
Mexican Peso MXN 09:00 AM CPI (Bi-Weekly) NOV 15 0.97% - 0.06%
Mexican Peso MXN 09:00 AM Exports OCT P 29.04B - 29.02B
Mexican Peso MXN 09:00 AM Imports OCT P 29.49B - 30.18B
Mexican Peso MXN 09:00 AM Trade Balance OCT P -450.8M - -11619M
Mexican Peso MXN 09:00 AM Core CPI (Bi-Weekly) NOV 15 0.25% - 0.06%
South Korea Won KRW 05:00 PM Consumer Confidence Index NOV 103 - 100
Japanese Yen JPY 06:30 PM CPI (Y-o-Y) OCT -0.2% - 0.0%
Japanese Yen JPY 06:30 PM Core CPI (Y-o-Y) OCT -1.0% - 0.2%
Japanese Yen JPY 06:30 PM CPI (M-o-M) OCT 0.1% -0.3% 0.0%
Japanese Yen JPY 06:30 PM Core CPI (M-o-M) OCT -0.1% - 0.0%
Japanese Yen JPY 06:30 PM Tokyo Core CPI (Y-o-Y) NOV -1.1% - -0.4%
Japanese Yen JPY 06:30 PM Tokyo CPI (Y-o-Y) NOV -0.8% - -0.5%
New Zealand Dollar NZD 06:45 PM Exports OCT - - 3.44B
New Zealand Dollar NZD 06:45 PM Imports OCT - - 4.19B
New Zealand Dollar NZD 06:45 PM Trade Balance OCT - -527M -751M
Japanese Yen JPY 06:50 PM Foreigners Buying Japan Stocks (Yen) NOV 13 - NOV 19 -77.2B - -49.9B
Japanese Yen JPY 06:50 PM Japan Buying Foreign Bonds (Yen) NOV 13 - NOV 19 -1005.1B - 232.0B
Japanese Yen JPY 06:50 PM Foreigners Buying Japan Bonds (Yen) NOV 13 - NOV 19 -660.3B - 297.3B
Japanese Yen JPY 06:50 PM Japan Buying Foreign Stocks (Yen) NOV 13 - NOV 19 -13.2B - 76.6B

Fri., Nov 25
Period Actual Forecast Previous
Euro EUR 12:00 AM Exports SEP 1013.7M - 1081.1 (R)M
Euro EUR 12:00 AM Trade Balance SEP -390.4M - -807.9 (R)M
Euro EUR 12:00 AM Imports SEP 1404.0M - 1889.0 (R)M
Philippine Peso PHP 12:00 AM Monetary Policy Meeting Minutes - - - -
Singapore Dollar SGD 12:00 AM Industrial Production (M-o-M) OCT 14.2% -3% -1.5 (R)%
Singapore Dollar SGD 12:00 AM Industrial Production (Y-o-Y) OCT 24.4% 11% 11.3 (R)%
Euro EUR 02:00 AM Import Price Index (M-o-M) OCT -0.3% - 0.6%
Euro EUR 02:00 AM Import Price Index (Y-o-Y) OCT 6.8% - 6.9%
Euro EUR 02:45 AM Consumer Confidence Index OCT 79 81 82
Euro EUR 03:00 AM PPI (M-o-M) OCT - - 0.2%
Euro EUR 03:00 AM PPI (Y-o-Y) OCT 6.5% - 7.1%
Swedish Krona SEK 03:30 AM M2 Money Supply (M-o-M) OCT 0.51% - 2.34%
Swedish Krona SEK 03:30 AM M2 Money Supply (Y-o-Y) OCT 5.4% - 6.5%
Iceland Krona ISK 04:00 AM CPI (M-o-M) NOV - - 0.3%
Iceland Krona ISK 04:00 AM CPI (Y-o-Y) NOV 5.2% 0.2% 5.3%
Euro EUR 04:00 AM Retail Sales (Y-o-Y) SEP -1.6% -0.7% -0.3%
Euro EUR 04:00 AM Retail Sales (M-o-M) SEP -0.4% -0.15% 0.0%
Polish Zloty PLN 04:00 AM Unemployment Rate OCT 11.8% 11.8% 11.8%
Polish Zloty PLN 04:00 AM Retail Sales (Y-o-Y) OCT 11.2% 10.8% 11.4%
Euro EUR 05:00 AM Exports SEP 1.37B - 1.09B
Euro EUR 05:00 AM Imports SEP 2.81B - 2.37B
Euro EUR 05:00 AM Trade Balance SEP -1.44B - -1.27B
Indian Rupee INR 06:30 AM Official Foreign Reserves NOV 18 308.62B - 314.34B
Mexican Peso MXN 09:00 AM Unemployment Rate OCT 4.83% - 5.21 (R)%
Mexican Peso MXN 10:00 AM Current Account Balance - BoP Q3 -3.76B -2B -2.98 (R)B
Mexican Peso MXN 10:00 AM Capital Account Balance - BoP Q3 9.42B - 12.83 (R)B


Results of week of 11/13/2011 to 11/18/2011

13 November 2011 to 18 November 2011


Sun., Nov 13
Period Actual Forecast Previous
New Zealand Dollar NZD 05:30 PM Performance of Services Index OCT 50.6 - 52.9 (R)
New Zealand Dollar NZD 06:45 PM Retail Sales (Y-o-Y) Q3 2.2% 0.8% -0.6%
Australian Dollar AUD 09:30 PM Building Approvals (Y-o-Y) SEP - - -5.5%
Australian Dollar AUD 09:30 PM Building Approvals (M-o-M) SEP - - 11.4%
Mon., Nov 14
Period Actual Forecast Previous
South Korea Won KRW 12:00 AM Exports OCT 46.82B - 46.55B
South Korea Won KRW 12:00 AM Imports OCT 42.76B - 45.27B
South Korea Won KRW 12:00 AM Merchandise Trade Balance OCT 1.28B - 4.07B
Brazilian Real BRL 12:00 AM M2 Money Supply (M-o-M) SEP 2.2% - 1.4%
Brazilian Real BRL 12:00 AM M2 Money Supply (Y-o-Y) SEP 21.8% - 21.9%
Brazilian Real BRL 12:00 AM M4 Money Supply (M-o-M) SEP 1.0% - 1.7%
Brazilian Real BRL 12:00 AM M4 Money Supply (Y-o-Y) SEP 14.6% - 17.6%
Japanese Yen JPY 12:30 AM Industrial Production (Y-o-Y) SEP F -3.3% - 0.4%
Japanese Yen JPY 12:30 AM Capacity Utilization (M-o-M) SEP F -3.6% - 2.4%
Japanese Yen JPY 12:30 AM Industrial Production (M-o-M) SEP F -3.3% - 0.4%
Estonian Kroon EEK 01:00 AM Unemployment Rate Q3 10.9% - 13.3%
Indian Rupee INR 01:30 AM Wholesale Price Index (Y-o-Y) OCT 9.73% 9.6% 9.72%
Euro EUR 02:00 AM Retail Sales (Y-o-Y) SEP - - 7.7%
Euro EUR 02:00 AM Retail Sales (Y-o-Y) SEP 7.7% - 7.7%
Euro EUR 02:00 AM CPI (Y-o-Y) OCT 3.5% 3.6% 3.7%
Euro EUR 02:00 AM CPI (M-o-M) OCT 0.2% 0.3% 0.4%
Euro EUR 02:00 AM CPI - EU Harmonised (M-o-M) OCT 0.2% - 0.4%
Euro EUR 02:00 AM CPI - EU Harmonised (Y-o-Y) OCT 3.2% - 3.5%
Euro EUR 02:00 AM Wholesale Sales (Y-o-Y) SEP 6.7% - 11.7%
Euro EUR 02:45 AM Financial Account Balance - BoP SEP -10.1B - 25.3B
Euro EUR 02:45 AM Capital Account Balance - BoP SEP - - 0.1B
Euro EUR 02:45 AM Current Account Balance - BoP SEP -4.0B -2.5B -2.4 (R)B
Swiss Franc CHF 03:15 AM PPI (M-o-M) OCT -0.1% - -0.1%
Swiss Franc CHF 03:15 AM PPI (Y-o-Y) OCT -1.8% - -1.9%
Swiss Franc CHF 03:15 AM Producer & Import Prices (M-o-M) OCT -0.2% - -0.1%
Swiss Franc CHF 03:15 AM Producer & Import Prices (Y-o-Y) OCT -1.8% - -2.0%
Bulgarian Lev BGN 04:00 AM CPI - EU Harmonised (Y-o-Y) OCT 3.0% - 2.9%
Bulgarian Lev BGN 04:00 AM CPI (M-o-M) OCT 0.8% - 0.0%
Bulgarian Lev BGN 04:00 AM CPI (Y-o-Y) OCT 3.5% - 3.3%
Bulgarian Lev BGN 04:00 AM CPI - EU Harmonised (M-o-M) OCT 0.3% - 0.0%
Euro EUR 05:00 AM Industrial Production (M-o-M) SEP -2.0% -2.6% 14 (R)%
Euro EUR 05:00 AM Industrial Production (Y-o-Y) SEP 2.2% 2.7% 6.0 (R)%
Croatian Kuna HRK 05:00 AM Retail Sales (M-o-M) SEP -11.9% - -0.8%
Croatian Kuna HRK 05:00 AM Retail Sales (Y-o-Y) SEP 1.0% - 2.0%
Euro EUR 05:00 AM GDP (Q-o-Q) Q3 P -0.4% - 0.0%
Euro EUR 05:00 AM GDP (Y-o-Y) Q3 P -1.7% - -0.9%
Polish Zloty PLN 08:00 AM M3 Money Supply (M-o-M) OCT 0.64% 9.6% 1.68 (R)%
Polish Zloty PLN 08:00 AM M3 Money Supply (Y-o-Y) OCT 10.34% - 10.13%
Pound Sterling (British Pound) GBP 07:01 PM BRC Retail Sales Monitor OCT - - 0.3%

Tue., Nov 15
Period Actual Forecast Previous
Euro EUR 12:00 AM Capital Account Balance - BoP SEP -0.17B - 335.56B
Euro EUR 12:00 AM Current Account Balance - BoP SEP -859.48B - -36.87B
Euro EUR 12:00 AM Capital Account Balance - BoP SEP 13M - 13M
Euro EUR 12:00 AM Financial Account Balance - BoP SEP -0.67B - -1.82 (R)B
Euro EUR 12:00 AM Current Account Balance - BoP SEP 455M - 97 (R)M
Bulgarian Lev BGN 12:00 AM Current Account Balance - BoP SEP 119.7M - 705.7M
Bulgarian Lev BGN 12:00 AM Capital Account Balance - BoP SEP 48.2M - 30.4M
Bulgarian Lev BGN 12:00 AM Financial Account Balance - BoP SEP -7.1M - 22.2M
Euro EUR 12:00 AM PPI (M-o-M) OCT 0.8% - -1.3%
Euro EUR 12:00 AM PPI (Y-o-Y) OCT 9.5% - 4.9%
Euro EUR 12:00 AM Current Account Balance - BoP SEP 38.6M - -81.8M
Euro EUR 12:00 AM Financial Account Balance - BoP SEP -47.5M - -26.9M
Euro EUR 12:00 AM Capital Account Balance - BoP SEP 2.9M - -4.2M
Singapore Dollar SGD 12:00 AM Retail Sales (Y-o-Y) SEP -0.1% 3% 3.5 (R)%
Singapore Dollar SGD 01:00 AM Retail Sales (M-o-M) SEP 0.3% 2.3% -7.2%
Euro EUR 01:30 AM GDP (Q-o-Q) Q3 P 0.4% 0.4% 0.0%
Euro EUR 01:30 AM GDP (Y-o-Y) Q3 P 1.57% 1.6% 1.58%
Euro EUR 02:00 AM GDP (Q-o-Q) Q3 P 0.5% 0.4% 0.1%
Euro EUR 02:00 AM GDP (Y-o-Y) Q3 P 2.5% 2.45% 2.8%
Euro EUR 03:00 AM GDP (Q-o-Q) Q3 0.3% 0.4% 0.5 (R)%
Euro EUR 03:00 AM GDP (Y-o-Y) Q3 2.6% 2.5% 3.9 (R)%
Hungarian Forint HUF 03:00 AM GDP (Y-o-Y) Q3 P 1.4% 0.5% 1.5%
Turkish Lira TRY 03:00 AM Current Account Balance - BoP SEP -6.76B - -4.11 (R)B
Turkish Lira TRY 03:00 AM Financial Account Balance - BoP SEP 4.13B - 4.44 (R)B
Euro EUR 03:00 AM CPI (M-o-M) OCT 0.8% - 0.2%
Euro EUR 03:00 AM CPI (Y-o-Y) OCT 3.0% - 3.1%
Euro EUR 03:00 AM CPI - EU Harmonised (M-o-M) OCT 0.4% 0.4% 1.2%
Euro EUR 03:00 AM CPI - EU Harmonised (Y-o-Y) OCT 3.0% 3% 3.0%
Hungarian Forint HUF 03:00 AM Industrial Production (Y-o-Y) SEP F 3.0% - 4.4%
Hungarian Forint HUF 03:00 AM Industrial Production (M-o-M) SEP F 3.9% - -1.3%
Turkish Lira TRY 03:00 AM Participation Rate AUG 50.0% - 50.0%
Turkish Lira TRY 03:00 AM Unemployment Rate AUG 9.6% - 10.0 (R)%
Danish Krone DKK 03:00 AM PPI (Y-o-Y) OCT 5.5% - 5.9%
Danish Krone DKK 03:00 AM PPI (M-o-M) OCT -0.1% - -0.2%
Czech Koruna CZK 03:00 AM PPI (M-o-M) OCT - 0.2% 0.2%
Czech Koruna CZK 03:00 AM PPI (Y-o-Y) OCT 5.6% 5.7% 5.6%
Czech Koruna CZK 03:00 AM GDP (Q-o-Q) Q3 P 0.1% - 0.1%
Czech Koruna CZK 03:00 AM GDP (Y-o-Y) Q3 P 1.5% - 2.2%
Hungarian Forint HUF 03:00 AM GDP (Q-o-Q) Q3 P 0.5% 0% 0.0%
Euro EUR 03:00 AM GDP (Y-o-Y) Q3 3.2% - 3.3%
Euro EUR 03:30 AM Exports SEP 34.88B - 32.69 (R)B
Euro EUR 03:30 AM Trade Balance SEP 3.58B - 2.30 (R)B
Euro EUR 03:30 AM Imports SEP 31.30B - 30.39 (R)B
Euro EUR 03:30 AM Retail Sales (M-o-M) SEP -0.20% - -4.2%
Euro EUR 03:30 AM GDP (Q-o-Q) Q3 P -0.3% - 0.2%
Euro EUR 03:30 AM GDP (Y-o-Y) Q3 P 1.1% - 1.6%
Euro EUR 03:30 AM Retail Sales (Y-o-Y) SEP -4.0% - -0.2%
Bulgarian Lev BGN 04:00 AM GDP (Y-o-Y) Q3 P 1.3% - 2.0%
Bulgarian Lev BGN 04:00 AM GDP (Q-o-Q) Q3 P - - 0.3%
Czech Koruna CZK 04:00 AM Capital Account Balance - BoP SEP 121.8M - 0.78M
Czech Koruna CZK 04:00 AM Financial Account Balance - BoP SEP -20.46B - 29.96B
Euro EUR 04:00 AM Trade Balance SEP -1.35B -2.5B -2.40 (R)B
Euro EUR 04:00 AM Exports SEP 32.13B - 31.51 (R)B
Euro EUR 04:00 AM Imports SEP 33.48B - 33.91 (R)B
Euro EUR 04:00 AM Trade Balance EU SEP -1.05B - -2.03 (R)B
Norwegian Krone NOK 04:00 AM Imports OCT 43.99B - 41.74B
Norwegian Krone NOK 04:00 AM Exports OCT 70.70B - 75.89B
Norwegian Krone NOK 04:00 AM Trade Balance OCT 26.70B - 34.15B
Czech Koruna CZK 04:00 AM Current Account Balance - BoP SEP 5.17B -20B -33.65B
Pound Sterling (British Pound) GBP 04:30 AM DCLG UK House Prices (Y-o-Y) SEP -1.4% - -1.3%
Pound Sterling (British Pound) GBP 04:30 AM Core CPI (M-o-M) OCT 0.1% - 0.7%
Pound Sterling (British Pound) GBP 04:30 AM Core CPI (Y-o-Y) OCT 3.5% - 3.7%
Pound Sterling (British Pound) GBP 04:30 AM CPI (M-o-M) OCT 0.1% 0.25% 0.7%
Pound Sterling (British Pound) GBP 04:30 AM Retail Price Index (Y-o-Y) OCT 5.4% 5.6% 5.6%
Pound Sterling (British Pound) GBP 04:30 AM Retail Price Index (M-o-M) OCT - 0.2% 0.8%
Pound Sterling (British Pound) GBP 04:30 AM CPI (Y-o-Y) OCT 5.0% 5.12% 5.2%
Euro EUR 05:00 AM GDP (Q-o-Q) Q3 0.2% 0.16% 0.2%
Euro EUR 05:00 AM GDP (Y-o-Y) Q3 1.4% 1.43% 1.6%
Croatian Kuna HRK 05:00 AM CPI (M-o-M) OCT 0.6% - 0.4%
Croatian Kuna HRK 05:00 AM CPI (Y-o-Y) OCT 2.6% - 2.2%
Croatian Kuna HRK 05:00 AM Core CPI (M-o-M) OCT 1.1% - 0.6%
Euro EUR 05:00 AM Imports SEP 148.1B - 141.5 (R)B
Croatian Kuna HRK 05:00 AM Core CPI (Y-o-Y) OCT - - -0.8%
Euro EUR 05:00 AM Exports SEP 151.0B - 137.1 (R)B
Euro EUR 05:00 AM ZEW Survey (Current Situation) NOV -39.8 - -31.7
Euro EUR 05:00 AM ZEW Survey (Econ. Sentiment) NOV -59.1 - -51.2
Euro EUR 05:00 AM ZEW Survey (Current Situation) NOV 34.2 30 38.4
Euro EUR 05:00 AM GDP (Q-o-Q) Q3 P 3.2% - 8.1%
Euro EUR 05:00 AM GDP (Y-o-Y) Q3 P -5.2% - -7.3%
Euro EUR 05:00 AM Trade Balance SEP 2.9B 0.6B -4.4 (R)B
Euro EUR 05:00 AM ZEW Survey (Econ. Sentiment) NOV -55.2 -55.5 -48.3
Euro EUR 05:00 AM GDP (Y-o-Y) Q3 -0.6% - 1.3%
Euro EUR 05:00 AM GDP (Q-o-Q) Q3 -0.7% - 0.2%
Polish Zloty PLN 08:00 AM Capital Account Balance - BoP SEP 0.30B - 0.39B
Polish Zloty PLN 08:00 AM Financial Account Balance - BoP SEP 0.57B - 1.06 (R)B
Polish Zloty PLN 08:00 AM CPI (M-o-M) OCT 0.7% - 0.1%
Polish Zloty PLN 08:00 AM CPI (Y-o-Y) OCT 4.3% 4.1% 3.9%
Polish Zloty PLN 08:00 AM Current Account Balance - BoP SEP -1.90B -1.9B -2.02 (R)B
US Dollar USD 08:30 AM Retail Sales (Y-o-Y) OCT 7.2% - 7.9%
US Dollar USD 08:30 AM Retail Sales (M-o-M) OCT 0.5% 0.44% 1.1%
Canadian Dollar CAD 08:30 AM Manufacturing Shipments (Y-o-Y) SEP 10.8% - 7.39 (R)%
Canadian Dollar CAD 08:30 AM Manufacturing Shipments (M-o-M) SEP 2.6% - 2.04 (R)%
US Dollar USD 08:30 AM Empire State Mfr Index - Prices Paid NOV 18.29 - 22.47
US Dollar USD 08:30 AM Empire State Mfr Index - Prices Received NOV 6.10 - 4.49
US Dollar USD 08:30 AM PPI (M-o-M) OCT -0.3% 0% 0.8%
US Dollar USD 08:30 AM Core PPI (M-o-M) OCT - 0.2% 0.2%
US Dollar USD 08:30 AM PPI (Y-o-Y) OCT 5.9% 6.3% 6.9%
Canadian Dollar CAD 08:30 AM New Motor Vehicle Sales (Y-o-Y) SEP -0.4% - 1.44 (R)%
Canadian Dollar CAD 08:30 AM New Motor Vehicle Sales (M-o-M) SEP 1.5% - -0.02 (R)%
US Dollar USD 08:30 AM Retail Sales - Ex. Auto (M-o-M) OCT 0.6% 0.32% 0.5 (R)%
US Dollar USD 08:30 AM Empire State Mfr Index - Business Condition NOV 0.61 -2.39 -8.48
US Dollar USD 08:30 AM Retail Sales - Ex. Auto (Y-o-Y) OCT 7.3% - 7.7 (R)%
US Dollar USD 10:00 AM Business Sales (M-o-M) SEP 0.6% - 0.4 (R)%
US Dollar USD 10:00 AM Business Inventories (M-o-M) SEP - 0.3% 0.4 (R)%
Mexican Peso MXN 10:00 AM Official Foreign Reserves NOV 11 140.38B - 140.39B
US Dollar USD 10:00 AM Business Inventories (Y-o-Y) SEP 9.0% - 6.72 (R)%
US Dollar USD 10:00 AM Business Sales (Y-o-Y) SEP 11.6% - 9.31 (R)%

Wed., Nov 16
Period Actual Forecast Previous
Iceland Krona ISK 12:00 AM Monetary Policy Meeting Minutes - - - -
Japanese Yen JPY 12:00 AM Monetary Policy Meeting - - - -
Japanese Yen JPY 12:00 AM Interest Rate Decision - - 0.1% 0 - 0.10%
Euro EUR 03:00 AM GDP (Y-o-Y) Q3 F 0.8% 0.75% 0.7%
Euro EUR 03:00 AM GDP (Q-o-Q) Q3 F - 0% 0.2%
Turkish Lira TRY 03:00 AM Consumer Confidence Index OCT 89.7 90.5 93.7
Euro EUR 03:00 AM CPI - EU Harmonised (M-o-M) OCT 0.2% 0.2% 0.3%
Euro EUR 03:00 AM CPI - EU Harmonised (Y-o-Y) OCT 4.6% 4.6% 4.4%
Swedish Krona SEK 03:30 AM Capacity Utilization Rate Q3 88.9% - 88.8%
Euro EUR 04:00 AM CPI - EU Harmonised (Y-o-Y) OCT 3.8% - 3.9 (R)%
Euro EUR 04:00 AM CPI (M-o-M) OCT 0.1% - 0.4%
Euro EUR 04:00 AM CPI (Y-o-Y) OCT 3.4% - 3.6%
Euro EUR 04:00 AM CPI - EU Harmonised (M-o-M) OCT 0.2% - 0.6%
Euro EUR 04:00 AM CB Coincidence Index SEP 0.1% - 0.2%
Euro EUR 04:00 AM CB Leading Index SEP -0.3% - -0.2%
Euro EUR 04:00 AM CPI - EU Harmonised (M-o-M) OCT F 0.9% 0.9% 2.0%
Euro EUR 04:00 AM CPI (M-o-M) OCT F 0.6% - 0.0%
Euro EUR 04:00 AM CPI - EU Harmonised (Y-o-Y) OCT F 3.8% 3.8% 3.6%
Euro EUR 04:00 AM CPI (Y-o-Y) OCT F 3.4% - 3.0%
Pound Sterling (British Pound) GBP 04:30 AM Jobless Claims Change SEP 5.3K 25K 17.5K
Pound Sterling (British Pound) GBP 04:30 AM Avg Earnings ex bonus (3M-o-Y) SEP 1.7% 1.70% 1.8%
Pound Sterling (British Pound) GBP 04:30 AM Claimant Count Rate SEP 5.0% 15.05% 5.0%
Pound Sterling (British Pound) GBP 04:30 AM Avg Earnings Inc bonus (3M-o-Y) SEP 2.3% 2.53% 2.7 (R)%
Pound Sterling (British Pound) GBP 04:30 AM ILO Unemployment Rate SEP 8.3% 8.17% 8.1%
Euro EUR 05:00 AM CPI - EU Harmonised (M-o-M) OCT -0.9% - -0.4%
Euro EUR 05:00 AM CPI - EU Harmonised (Y-o-Y) OCT 2.4% - 2.7%
Euro EUR 05:00 AM CPI (M-o-M) OCT 0.3% 0.25% 0.8%
Euro EUR 05:00 AM Core CPI (M-o-M) OCT 0.3% - 0.9%
Euro EUR 05:00 AM Core CPI (Y-o-Y) OCT 1.6% 1.57% 1.6%
Euro EUR 05:00 AM CPI (Y-o-Y) OCT 3.0% 2.98% 3.0%
South African Rand ZAR 06:00 AM Retail Sales (M-o-M) SEP 1.8% - 0.7%
South African Rand ZAR 06:00 AM Retail Sales (Y-o-Y) SEP 8.3% - 7.1%
Euro EUR 06:00 AM Exports SEP 7.92B - 7.73 (R)B
Euro EUR 06:00 AM Imports SEP 3.80B - 4.01 (R)B
Euro EUR 06:00 AM Trade Balance SEP 4.11B - 3.71 (R)B
Euro EUR 06:03 AM Unemployment Rate Q3 12.4% - 12.1%
US Dollar USD 07:00 AM MBA Mortgage Applications NOV 11 -10.0% - 10.3%
US Dollar USD 08:30 AM Core CPI (M-o-M) OCT 0.1% 0.12% 0.1%
US Dollar USD 08:30 AM Core CPI (Y-o-Y) OCT NSA 2.1% 2.2% 2.0%
US Dollar USD 08:30 AM CPI (Y-o-Y) OCT NSA 3.5% 3.55% 3.9%
US Dollar USD 08:30 AM CPI (M-o-M) OCT -0.1% -0.02% 0.3%
Euro EUR 09:00 AM Imports AUG 20.4B - 19.5B
Euro EUR 09:00 AM Trade Balance AUG -0.5B - -1.6B
Euro EUR 09:00 AM Exports AUG 19.8B - 17.9B
US Dollar USD 09:00 AM Net Long-term TIC Flows SEP 68.6B - 58.0 (R)B
US Dollar USD 09:00 AM Total Net TIC Flows SEP 57.4B 98B 89.3 (R)B
US Dollar USD 09:15 AM Capacity Utilization (M-o-M) OCT 77.8% 77.80% 77.3 (R)%
US Dollar USD 09:15 AM Industrial Production (M-o-M) OCT 0.7% 0.45% -0.1 (R)%
US Dollar USD 09:15 AM Industrial Production (Y-o-Y) OCT 3.9% - 3.2%
US Dollar USD 10:00 AM NAHB/Wells Fargo Housing Market Index SEP 20 17 18
US Dollar USD 10:30 AM EIA Crude Oil Inventory (Barrels) NOV 11 337.0M - 338.1M
Hungarian Forint HUF 11:00 AM Monetary Policy Meeting Minutes - - - -
US Dollar USD 01:00 PM EIA Crude Oil Price NOV 11 96.97 - 93.24
New Zealand Dollar NZD 06:45 PM PPI Output (Q-o-Q) Q3 0.2% 0.8% 1.4%
New Zealand Dollar NZD 06:45 PM PPI Input (Y-o-Y) Q3 4.7% - 4.8%
New Zealand Dollar NZD 06:45 PM PPI Output (Y-o-Y) Q3 3.5% - 4.5%
New Zealand Dollar NZD 06:45 PM PPI Input (Q-o-Q) Q3 0.6% 0.6% 0.9%
Pound Sterling (British Pound) GBP 07:01 PM Nationwide Consumer Confidence OCT 36 - 45
Japanese Yen JPY 07:50 PM Foreigners Buying Japan Bonds (Yen) NOV 6 - NOV 12 297.3B - 229.7B
Japanese Yen JPY 07:50 PM Japan Buying Foreign Bonds (Yen) NOV 6 - NOV 12 232.0B - 1636.6B
Japanese Yen JPY 07:50 PM Foreigners Buying Japan Stocks (Yen) NOV 6 - NOV 12 -49.9B - -104.4B
Japanese Yen JPY 07:50 PM Japan Buying Foreign Stocks (Yen) NOV 6 - NOV 12 76.6B - 190.4B
Australian Dollar AUD 09:30 PM Wage Cost Index (Q-o-Q) Q3 0.8% 0.95% 0.9%
Australian Dollar AUD 09:30 PM Wage Cost Index (Y-o-Y) Q3 3.7 % - 3.8 %
Chinese Yuan Renminbi CNY 10:00 PM CB Coincidence Index SEP 0.6% - 0.4 (R)%
Chinese Yuan Renminbi CNY 10:00 PM CB Leading Index SEP 0.4% - 0.6 (R)%

Thu., Nov 17
Period Actual Forecast Previous
Singapore Dollar SGD 12:00 AM Imports OCT 38.58B - 37.77 (R)B
Singapore Dollar SGD 12:00 AM Exports OCT 43.42B - 44.44 (R)B
Singapore Dollar SGD 12:00 AM Trade Balance OCT 4.84B - 6.66 (R)B
Euro EUR 02:00 AM PPI (M-o-M) OCT -0.5% - -0.3%
Euro EUR 02:00 AM PPI (Y-o-Y) OCT 3.7% - 4.3%
Hong Kong Dollar HKD 03:30 AM Unemployment Rate OCT 3.3% 3.2% 3.2%
Euro EUR 03:30 AM Unemployment Rate OCT 5.8% - 5.6%
Euro EUR 03:30 AM Consumer Confidence Index NOV -32 - -33
South African Rand ZAR 04:00 AM Wholesale Sales (Y-o-Y) SEP 9.5% - 7.7%
South African Rand ZAR 04:00 AM Wholesale Sales (M-o-M) SEP 0.9% - 6.4%
Pound Sterling (British Pound) GBP 04:30 AM Retail Sales (M-o-M) OCT 0.6% -0.16% 0.6%
Pound Sterling (British Pound) GBP 04:30 AM Retail Sales - Ex. Auto (M-o-M) OCT 0.6% -0.1% 0.7%
Pound Sterling (British Pound) GBP 04:30 AM Retail Sales - Ex. Auto (Y-o-Y) OCT 0.9% 0.1% 0.4%
Pound Sterling (British Pound) GBP 04:30 AM Retail Sales (Y-o-Y) OCT 0.9% -0.07% 0.6%
Iceland Krona ISK 05:00 AM CPI - EU Harmonised (Y-o-Y) OCT 5.3% - 5.6%
Iceland Krona ISK 05:00 AM CPI - EU Harmonised (M-o-M) OCT 0.4% - 0.5%
Euro EUR 05:00 AM Construction Orders (M-o-M) SEP -1.3% - -0.4(R)%
Euro EUR 05:00 AM Construction Orders (Y-o-Y) SEP 0.4% - 1.9 (R)%
Swiss Franc CHF 05:00 AM ZEW Survey (Expectations) NOV -64.3 - -54.4
Euro EUR 07:45 AM Monetary Policy Meeting - - - -
Polish Zloty PLN 08:00 AM Monetary Policy Meeting Minutes - - - -
Canadian Dollar CAD 08:30 AM Foreign Investment in Canadian Securities SEP 7.35B - 8.22 (R)B
Canadian Dollar CAD 08:30 AM Canadian Investment in Foreign Securities SEP -0.72B - -2.05B
US Dollar USD 08:30 AM Building Permits (M-o-M) OCT 653K - 589 (R)K
US Dollar USD 08:30 AM Initial Jobless Claims NOV 13 388K 391K 393 (R)K
US Dollar USD 08:30 AM Housing Starts (M-o-M) OCT 628K 610.33K 630 (R)K
US Dollar USD 10:00 AM Philly Fed's Mfr Index - Business Condition NOV 3.6 8.7 8.7
US Dollar USD 10:00 AM Philly Fed's Mfr Index - Prices Received NOV 2.6 - -2.5
US Dollar USD 10:00 AM Philly Fed's Mfr Index - Prices Paid NOV 22.8 - 20.0
US Dollar USD 10:30 AM EIA Natural Gas Inventory (Cubic Feet) NOV 12 3850B - 3831B

Fri., Nov 18
Period Actual Forecast Previous
Lithuanian Litas LTL 12:00 AM Unemployment Rate Q3 14.8% - 15.6%
Philippine Peso PHP 12:00 AM Current Account Balance - BoP OCT 0.21B - 0.72B
Euro EUR 02:00 AM PPI (M-o-M) OCT 0.2% 0.1% 0.3%
Euro EUR 02:00 AM PPI (Y-o-Y) OCT 5.3% 5.3% 5.5%
Euro EUR 03:00 AM PPI (Y-o-Y) SEP 3.5% - 3.2%
Euro EUR 03:00 AM PPI (M-o-M) SEP 0.5% - -0.2%
Euro EUR 04:00 AM Industrial Sales (M-o-M) SEP -5.4% - 4.0%
Euro EUR 04:00 AM Industrial Orders (M-o-M) SEP -8.3% -1.75% 5.0%
Euro EUR 04:30 AM PPI (M-o-M) OCT -0.1% - -0.1%
Euro EUR 04:30 AM PPI (Y-o-Y) OCT 3.7% - 4.1%
Euro EUR 05:00 AM Financial Account Balance - BoP SEP 13.46B - 10.29B
Euro EUR 05:00 AM Current Account Balance - BoP SEP -3.53B - -5.39B
Euro EUR 05:00 AM Capital Account Balance - BoP SEP -6M - -7M

Results of week of 6/11/2011 to 11/11/2011

6 November 2011 to 11 November 2011


Date       Time       Currency Event       Importance       Actual      Forecast Previous      Notes

Sun Nov 6

22:30 Currency: aud AUD AiG Perf of Constr Index (OCT) Low 34.7 30.0

Mon Nov 7
Currency: jpy JPY Tokyo Avg Office Vacancies (%) (OCT) Low 8.64
00:01 Currency: gbp GBP Lloyds Employment Confidence (OCT) Low -72 -67
00:30 Currency: aud AUD ANZ Job Advertisements (MoM) (OCT) Medium -0.7% -2.2%
05:00 Currency: jpy JPY Coincident Index (SEP P) Low 88.9 89.0 90.3
05:00 Currency: jpy JPY Leading Index CI (SEP P) Low 91.6 91.9 93.8
06:45 Currency: chf CHF Unemployment Rate (OCT) Medium 2.9% 2.9% 2.8%
06:45 Currency: chf CHF Unemployment Rate s.a. (OCT) Medium 3.0% 3.0% 3.0%
08:00 Currency: gbp GBP Halifax House Price 3MoY (OCT) Low -1.8% -2.3% -2.3%
08:00 Currency: gbp GBP Halifax Plc House Prices s.a. MoM (OCT) Low 1.2% 0.1% -0.5%
08:15 Currency: chf CHF CPI - EU Harmonised (MoM) (OCT) Medium -0.1% 0.3%
08:15 Currency: chf CHF CPI - EU Harmonised (YoY) (OCT) Medium -0.5% 0.2%
08:15 Currency: chf CHF Consumer Price Index (MoM) (OCT) Medium -0.1% 0.2% 0.3%
08:15 Currency: chf CHF Consumer Price Index (YoY) (OCT) Medium -0.1% 0.2% 0.5%
09:30 Currency: eur EUR Euro-Zone Sentix Investor Confidence (NOV) Medium -21.2 -20.0 -18.5
10:00 Currency: eur EUR Euro-Zone Retail Sales (YoY) (SEP) Medium -1.5% -0.5% -0.1%
10:00 Currency: eur EUR Euro-Zone Retail Sales (MoM) (SEP) Low -0.7% -0.1% 0.1%
11:00 Currency: eur EUR German Industrial Production n.s.a. and w.d.a. (YoY) (SEP) Medium 5.4% 7.2% 8.4%
11:00 Currency: eur EUR German Industrial Production s.a. (MoM) (SEP) Low -2.7% -0.9% -0.4%
20:00 Currency: usd USD Consumer Credit (SEP) Medium $7.386B $5.150B -$9.682B
23:50 Currency: jpy JPY Official Reserve Assets (OCT) Low $1209.9B $1200.6B

Tue Nov 8
00:01 Currency: gbp GBP RICS House Price Balance (OCT) Medium -24% -23% -23%
00:01 Currency: gbp GBP BRC Sales Like-For-Like (YoY) (OCT) Low -0.6% -0.2% 0.3%
00:30 Currency: aud AUD NAB Business Conditions (OCT) Medium -1 -2
00:30 Currency: aud AUD NAB Business Confidence (OCT) Medium 2 -1
00:30 Currency: aud AUD Trade Balance (Australian dollar) (SEP) Medium 2564M 3000M 3100M
06:45 Currency: chf CHF SECO Consumer Confidence (OCT) Medium -24 -22 -17
07:00 Currency: eur EUR German Trade Balance (euros) (SEP) Medium 17.4B 12.5B 11.8B
07:00 Currency: eur EUR German Current Account (euros) (SEP) Low 15.7B 12.3B 6.5B
07:00 Currency: eur EUR German Exports s.a. (MoM) (SEP) Low 0.9% -0.8% 3.2%
07:00 Currency: eur EUR German Imports s.a. (MoM) (SEP) Low -0.8% 0.4% -0.1%
07:45 Currency: eur EUR French Trade Balance (euros) (SEP) Low -6303M -5800M -4310M
08:30 Currency: gbp GBP Industrial Production (YoY) (SEP) Medium -0.7% -0.8% -0.9%
08:30 Currency: gbp GBP Industrial Production (MoM) (SEP) Low 0.0% 0.1% 0.3%
09:30 Currency: gbp GBP Manufacturing Production (YoY) (SEP) Medium 2.0% 1.9% 1.6%
09:30 Currency: gbp GBP Manufacturing Production (MoM) (SEP) Low 0.2% 0.1% -0.3%
12:30 Currency: usd USD NFIB Small Business Optimism (OCT) Low 90.2 90.0 88.9
13:15 Currency: cad CAD Housing Starts (OCT) Medium 207.6K 195.0K 208.8K
15:00 Currency: gbp GBP NIESR Gross Domestic Product Estimate (OCT) Medium 0.5% 0.5%
15:00 Currency: usd USD IBD/TIPP Economic Optimism (NOV) Low 40.6 41.0 40.3
15:00 Currency: usd USD JOLTs Job Openings (SEP) Low 3354 3129
18:00 Currency: usd USD Fed's Kocherlakota Speaks in Sioux Falls, South Dakota Low
18:30 Currency: usd USD Fed's Plosser Speaks on Monetary Policy in Philadelphia Low
21:45 Currency: nzd NZD NZ Card Spending - Retail (MoM) (OCT) Low 1.5% 0.7% 0.7%
21:45 Currency: nzd NZD NZ Card Spending (MoM) (OCT) Low 1.8% 0.6% 0.4%
23:00 Currency: nzd NZD QV House Prices (YoY) (OCT) Low 1.2% 0.7%
23:30 Currency: aud AUD Westpac Consumer Confidence (NOV) Medium 6.3% 0.4%
23:30 Currency: aud AUD Westpac Consumer Confidence Index (NOV) Low 103.4 97.2
23:50 Currency: jpy JPY Trade Balance - BOP Basis (Yen) (SEP) Medium ¥373.2B ¥351.7B -¥694.7B
23:50 Currency: jpy JPY Adjusted Current Account Total (Yen) (SEP) Low ¥1186.6B ¥963.2B ¥652.6B
23:50 Currency: jpy JPY Bank Lending Banks ex-Trust (OCT) Low 0.1% -0.2% -0.3%
23:50 Currency: jpy JPY Bank Lending incl Trusts (YoY) (OCT) Low 0.0% -0.1% -0.3%
23:50 Currency: jpy JPY Current Account Balance (YoY) (SEP) Low -21.40% -31.30% -64.30%
23:50 Currency: jpy JPY Current Account Total (Yen) (SEP) Low ¥1584.8B ¥1452.2B ¥407.5B

Wed Nov 9
00:01 Currency: gbp GBP BRC Shop Price Index (YoY) (OCT) Low 2.1% 2.7%
00:30 Currency: aud AUD Home Loans (SEP) Medium 2.2% 1.5% 1.2%
00:30 Currency: aud AUD Investment Lending (SEP) Low 1.9% 1.8%
00:30 Currency: aud AUD Value of Loans (MoM) (SEP) Low 0.7% 0.6%
01:30 Currency: cny CNY Consumer Price Index (YoY) (OCT) High 5.5% 5.5% 6.1%
01:30 Currency: cny CNY Producer Price Index (YoY) (OCT) High 5.0% 5.8% 6.5%
04:30 Currency: jpy JPY Bankruptcies (YoY) (OCT) Medium -14.1% -9.2%
05:00 Currency: jpy JPY Eco Watchers Survey: Current (OCT) Medium 45.9 46.5 45.3
05:00 Currency: jpy JPY Eco Watchers Survey: Outlook (OCT) Medium 45.9 46.4
05:30 Currency: cny CNY Retail Sales YTD (YoY) (OCT) Medium 17.0% 17.0% 17.0%
05:30 Currency: cny CNY Retail Sales (YoY) (OCT) Medium 17.2% 17.6% 17.7%
05:38 Currency: cny CNY Fixed Assets Inv Excl. Rural YTD (YoY) (OCT) Medium 24.9% 24.8% 24.9%
05:55 Currency: cny CNY Industrial Production YTD (YoY) (OCT) Medium 14.1% 14.0% 14.2%
05:55 Currency: cny CNY Industrial Production (YoY) (OCT) Medium 13.2% 13.4% 13.8%
07:30 Currency: eur EUR Bank of France Business Sentiment (OCT) Low 96 96 97
07:45 Currency: eur EUR French Central Government Balance (euros) (SEP) Low -92.7B -101.0B -102.8B
07:45 Currency: eur EUR French Survey of Industrial Investments (Table) Low
09:30 Currency: gbp GBP Visible Trade Balance (Pounds) (SEP) Medium -£9814 -£8000 -£8617
09:30 Currency: gbp GBP Total Trade Balance (Pounds) (SEP) Low -£2150 -£1877
09:30 Currency: gbp GBP Trade Balance Non EU (Pounds) (SEP) Low -£4975 -£4867
12:00 Currency: usd USD MBA Mortgage Applications (NOV 4) Low 10.3% 0.2%
13:30 Currency: cad CAD New Housing Price Index (YoY) (SEP) Medium 2.3% 2.3%
13:30 Currency: cad CAD New Housing Price Index (MoM) (SEP) Low 0.2% 0.1%
14:30 Currency: usd USD Bernanke Speaks at Fed Conference on Small Business Medium
15:00 Currency: usd USD Wholesale Inventories (SEP) Low 0.6% 0.4%
15:30 Currency: usd USD DOE Cushing OK Crude Inventory (NOV 4) Low 560K
15:30 Currency: usd USD DOE U.S. Crude Oil Inventories (NOV 4) Low 1826K
15:30 Currency: usd USD DOE U.S. Distillate Inventory (NOV 4) Low -3575K
15:30 Currency: usd USD DOE U.S. Gasoline Inventories (NOV 4) Low 1356K
21:30 Currency: nzd NZD Business NZ Performance of Manufacturing Index (OCT) Medium 50.8
23:50 Currency: jpy JPY Machine Orders (MoM) (SEP) Medium -7.1% 11.0%
23:50 Currency: jpy JPY Machine Orders (YoY) (SEP) Medium 10.6% 2.1%
23:50 Currency: jpy JPY Japan Money Stock M2+CD (YoY) (OCT) Low 2.7% 2.7%
23:50 Currency: jpy JPY Japan Money Stock M3 (YoY) (OCT) Low 2.3% 2.3%

Thu Nov 10
Currency: cny CNY Trade Balance (USD) (OCT) Medium $26.05B $14.51B
00:00 Currency: aud AUD Consumer Inflation Expectation (NOV) Low 3.1%
Currency: cny CNY Exports (YoY) (OCT) Low 16.2% 17.1%
Currency: cny CNY Imports (YoY) (OCT) Low 23.0% 20.9%
00:00 Currency: nzd NZD ANZ Consumer Confidence Index (NOV) Low 112.2
00:00 Currency: nzd NZD ANZ Consumer Confidence MoM (NOV) Low -0.4%
00:30 Currency: aud AUD Employment Change (OCT) High 10.0K 20.4K
00:30 Currency: aud AUD Unemployment Rate (OCT) High 5.3% 5.2%
00:30 Currency: aud AUD Full Time Employment Change (OCT) Medium 10.8K
00:30 Currency: aud AUD Part Time Employment Change (OCT) Medium 9.6K
00:30 Currency: aud AUD Participation Rate (OCT) Low 65.6% 65.6%
05:00 Currency: jpy JPY Consumer Confidence (OCT) Medium 39 38.6
06:00 Currency: jpy JPY Machine Tool Orders (YoY) (OCT P) (OCT P) Medium 20.1%
06:30 Currency: eur EUR French Consumer Price Index - EU Harmonised (MoM) (OCT) Low 0.1% 0.0%
06:30 Currency: eur EUR French Consumer Price Index - EU Harmonised (YoY) (OCT) Low 2.5% 2.4%
06:30 Currency: eur EUR French Consumer Price Index Ex Tobacco Index (OCT) Low 122.65 122.49
06:30 Currency: eur EUR French Consumer Price Index (MoM) (OCT) Low 0.2% -0.1%
06:30 Currency: eur EUR French Consumer Price Index (YoY) (OCT) Low 2.3% 2.2%
07:00 Currency: eur EUR German Consumer Price Index - EU Harmonised (YoY) (OCT F) High 2.8% 2.8%
07:00 Currency: eur EUR German Consumer Price Index (YoY) (OCT F) High 2.5% 2.5%
07:00 Currency: eur EUR German Consumer Price Index - EU Harmonised (MoM) (OCT F) Medium 0.0% 0.0%
07:00 Currency: eur EUR German Consumer Price Index (MoM) (OCT F) Medium 0.0% 0.0%
07:00 Currency: eur EUR German Wholesale Price Index (MoM) (OCT) Low 0.3%
07:00 Currency: eur EUR German Wholesale Price Index (YoY) (OCT) Low 5.7%
07:45 Currency: eur EUR French Industrial Production (MoM) (SEP) Low -0.7% 0.5%
07:45 Currency: eur EUR French Industrial Production (YoY) (SEP) Low 3.9% 4.4%
07:45 Currency: eur EUR French Manufacturing Production (MoM) (SEP) Low -0.6% 0.7%
07:45 Currency: eur EUR French Manufacturing Production (YoY) (SEP) Low 5.0% 5.1%
09:00 Currency: eur EUR ECB Publishes Nov. Monthly Report High
09:00 Currency: eur EUR Italian Industrial Production n.s.a. (YoY) (SEP) Low -1.1% 4.6%
09:00 Currency: eur EUR Italian Industrial Production s.a. (MoM) (SEP) Low -2.0% 4.3%
09:00 Currency: eur EUR Italian Industrial Production w.d.a. (YoY) (SEP) Low -1.1% 4.7%
10:00 Currency: eur EUR European Commission Releases Economic Growth Forecasts High
12:00 Currency: gbp GBP BOE Asset Purchase Target (NOV) High 275B 275B
12:00 Currency: gbp GBP Bank of England Rate Decision (NOV 10) High 0.50% 0.50%
13:30 Currency: usd USD Trade Balance (SEP) Medium -$46.2B -$45.6B
13:30 Currency: cad CAD International Merchandise Trade (Canadian dollar) (SEP) Low -0.57B -0.62B
13:30 Currency: usd USD Continuing Claims (OCT 28) Low 3680K 3683K
13:30 Currency: usd USD Import Price Index (MoM) (OCT) Low 0.1% 0.3%
13:30 Currency: usd USD Import Price Index (YoY) (OCT) Low 12.3% 13.4%
13:30 Currency: usd USD Initial Jobless Claims (NOV 4) Low 400K 397K
14:45 Currency: usd USD Bloomberg Consumer Comfort (NOV 6) Low -53.2
19:00 Currency: usd USD Monthly Budget Statement (OCT) Medium -$105.0B -$140.4B
21:45 Currency: nzd NZD Food Prices (MoM) (OCT) Low -1.0%
23:50 Currency: jpy JPY Tertiary Industry Index (MoM) (SEP) Medium -0.5% -0.2%
23:50 Currency: jpy JPY Domestic Corporate Goods Price Index (MoM) (OCT) Low -0.2% -0.1%
23:50 Currency: jpy JPY Domestic Corporate Goods Price Index (YoY) (OCT) Low 2.2% 2.5%
23:50 Currency: jpy JPY Loans & Discounts Corp (YoY) (SEP) Low -1.6%

Fri Nov 11
Currency: cny CNY New Yuan Loans (OCT) High 500.0B 470.0B
Currency: cny CNY Money Supply - M0 (YoY) (OCT) Low 12.7%
Currency: cny CNY Money Supply - M1 (YoY) (OCT) Low 9.3% 8.9%
Currency: cny CNY Money Supply - M2 (YoY) (OCT) Low 13.0% 13.0%
09:30 Currency: gbp GBP Producer Price Index Input n.s.a. (YoY) (OCT) Medium 14.6% 17.5%
09:30 Currency: gbp GBP Producer Price Index Output Core n.s.a. (YoY) (OCT) Medium 3.6% 3.8%
09:30 Currency: gbp GBP Producer Price Index Output n.s.a. (YoY) (OCT) Medium 5.9% 6.3%
09:30 Currency: gbp GBP Producer Price Index Input n.s.a. (MoM) (OCT) Low -0.3% 1.7%
09:30 Currency: gbp GBP Producer Price Index Output Core n.s.a. (MoM) (OCT) Low 0.1% 0.3%
09:30 Currency: gbp GBP Producer Price Index Output n.s.a. (MoM) (OCT) Low 0.2% 0.3%
14:55 Currency: usd USD U. of Michigan Confidence (NOV P) High 61.5 60.9
19:45 Currency: usd USD Fed's Williams Speaks on Panel at IMF Conference Low


Results of week of 30/10/2011 to 4/11/2011
30 October 2011 to 4 November 2011


Date Time Currency Event Importance Actual Forecast Previous Notes
Sun Oct 30
21:45 Currency: nzd NZD Building Permits (MoM) (SEP) Low -17.1% 2.0% 16.6%
23:15 Currency: jpy JPY Nomura/JMMA Manufacturing Purchasing Manager Index (OCT) Medium 50.6 49.3
23:30 Currency: aud AUD RPData-Rismark House Px Raw (SEP) Low -0.2% -0.4%
23:30 Currency: aud AUD RPData-Rismark House Px s.a. (SEP) Low -0.2% -0.6%
23:30 Currency: aud AUD TD Securities Inflation (MoM) (OCT) Low 0.1% 0.1%
23:30 Currency: aud AUD TD Securities Inflation (YoY) (OCT) Low 2.6% 2.8%

Mon Oct 31
00:01 Currency: gbp GBP Hometrack Housing Survey (MoM) (OCT) Low -0.2% -0.1%
00:01 Currency: gbp GBP Hometrack Housing Survey (YoY) (OCT) Low -2.8% -3.5%
00:01 Currency: gbp GBP Lloyds Business Barometer (OCT) Low -15 7
00:30 Currency: aud AUD Private Sector Credit (MoM) (SEP) Medium 0.5% 0.3% 0.2%
00:30 Currency: aud AUD Private Sector Credit (YoY) (SEP) Medium 3.4% 3.1% 3.0%
02:00 Currency: nzd NZD Money Supply M3 (YoY) (SEP) Low 5.0% 5.5%
03:20 Currency: cny CNY Leading Index (SEP) Low 100.43 101.31
05:00 Currency: jpy JPY Annualized Housing Starts (SEP) Medium 0.745M 0.906M 0.934M
05:00 Currency: jpy JPY Housing Starts (YoY) (SEP) Medium -10.8% 8.6% 14.0%
05:00 Currency: jpy JPY Construction Orders (YoY) (SEP) Low -9.3% 9.3%
07:00 Currency: eur EUR German Retail Sales (YoY) (SEP) Medium 0.3% 1.6% 2.5%
07:00 Currency: eur EUR German Retail Sales (MoM) (SEP) Low 0.4% 1.0% -2.7%
07:45 Currency: eur EUR French Producer Prices (MoM) (SEP) Low 0.2% 0.1% 0.0%
07:45 Currency: eur EUR French Producer Prices (YoY) (SEP) Low 6.1% 6.1% 6.2%
09:00 Currency: eur EUR Italian Unemployment Rate s.a. (SEP P) Low 8.3% 7.9% 8.0%
09:15 Currency: chf CHF Retail Sales (Real) (YoY) (SEP) Medium -0.9% -0.8%
09:30 Currency: gbp GBP Mortgage Approvals (SEP) Medium 51.0K 50.6K 52.3K
09:30 Currency: gbp GBP Net Consumer Credit (SEP) Medium 0.6B 0.4B 0.5B
09:30 Currency: gbp GBP Net Lending Sec. on Dwellings (SEP) Medium 0.3B 0.6B 0.5B
09:30 Currency: gbp GBP M4 Ex OFCs 3M Annualised (SEP) Low 4.9% 3.8%
09:30 Currency: gbp GBP M4 Money Supply (MoM) (SEP) Low -0.4% -0.4%
09:30 Currency: gbp GBP M4 Money Supply (YoY) (SEP) Low -1.7% -0.8%
10:00 Currency: eur EUR Euro-Zone Consumer Price Index Estimate (YoY) (OCT) Medium 3.0% 2.9% 3.0%
10:00 Currency: eur EUR Euro-Zone Unemployment Rate (SEP) Medium 10.2% 10.0% 10.1%
10:00 Currency: eur EUR Italian Consumer Price Index - EU Harmonized (MoM) (OCT P) Low 0.9% 0.6% 2.0%
10:00 Currency: eur EUR Italian Consumer Price Index - EU Harmonized (YoY) (OCT P) Low 3.8% 3.5% 3.6%
10:00 Currency: eur EUR Italian Consumer Price Index (NIC incl. tobacco) (MoM) (OCT P) Low 0.6% 0.1% 0.0%
10:00 Currency: eur EUR Italian Consumer Price Index (NIC incl. tobacco) (YoY) (OCT P) Low 3.4% 2.9% 3.0%
11:00 Currency: eur EUR Italian Producer Price Index (MoM) (SEP) Low 0.2% 0.4% 0.1%
11:00 Currency: eur EUR Italian Producer Price Index (YoY) (SEP) Low 4.7% 4.7% 4.8%
12:30 Currency: cad CAD Gross Domestic Product (MoM) (AUG) High 0.3% 0.2% 0.4%
12:30 Currency: cad CAD Gross Domestic Product (YoY) (AUG) High 2.4% 2.2% 2.4%
12:30 Currency: cad CAD Industrial Product Price (MoM) (SEP) Low 0.4% 0.2% 0.4%
12:30 Currency: cad CAD Raw Materials Price Index (MoM) (SEP) Low 1.4% -1.9% -3.2%
13:45 Currency: usd USD Chicago Purchasing Manager (OCT) Low 58.4 59 60.4
14:30 Currency: usd USD Dallas Fed Manufacturing Activity (OCT) Low 2.3 -5 -14.4
21:45 Currency: nzd NZD Average Hourly Earnings (QoQ) (3Q) Medium 1.3% 0.7% 1.2%
21:45 Currency: nzd NZD Labor Cost Private Sector (QoQ) (3Q) Low 0.5% 0.5% 0.5%
21:45 Currency: nzd NZD Private Wages ex Overtime (QoQ) (3Q) Low 0.5% 0.5% 0.5%
22:30 Currency: aud AUD AiG Performance of Manufacturing Index (OCT) Medium 47.4 42.3

Tue Nov 1
00:00 Currency: aud AUD HIA New Home Sales (MoM) (SEP) Medium -3.5% 1.1%
00:00 Currency: nzd NZD ANZ Commodity Price (OCT) Low -3.5% -1.3%
00:30 Currency: aud AUD House Price Index (QoQ) (3Q) Medium -1.2% -1.5% -0.5%
00:30 Currency: aud AUD House Price Index (YoY) (3Q) Medium -2.2% -1.8% -2.2%
01:00 Currency: cny CNY PMI Manufacturing (OCT) High 50.4 51.8 51.2
01:30 Currency: jpy JPY Labor Cash Earnings (YoY) (SEP) Medium 0.0% -0.4% -0.4%
02:30 Currency: cny CNY HSBC Manufacturing PMI (OCT) Low 51.0 49.9
03:30 Currency: aud AUD Reserve Bank of Australia Rate Decision (NOV 1) High 4.50% 4.50% 4.75%
05:00 Currency: jpy JPY Vehicle Sales (YoY) (OCT) Low 28.3% 1.7%
05:30 Currency: aud AUD RBA Commodity Index SDR (YoY) (OCT) Low 19.4% 21.9%
05:30 Currency: aud AUD RBA Commodity Price Index (OCT) Low 107.5 111.1
07:00 Currency: gbp GBP Nationwide House Prices n.s.a. (YoY) (OCT) Medium 0.8% 0.5% -0.3%
07:00 Currency: gbp GBP Nationwide House Prices s.a. (MoM) (OCT) Low 0.4% 0.0% 0.1%
08:30 Currency: chf CHF SVME-Purchasing Managers Index (OCT) Medium 46.9 47.7 48.2
09:30 Currency: gbp GBP Gross Domestic Product (QoQ) (3Q A) High 0.5% 0.3% 0.1%
09:30 Currency: gbp GBP Gross Domestic Product (YoY) (3Q A) High 0.5% 0.4% 0.6%
09:30 Currency: gbp GBP Purchasing Manager Index Manufacturing (OCT) Medium 47.4 50.0 51.1
09:30 Currency: gbp GBP Index of Services (3Mo3M) (AUG) Low 0.4% 0.5% 0.8%
09:30 Currency: gbp GBP Index of Services (MoM) (AUG) Low 0.3% 0.0% -0.2%
14:00 Currency: usd USD Construction Spending (MoM) (SEP) Medium 0.2% 0.3% 1.6%
14:00 Currency: usd USD ISM Manufacturing (OCT) Medium 50.8 52.0 51.6
14:00 Currency: usd USD ISM Prices Paid (OCT) Medium 41 55 56
21:00 Currency: usd USD Domestic Vehicle Sales (OCT) Low 10.29M 10.30M 10.17M
21:00 Currency: usd USD Total Vehicle Sales (OCT) Low 13.20M 13.20M 13.04M
23:50 Currency: jpy JPY Monetary Base (YoY) (OCT) Low 17.0% 16.7%

Wed Nov 2
00:30 Currency: aud AUD Building Approvals (MoM) (SEP) Low -13.6% -4.9% 10.7%
00:30 Currency: aud AUD Building Approvals (YoY) (SEP) Low -12.0% 0.1% -5.3%
08:45 Currency: eur EUR Italian PMI Manufacturing (OCT) Low 43.3 47.2 48.3
08:50 Currency: eur EUR French Purchasing Manager Index Manufacturing (OCT F) Low 48.5 49 49
08:55 Currency: eur EUR German Unemployment Change (OCT) High 10K -10K -22K
08:55 Currency: eur EUR German PMI Manufacturing (OCT) Medium 49.1 48.9 48.9
08:55 Currency: eur EUR German Unemployment Rate s.a. (OCT) Medium 7.0% 6.9% 6.9%
09:00 Currency: eur EUR Eurozone PMI Manufacturing (OCT F) Medium 47.1 47.3 47.3
09:30 Currency: gbp GBP Purchasing Manager Index Construction (OCT) Medium 53.9 49.8 50.1
11:00 Currency: usd USD MBA Mortgage Applications (OCT 28) Low 0.2% 4.9%
11:30 Currency: usd USD Challenger Job Cuts (YoY) (OCT) Low 12.6% 211.5%
12:15 Currency: usd USD ADP Employment Change (OCT) Medium 110K 100K 116K
14:30 Currency: usd USD DOE Cushing OK Crude Inventory (OCT 28) Low 560K 419K
14:30 Currency: usd USD DOE U.S. Crude Oil Inventories (OCT 28) Low 1826K 1000K 4735K
14:30 Currency: usd USD DOE U.S. Distillate Inventory (OCT 28) Low -1750K -3575K -4275K
14:30 Currency: usd USD DOE U.S. Gasoline Inventories (OCT 28) Low 1356K -800K -1353K
16:30 Currency: usd USD Federal Open Market Committee Rate Decision (NOV 2) High 0.25% 0.25% 0.25%
17:00 Currency: eur EUR Italian New Car Registrations (YoY) (OCT) Low -5.5% -5.7%
18:00 Currency: eur EUR Italian Budget Balance (euros) (OCT) Low -1.9B -11.8B
18:00 Currency: eur EUR Italian Budget Balance (euros) (YTD) (OCT) Low -60.8B -58.8B
18:15 Currency: usd USD Bernanke Speaks at Fed Press Conference High
21:45 Currency: nzd NZD Employment Change (QoQ) (3Q) Medium 0.2% 0.6% 0.1%
21:45 Currency: nzd NZD Employment Change (YoY) (3Q) Medium 1.1% 1.6% 2.0%
21:45 Currency: nzd NZD Unemployment Rate (3Q) Medium 6.6% 6.4% 6.5%
21:45 Currency: nzd NZD Participation Rate (QoQ) (3Q) Low 68.4% 68.5% 68.3%
22:30 Currency: aud AUD AiG Performance of Service Index (OCT) Medium 48.8 50.3

Thu Nov 3
00:30 Currency: aud AUD Retail Sales Ex Inflation(QoQ) (3Q) Medium 0.6% 0.6% 0.2%
00:30 Currency: aud AUD Retail Sales s.a. (MoM) (SEP) Medium 0.4% 0.4% 0.6%
01:00 Currency: cny CNY China Non-manufacturing PMI (OCT) Medium 57.7 59.3
02:30 Currency: cny CNY China HSBC Services PMI (OCT) Low 54.1 53.0
07:00 Currency: chf CHF UBS Real Estate Bubble Index (3Q) Low 0.58 0.45
09:30 Currency: gbp GBP Purchasing Manager Index Services (OCT) Medium 51.3 52.0 52.9
09:30 Currency: gbp GBP Official Reserves (Changes) (OCT) Low $1387M -$2444M
12:00 Currency: usd USD RBC Consumer Outlook Index (NOV) Low 39.6 39.2
12:30 Currency: usd USD Continuing Claims (OCT 22) Low 3683K 3693K 3698K
12:30 Currency: usd USD Initial Jobless Claims (OCT 29) Low 397K 400K 406K
12:30 Currency: usd USD Non-Farm Productivity (3Q P) Low 3.1% 3.0% -0.1%
12:30 Currency: usd USD Unit Labor Costs (3Q P) Low -2.4% -1.0% 2.8%
12:45 Currency: eur EUR European Central Bank Rate Decision (NOV 3) High 1.25% 1.50% 1.50%
13:45 Currency: usd USD Bloomberg Consumer Comfort (OCT 30) Low -53.2 -50.0 -51.1
14:00 Currency: usd USD Factory Orders (SEP) Medium 0.3% -0.2% 0.1%
14:00 Currency: usd USD ISM Non-Manufacutring Composite (OCT) Medium 52.9 53.5 53.0
14:30 Currency: usd USD EIA Natural Gas Storage Change (OCT 28) Low 78 72 92
16:13 Currency: usd USD ICSC Chain Store Sales (YoY) (OCT) Medium 3.7% 5.3% 5.5%

Fri Nov 4
00:30 Currency: aud AUD Monetary Policy Qtrly Statement Medium
07:55 Currency: eur EUR German Purchasing Manager Index Services (OCT F) Medium 50.5 52.1 52.1
08:00 Currency: chf CHF Foreign Currency Reserves (OCT) Low 242.7B 282.4B
08:45 Currency: eur EUR Italian Purchasing Manager Index Services (OCT) Low 43.9 45.5 45.8
08:50 Currency: eur EUR French Purchasing Manager Index Services (OCT F) Low 44.6 46.0 46.0
09:00 Currency: eur EUR Euro-Zone Purchasing Manager Index Composite (OCT F) Medium 46.5 47.2 47.2
09:00 Currency: eur EUR Euro-Zone Purchasing Manager Index Services (OCT F) Medium 46.4 47.2 47.2
09:00 Currency: gbp GBP New Car Registrations (YoY) (OCT) Low 2.6% -0.8%
10:00 Currency: eur EUR Euro-Zone Producer Price Index (YoY) (SEP) Medium 5.8% 5.8% 5.8%
10:00 Currency: eur EUR Euro-Zone Producer Price Index (MoM) (SEP) Low 0.3% 0.2% -0.2%
11:00 Currency: cad CAD Net Change in Employment (OCT) High -54.0K 15.0K 60.9K
11:00 Currency: cad CAD Unemployment Rate (OCT) High 7.3% 7.1% 7.1%
11:00 Currency: eur EUR German Factory Orders n.s.a. (YoY) (SEP) Medium 2.4% 7.5% 4.0%
11:00 Currency: eur EUR German Factory Orders s.a. (MoM) (SEP) Medium -4.3% 0.1% -1.4%
11:00 Currency: cad CAD Full Time Employment Change (OCT) Medium -71.7 63.8
11:00 Currency: cad CAD Part Time Employment Change (OCT) Medium 17.7 -2.9
11:00 Currency: cad CAD Participation Rate (OCT) Medium 66.7 66.8 66.8
12:30 Currency: usd USD Change in Non-farm Payrolls (OCT) High 80K 95K 158K
12:30 Currency: usd USD Underemployment Rate (U6) (OCT) High 16.2% 16.5%
12:30 Currency: usd USD Unemployment Rate (OCT) High 9.0% 9.1% 9.1%
12:30 Currency: usd USD Average Hourly Earnings (MoM) (OCT) Medium 0.2% 0.2% 0.3%
12:30 Currency: usd USD Average Hourly Earnings (YoY) (OCT) Medium 1.8% 1.8% 1.9%
12:30 Currency: usd USD Average Weekly Hours All Employees (OCT) Medium 34.3 34.3 34.3
12:30 Currency: usd USD Change in Manufacturing Payrolls (OCT) Medium 5K 2K -3K
12:30 Currency: usd USD Change in Private Payrolls (OCT) Medium 104K 125K 191K
12:30 Currency: cad CAD Building Permits (MoM) (SEP) Low 2.6% -4.9% -10.1%
12:30 Currency: usd USD Change in Household Survey Employment (OCT) Low 277 398
14:00 Currency: cad CAD Ivey Purchasing Managers Index s.a. (OCT) Medium 54.4 55.4 55.7
Results of week of 23/10/2011 to 28/10/2011
23 October 2011 to 28 October 2011


Sun, Oct 23, 2011
GMT Ccy Events Consensus Previous

All Day EUR EU Economic Summit
All Day NZD Bank Holiday
7:50pm JPY Trade Balance -0.02T -0.11T -0.27T
8:30pm AUD PPI q/q 0.6% 0.8% 0.8%

Monday, Oct 24, 2011
GMT Ccy Events Consensus Previous
23:50 JPY Trade Balance (JPY) Sep -0.11T -0.29T
00:30 AUD PPI Q/Q Q3 0.80% 0.80%
00:30 AUD PPI Y/Y Q3 2.90% 3.40%
04:00 CNY HSBC Flash China Manufacturing PMI Oct 49.90
07:30 EUR German PMI Manufacturing Oct A 50.00 50.30
07:30 EUR German PMI Services Oct A 49.80 49.70
08:00 EUR Eurozone PMI Manufacturing Oct A 48.10 48.50
08:00 EUR Eurozone PMI Services Oct A 48.50 48.80
09:00 EUR Eurozone Industrial New Orders M/M Aug 0.10% -2.10%
21:45 NZD CPI Q/Q Q3 0.70% 1.00%
21:45 NZD CPI Y/Y Q3 4.90% 5.30%
23:00 AUD Conference Board Leading Index Aug -0.10%

Tuesday, Oct 25, 2011
GMT Ccy Events Consensus Previous
06:00 EUR German GfK Consumer Sentiment Nov 5.10 5.20
06:00 CHF UBS Consumption Indicator Sep 0.79
08:30 GBP BBA Loans for House Purchase Sep 36.3K 35.2K
08:30 GBP Current Account (GBP) Q2 -9.2B -9.4B
12:30 CAD Retail Sales M/M Aug 0.20% -0.60%
12:30 CAD Retail Sales Less Autos M/M Aug 0.40% 0.00%
13:00 CAD BoC Rate Decision 1.00% 1.00%
13:00 USD S&P/Case-Shiller Composite-20 Y/Y Aug -3.60% -4.10%
14:00 USD Consumer Confidence Oct 46.00 45.40
14:00 USD House Price Index M/M Aug 0.20% 0.80%
23:50 JPY Corporate Service Price Y/Y Sep -0.40% -0.40%

Wednesday, Oct 26, 2011
GMT Ccy Events Consensus Previous
00:00 NZD NBNZ Business Confidence Oct 30.30
00:30 AUD CPI Q/Q Q3 0.60% 0.90%
00:30 AUD CPI Y/Y Q3 3.50% 3.60%
00:30 AUD CPI RBA Trimmed Mean Q/Q Q3 0.60% 0.70%
00:30 AUD CPI RBA Trimmed Mean Y/Y Q3 2.70% 2.70%
00:30 AUD CPI RBA Weighted Median Q/Q Q3 0.60% 0.90%
00:30 AUD CPI RBA Weighted Median Y/Y Q3 2.70% 2.70%
10:00 GBP CBI Trends Total Orders Oct -7.00 -9.00
12:30 USD Durable Goods Orders Sep -0.70% -0.10%
12:30 USD Durables Ex Transportation Sep 0.50% -0.10%
14:00 USD New Home Sales Sep 300K 295K
14:30 CAD BoC Monetary Policy Report
14:30 USD Crude Oil Inventories -4.7M
20:00 NZD RBNZ Rate Decision 2.50% 2.50%
21:45 NZD Trade Balance (NZD) Sep -440M -641M
23:50 JPY Retail Trade Y/Y Sep -0.10% -2.60%

Thursday, Oct 27, 2011
GMT Ccy Events Consensus Previous
EUR German CPI M/M Oct P 0.10% 0.10%
EUR German CPI Y/Y Oct P 2.50% 2.60%
JPY BoJ Rate Decision 0.10%
08:00 EUR Eurozone M3 Y/Y Sep 2.80% 2.80%
09:00 EUR Eurozone Consumer Confidence Oct F -19.90 -19.90
09:00 EUR Eurozone Economic Confidence Oct 93.80 95.00
09:00 EUR Eurozone Industrial Confidence Oct -7.00 -5.90
09:00 EUR Eurozone Services Confidence Oct -1.00 0.00
10:00 GBP CBI Reported Sales Oct -15.00 -15.00
12:30 USD GDP (Annualized) Q3 A 2.50% 1.30%
12:30 USD GDP Price Index Q3 A 2.30% 2.50%
12:30 USD Initial Jobless Claims 400K 403K
14:00 USD Pending Home Sales M/M Sep 0.10% -1.20%
14:30 USD Natural Gas Storage 103B
23:01 GBP GfK Consumer Sentiment Oct -30.00 -30.00
23:30 JPY Household Spending Y/Y Sep -3.50% -4.10%
23:30 JPY Unemployment Rate Sep 4.50% 4.30%
23:30 JPY Tokyo CPI Core Y/Y Oct -0.40% -0.10%
23:30 JPY National CPI Core Y/Y Sep 0.20% 0.20%
23:50 JPY Industrial Production M/M Oct -2.10% 0.80%

Friday, Oct 28, 2011
GMT Ccy Events Consensus Previous
09:30 CHF KOF Swiss Leading Indicator Oct 1.04 1.21
12:30 USD Personal Income Sep 0.30% -0.10%
12:30 USD Personal Spending Sep 0.60% 0.20%
12:30 USD PCE Deflator Y/Y Sep 3.00% 2.90%
12:30 USD PCE Core M/M Sep 0.20% 0.10%
12:30 USD PCE Core Y/Y Sep 1.70% 1.60%
12:30 USD Employment Cost Index Q3 0.60% 0.70%
13:55 USD U. of Michigan Sentiment Oct F 58.00 57.50

Results of week of 16/10/2011 to 21/10/2011
16 October 2011 to 21 October 2011

Sunday, October 16, 2011
Time Event Period Consensus Prior
12:30 AM Australia Reserve Bank's Board October Minutes
9:30 PM New Zealand Business NZ Publishes Performance of Services Index
9:30 PM New Zealand Performance Services Index SEP - - 53,9
11:01 PM United Kingdom Rightmove House Prices (MoM) OCT - - 0,70%
11:01 PM United Kingdom Rightmove House Prices (YoY) OCT - - 1,50%


Monday, October 17, 2011
12:30 AM Australia New Motor Vehicle Sales MoM SEP - - 3,30%
12:30 AM Australia New Motor Vehicle Sales YoY SEP - - 4,40%
4:30 AM Japan Industrial Production (MoM) AUG F - - 0,80%
4:30 AM Japan Industrial Production YOY% AUG F - - 0,60%
4:30 AM Japan Capacity Utilization (MoM) AUG F - - 0,60%
7:30 AM Sweden Average House Prices (SEK) SEP - - 2.106M
8:00 AM Norway Trade Balance (Krone) SEP - - 32.0B
12:30 PM Canada Int'l Securities Transactions AUG - - 11.78B
12:30 PM United States of America Empire Manufacturing OCT -4 -8,82
1:15 PM United States of America Industrial Production SEP 0,20% 0,20%
1:15 PM United States of America Capacity Utilization SEP 77,50% 77,40%
1:30 PM European Union ECB Calls for Bids in 7-Day Main Refinancing Tender
2:30 PM Canada Business Outlook Future Sales 3Q - - 20
2:30 PM Canada BoC Senior Loan Officer Survey 3Q - - -49,6
2:35 PM European Union ECB's Stark Speaks at EU Parliament Committee in Brussels
10:00 PM Italy Bank of Italy Draghi Speaks at Conference on Women and Economy
11:00 PM United States of America Fed's Evans Speaks in Detroit
11:30 PM United States of America Fed's Lacker Speaks on Economy in Maryland

Tuesday, October 18, 2011
12:30 AM Australia Reserve Bank's Board October Minutes
5:30 AM Japan Nationwide Dept. Sales (YoY) SEP - - -1,70%
5:30 AM Japan Tokyo Dept. Store Sales (YoY) SEP - - -2,90%
6:00 AM Japan Machine Tool Orders (YoY) SEP F - - 20,30%
6:00 AM European Union EU 25 New Car Registrations SEP - - 7,70%
8:00 AM Portugal Bank of Portugal Governor Costa Speaks at Conference
8:30 AM United Kingdom CPI (MoM) SEP 0,40% 0,60%
8:30 AM United Kingdom CPI (YoY) SEP 4,90% 4,50%
8:30 AM United Kingdom Core CPI YOY SEP 3,20% 3,10%
8:30 AM United Kingdom Retail Price Index SEP - - 236,1
8:30 AM United Kingdom RPI (MoM) SEP 0,40% 0,60%
8:30 AM United Kingdom RPI (YoY) SEP 5,40% 5,20%
8:30 AM United Kingdom RPI Ex Mort Int.Payments (YoY) SEP 5,50% 5,30%
9:00 AM Germany Zew Survey (Current Situation) OCT 40 43,6
9:00 AM European Union ZEW Survey (Econ. Sentiment) OCT -44,5 -43,3
9:00 AM Italy Current Account (mlns euro) AUG - - 1663M
9:15 AM European Union ECB Announces Allotment in 7-Day Main Refinancing Tender
12:15 PM United States of America Fed's Rosengren Gives Welcome Remarks at Boston Fed Conference
12:30 PM United States of America Producer Price Index (MoM) SEP 0,20% 0,00%
12:30 PM United States of America PPI Ex Food & Energy (MoM) SEP 0,10% 0,10%
12:30 PM United States of America Producer Price Index (YoY) SEP 6,40% 6,50%
12:30 PM United States of America PPI Ex Food & Energy (YoY) SEP 2,40% 2,50%
1:00 PM United States of America Net Long-term TIC Flows AUG - - $9.5B
1:00 PM United States of America Total Net TIC Flows AUG - - -$51.8B
2:00 PM New Zealand Fonterra Milk Powder Auction Results Due
2:00 PM United States of America NAHB Housing Market Index OCT 15 14
4:00 PM European Union ECB's Coene Speaks at Belgian Central Bank Conference in Mons
4:30 PM United States of America Fed's Bernanke Speaks in Boston
5:15 PM United States of America Fed's Bernanke Speaks in Boston
9:45 PM Australia RBA's Debelle Delivers Speech to Finance Conference in Sydney
10:30 PM United States of America Fed's Lockhart Speaks on economy in Chattanooga, Tennessee
11:30 PM Australia Westpac Leading Index (MoM) AUG - - 0,50%

Wednesday, October 19, 2011

4:30 AM Japan All Industry Activity Index (MoM) AUG -0,40% 0,40%
8:00 AM European Union Euro-Zone Current Account nsa AUG - - -3.2B
8:00 AM European Union ECB Euro-Zone Current Account SA AUG - - -12.9B
8:00 AM Italy Industrial Orders s.a. (MoM) AUG - - 1,80%
8:00 AM Italy Industrial Orders n.s.a. (YoY) AUG - - 6,50%
8:00 AM Italy Industrial Sales s.a. (MoM) AUG - - 1,60%
8:00 AM Italy Industrial Sales n.s.a. (YoY) AUG - - 7,70%
8:30 AM United Kingdom Bank of England Minutes
8:30 AM United Kingdom Bank of England Releases Monetary Policy Committee Minutes
9:00 AM European Union Construction Output SA MoM AUG - - 1,40%
9:00 AM European Union Construction Output WDA YoY AUG - - 1,20%
11:00 AM United States of America MBA Mortgage Applications 14-okt - - 1,30%
12:00 PM Norway Norwegian Deposit Rates 19-okt 2,25% 2,25%
12:30 PM United States of America Fed's Rosengren Speaks at Boston Fed Conference
12:30 PM Canada Leading Indicators MoM SEP - - 0,00%
12:30 PM United States of America Consumer Price Index (MoM) SEP 0,30% 0,40%
12:30 PM United States of America CPI Ex Food & Energy (MoM) SEP 0,20% 0,20%
12:30 PM United States of America Consumer Price Index (YoY) SEP 3,80% 3,80%
12:30 PM United States of America CPI Ex Food & Energy (YoY) SEP 2,10% 2,00%
12:30 PM United States of America Housing Starts SEP 594K 571K
12:30 PM United States of America CPI Core Index SA SEP - - 226,014
12:30 PM United States of America Consumer Price Index NSA SEP - - 226,545
12:30 PM United States of America Housing Starts MOM% SEP 3,90% - -
12:30 PM United States of America Building Permits SEP 610K 620K
12:30 PM United States of America Building Permits MOM% SEP -2,40% 3,20%
1:00 PM United States of America Fed's Lockhart Speaks on Latin America in Atlanta
6:00 PM United States of America Fed's Beige Book
6:00 PM United States of America Fed Releases Beige Book Economic Survey
8:30 PM United States of America Fed's Lockhart Speaks on Leadership in Atlanta
10:30 PM Australia RBA's Edey Speaks at ISDA Conference in Sydney
11:50 PM Japan Japan Buying Foreign Bonds 14-okt - - -?2221.5B
11:50 PM Japan Japan Buying Foreign Stocks 14-okt - - ?85.6B
11:50 PM Japan Foreign Buying Japan Bonds 14-okt - - ?231.3B
11:50 PM Japan Foreign Buying Japan Stocks 14-okt - - -?59.0B

Thursday, October 20, 2011

12:30 AM Australia NAB Business Confidence 3Q - - 6
12:30 AM Australia RBA Foreign Exchange Transactn SEP - - 367M
5:00 AM Japan Coincident Index CI AUG F - - 107,4
5:00 AM Japan Leading Index CI AUG F - - 103,8
6:00 AM Germany Producer Prices (MoM) SEP 0,30% -0,30%
6:00 AM Germany Producer Prices (YoY) SEP 5,50% 5,50%
6:00 AM Switzerland Trade Balance SEP - - 0.81B
6:00 AM Switzerland Exports real SA (MoM) SEP - - -7,00%
6:00 AM Switzerland Imports real SA (MoM) SEP - - 0,90%
7:00 AM Japan Convenience Store Sales YoY SEP - - 7,90%
7:30 AM Sweden Unemployment Rate SEP 7,00% 6,60%
8:30 AM United Kingdom Retail Sales Ex Auto Fuel(MoM) SEP 0,20% -0,10%
8:30 AM United Kingdom Retail Sales Ex Auto Fuel(YoY) SEP 0,60% -0,10%
8:30 AM United Kingdom Retail Sales w/Auto Fuel (MoM) SEP -0,10% -0,20%
8:30 AM United Kingdom Retail Sales w/Auto Fuel (YoY) SEP 0,60% 0,00%
9:00 AM Switzerland Credit Suisse ZEW Survey (Expectations) OCT - - -75,7
10:00 AM Germany German Economy Ministry Presents New GDP Forecasts: Berlin
12:00 PM Portugal Bank of Portugal Releases Monthly Statistical Report
12:30 PM Canada Wholesale Sales MoM AUG 0,40% 0,80%
12:30 PM United States of America Initial Jobless Claims 14-okt - - - -
12:30 PM United States of America Continuing Claims 08-okt - - - -
1:45 PM United States of America Bloomberg Economic Expectations OCT - - -34
1:45 PM United States of America Bloomberg Consumer Comfort 16-okt - - -50,8
2:00 PM European Union Euro-Zone Consumer Confidence OCT A -20 -19,1
2:00 PM United States of America Leading Indicators SEP 0,20% 0,30%
2:00 PM United States of America Philadelphia Fed. OCT -9 -17,5
2:00 PM United States of America Existing Home Sales SEP 4.91M 5.03M
2:00 PM United States of America Existing Home Sales MoM SEP -2,50% 7,70%
2:15 PM United States of America Fed's Bullard to Speak at St. Louis Economic Policy Conference
4:00 PM United States of America Fed's Lockhart Moderates Panel on Economy in Atlanta
4:50 PM United States of America Fed's Pianalto Speaks in Toledo, Ohio
9:45 PM New Zealand Statistics New Zealand on Immigration
9:45 PM New Zealand Net Migration SA SEP - - 200

Friday, October 21, 2011

12:30 AM Australia Import price index (QoQ) 3Q 0.5% 0.8%
12:30 AM Australia Export price index (QoQ) 3Q 3.6% 6.0%
2:00 AM New Zealand Credit Card Spending
2:00 AM New Zealand Credit Card Spending SA (MoM) SEP - - -1.0%
2:00 AM New Zealand Credit Card Spending (YoY) SEP - - 4.7%
6:45 AM France Own-Company Production Outlook OCT - - 4
6:45 AM France Production Outlook Indicator OCT - - -29
6:45 AM France Business Confidence Indicator OCT 98 99
7:00 AM Switzerland SNB Publishes Monthly Statistical Bulletin
7:00 AM Switzerland Money Supply M3 YoY SEP - - 7.6%
7:00 AM Switzerland Real Estate Index Family Homes 3Q - - 396.3
7:40 AM European Union ECB's Trichet Speaks in Warsaw
7:50 AM European Union EU's Rehn Speaks at Central-Bank Conference in Warsaw
8:00 AM European Union ECB's Stark Speaks in Warsaw
8:00 AM Germany IFO - Business Climate OCT 106.2 107.5
8:00 AM Germany IFO - Current Assessment OCT 116.5 117.9
8:00 AM Germany IFO - Expectations OCT 97.0 98.0
8:30 AM United Kingdom Public Finances (PSNCR) SEP 18.0B 11.8B
8:30 AM United Kingdom PSNB ex Interventions SEP 15.0B 15.9B
8:30 AM United Kingdom Public Sector Net Borrowing SEP 11.8B 13.2B
9:00 AM European Union Euro-Zone Govt Debt/GDP Ratio 2010 - - 85.1%
10:00 AM Austria ECB's Nowotny Speaks at Gewinn Trade Fair in Vienna
10:30 AM Portugal Prime Minister, BoP's Carlos Costa Speak at Conference
10:30 AM Portugal ECB's Carlos Costa Speaks at Conference in Lisbon
11:00 AM Canada Consumer Price Index MoM SEP 0.2% 0.3%
11:00 AM Canada Consumer Price Index YoY SEP 3.1% 3.1%
11:00 AM Canada Bank Canada CPI Core MoM SEP 0.2% 0.4%
11:00 AM Canada Bank Canada CPI Core YoY SEP 2.0% 1.9%
11:00 AM Canada Consumer Price Index SEP - - 120.3
12:00 PM Portugal Bank of Portugal Releases Monthly Economic Indicators Report
1:45 PM Poland ECB's Praet Speaks in Warsaw
3:00 PM Austria ECB's Nowotny Speaks at Gewinn Trade Fair in Vienna
4:00 PM United States of America Former Fed's Hoenig to Speak in New York
5:00 PM United States of America Fed's Kocherlakota Speaks in Minneapolis
5:20 PM United States of America Fed's Fisher Gives Economic Update in Dallas, Texas
7:00 PM United States of America Fed's Yellen Speaks in Denver

Results for week of 09/10/11 - 09/14/11
09 October 2011 - 14 October 2011


Sunday, October 09, 2011

9:45 PM New Zealand Statistics NZ Reports on CPI Review
11:01 PM United Kingdom Lloyds Employment Confidence SEP - - -66,00
12:30 AM Australia ANZ Job Advertisements (MoM) SEP - - -0.6%
5:30 AM Australia Foreign Reserves SEP - - A$43.8B
6:00 AM Germany Exports SA (MoM) AUG 1.3% -1.8%
6:00 AM Germany Imports SA (MoM) AUG 0.6% -0.3%
6:00 AM Germany Current Account (EURO) AUG 5.1B 7.5B
6:00 AM Germany Trade Balance AUG 8.2B 10.4B
6:30 AM France Bank of France Bus. Sentiment SEP - - 98,00
6:45 AM France Industrial Production (MoM) AUG - - 1.5%
6:45 AM France Industrial Production (YoY) AUG - - 3.7%
6:45 AM France Manufacturing Production (MoM) AUG - - 1.4%
6:45 AM France Manufacturing Production (YoY) AUG - - 4.2%
7:30 AM Sweden Industrial Prod. s.a. (MoM) AUG - - 2.8%
7:30 AM Sweden Industrial Prod. n.s.a. (YoY) AUG - - 8.2%
7:30 AM Sweden Industrial Orders s.a. (MoM) AUG - - 0.6%
7:30 AM Sweden Industrial Orders n.s.a. (YoY) AUG - - 0.4%
8:00 AM Norway CPI (MoM) SEP - - -0.6%
8:00 AM Norway CPI (YoY) SEP - - 1.3%
8:00 AM Norway CPI Underlying (MoM) SEP - - -0.6%
8:00 AM Norway CPI Underlying (YoY) SEP - - 0.8%
8:00 AM Norway Producer Prices incl.Oil (MoM) SEP - - -2.5%
8:00 AM Norway Producer Prices incl.Oil (YoY) SEP - - 12.8%
8:00 AM Italy Industrial Production sa (MoM) AUG 0.1% -0.7%
8:00 AM Italy Industrial Production wda(YoY) AUG -2.7% -1.6%
8:00 AM Italy Industrial Production nsa(YoY) AUG - - -4.6%
8:00 AM European Union ECB's Constancio Speaks in Milan
8:30 AM European Union Sentix Investor Confidence OCT - - -15.4


Monday, October 10, 2011

9:45 PM New Zealand Statistics NZ on Electronic Card Transations
9:45 PM New Zealand NZ Card Spending - Retail MoM SEP 1.1% -0.7%
9:45 PM New Zealand NZ Card Spending - Total MoM SEP - - -0.5%
10:30 PM New Zealand Government Full-Year Financial Statements
11:01 PM United Kingdom BRC Sales Like-For-Like YoY SEP - - -0.6%
11:01 PM United Kingdom RICS House Price Balance SEP - - -0,23
11:50 PM Japan Current Account Total AUG ?453.6B ?990.2B
11:50 PM Japan Adjusted Current Account Total AUG ?509.9B ?752.5B
11:50 PM Japan Current Account Balance YOY% AUG -63.6% -42.4%
11:50 PM Japan Trade Balance - BOP Basis AUG -?692.3B ?123.3B
12:30 AM Australia NAB Business Confidence SEP - - -8,00
12:30 AM Australia NAB Business Conditions SEP - - -3,00
4:30 AM Japan Bankruptcies (YoY) SEP - - -3.6%
5:00 AM Japan Bank of Japan Monthly Economic Report
5:00 AM Japan Consumer Confidence SEP 37.2 37.0
6:00 AM Japan Eco Watchers Survey: Current SEP 46.5 47.3
6:00 AM Japan Eco Watchers Survey: Outlook SEP - - 47.1
7:30 AM Sweden CPI - Headline Rate (MoM) SEP - - 0.0%
7:30 AM Sweden CPI - Headline Rate (YoY) SEP - - 3.4%
7:30 AM Sweden SW CPI - CPIF (MoM) SEP - - 0.0%
7:30 AM Sweden SW CPI - CPIF (YoY) SEP - - 1.6%
7:30 AM Sweden CPI Level SEP - - 311.23
8:30 AM United Kingdom DCLG UK House Prices (YoY) AUG - - -1.5%
8:30 AM United Kingdom Industrial Production (MoM) AUG 0.1% -0.2%
8:30 AM United Kingdom Industrial Production (YoY) AUG -1.0% -0.7%
8:30 AM United Kingdom Manufacturing Production (MoM) AUG -0.1% 0.1%
8:30 AM United Kingdom Manufacturing Production (YoY) AUG 1.7% 1.9%
8:30 AM United Kingdom Visible Trade Balance GBP/Mn AUG - - -?8922
8:30 AM United Kingdom Trade Balance Non EU GBP/Mn AUG - - -?5505
8:30 AM United Kingdom Total Trade Balance (GBP/Mln) AUG - - -?4450
11:30 AM United States of America NFIB Small Business Optimism SEP - - 88.1
12:15 PM Canada Housing Starts SEP 186.1K 184.7K
2:00 PM United States of America IBD/TIPP Economic Optimism OCT - - 39.9
2:00 PM United Kingdom NIESR GDP Estimate SEP - - 0.2%
6:00 PM United States of America Minutes of FOMC Meeting
6:00 PM United States of America Fed Releases Minutes of Sep. 20 FOMC Meeting
6:00 PM United States of America Monthly Budget Statement SEP - - -$134.2B

Tuesday, October 11, 2011

11:00 PM New Zealand Quotable Value NZ House Price Inflation Report
11:00 PM New Zealand QV House Prices YoY% SEP - - 0.1%
11:30 PM Australia Westpac Consumer Confidence s.a. (MoM) OCT - - 8.1%
11:30 PM Australia Westpac Consumer Confidence Index OCT - - 96.9
11:50 PM Japan Machine Orders (MoM) AUG 3.9% -8.2%
11:50 PM Japan Machine Orders YOY% AUG -3.6% 4.0%
12:00 AM New Zealand ANZ Consumer Confidence MoM OCT - - -0.6%
12:30 AM Australia Home Loans MoM AUG 1.0% 1.0%
12:30 AM Australia Investment Lending AUG - - 1.9%
12:30 AM Australia Owner-Occupied Home Loan Value MoM AUG - - 1.4%
4:00 AM Australia RBA's Debelle Gives Speech to Forex Market Conference, Sydney
5:30 AM France CPI - EU Harmonised (MoM) SEP - - 0.6%
5:30 AM France CPI - EU Harmonised (YoY) SEP - - 2.4%
5:30 AM France Consumer Price Index (MoM) SEP - - 0.5%
5:30 AM France Consumer Price Index (YoY) SEP - - 2.2%
5:30 AM France CPI Ex Tobacco Index SEP - - 122.59
6:45 AM France Current Account (EURO) AUG - - -4.5B
8:30 AM United Kingdom Claimant Count Rate SEP 5.0% 4.9%
8:30 AM United Kingdom Jobless Claims Change SEP 19.0K 20.3K
8:30 AM United Kingdom Average Weekly Earnings 3M/YoY AUG 2.9% 2.8%
8:30 AM United Kingdom Weekly Earnings exBonus 3M/YoY AUG 2.0% 2.1%
8:30 AM United Kingdom ILO Unemployment Rate (3mths) AUG 8.0% 7.9%
8:30 AM European Union ECB's Stark Speaks in Riga
9:00 AM European Union Euro-Zone Ind. Prod. wda (YoY) AUG 2.2% 4.2%
9:00 AM European Union Euro-Zone Ind. Prod. sa (MoM) AUG -0.7% 1.0%
11:00 AM United States of America MBA Mortgage Applications OCT 7 - - -4.3%
12:30 PM Canada New Housing Price Index MoM AUG 0.1% 0.1%
12:30 PM Canada New Housing Price Index YoY AUG - - 2.3%
2:00 PM United States of America JOLTs Job Openings AUG - - 3228,00
5:15 PM United States of America Fed's Pianalto Speaks at University of Akron
5:30 PM United States of America Fed's Plosser Speaks on Economy in Philadelphia
6:30 PM European Union ECB's Trichet Speaks in London

Wednesday, October 12, 2011

9:30 PM New Zealand Business NZ Publishes Performance of Manufacturing Index
9:30 PM New Zealand Business NZ PMI SEP - - 52.9
9:45 PM New Zealand Statistics New Zealand on Food Prices
9:45 PM New Zealand Food Prices (MoM) SEP - - -1.3%
10:50 PM Australia RBA's Ellis Speaks at Capital Markets Conference in Sydney
11:50 PM Japan BOJ to Publish Minutes of Sept. 6-7 Board Meeting
11:50 PM Japan Bank Lending Ex-Trusts YoY SEP -0.5% -0.5%
11:50 PM Japan Bank Lending incl Trusts (YoY) SEP - - - -
11:50 PM Japan Tertiary Industry Index (MoM) AUG -0.3% -0.1%
12:00 AM New Zealand ANZ-Roy Morgan Consumer Confidence Survey
12:00 AM New Zealand ANZ Consumer Confidence Index OCT - - 112.6
12:00 AM New Zealand ANZ Consumer Confidence MoM OCT - - -0.6%
12:30 AM Australia Employment Change SEP 10.0K -9.7K
12:30 AM Australia Unemployment Rate SEP 5.3% 5.3%
12:30 AM Australia Full Time Employment Change SEP - - -12.6K
12:30 AM Australia Part Time Employment Change SEP - - 2.9K
12:30 AM Australia Participation Rate SEP 65.6% 65.6%
4:00 AM Japan Tokyo Condominium Sales (YoY) SEP - - 1.7%
6:00 AM Germany Consumer Price Index (MoM) SEP F 0.1% 0.1%
6:00 AM Germany Consumer Price Index (YoY) SEP F 2.6% 2.6%
6:00 AM Germany CPI - EU Harmonised (MoM) SEP F - - 0.1%
6:00 AM Germany CPI - EU Harmonised (YoY) SEP F 2.8% 2.8%
7:15 AM Switzerland Producer & Import Prices (MoM) SEP - - -1.2%
7:15 AM Switzerland Producer & Import Prices (YoY) SEP - - -1.9%
8:00 AM European Union ECB Publishes Oct. Monthly Report
8:00 AM Sweden PES Unemployment Rate SEP - - 4.3%
8:00 AM European Union ECB Publishes Monthly Bulletin
8:30 AM United Kingdom Visible Trade Balance GBP/Mn AUG -?8700 -?8922
8:30 AM United Kingdom Trade Balance Non EU GBP/Mn AUG - - -?5505
8:30 AM United Kingdom Total Trade Balance (GBP/Mln) AUG - - -?4450
12:30 PM Canada Int'l Merchandise Trade AUG -0.90B -0.75B
12:30 PM United States of America Trade Balance AUG -$46.0B -$44.8B
12:30 PM United States of America Initial Jobless Claims OCT 7 - - - -
12:30 PM United States of America Continuing Claims OCT 1 - - - -
1:45 PM United States of America Bloomberg Consumer Comfort OCT 9 - - -50.2
6:30 PM United States of America Fed's Kocherlakota Speaks in Sidney, Montana
6:30 PM European Union Bunde


Thursday, October 13, 2011

11:50 PM Japan Japan Money Stock M2 YoY SEP 2.7% 2.7%
11:50 PM Japan Japan Money Stock M3 YoY SEP 2.2% 2.2%
11:50 PM Japan Domestic CGPI (MoM) SEP -0.2% -0.2%
11:50 PM Japan Domestic CGPI (YoY) SEP 2.5% 2.6%
11:50 PM Japan Japan Buying Foreign Bonds OCT 7 - - ?972.8B
11:50 PM Japan Japan Buying Foreign Stocks OCT 7 - - ?132.9B
11:50 PM Japan Foreign Buying Japan Bonds OCT 7 - - ?258.8B
11:50 PM Japan Foreign Buying Japan Stocks OCT 7 - - -?169.3B
2:00 AM New Zealand Foreign Holdings of New Zealand Government Bonds
2:00 AM New Zealand Non Resident Bond Holdings SEP - - 62.5%
8:00 AM Italy Trade Balance (Total) (Euros) AUG - - 1438M
8:00 AM Italy Trade Balance Eu (Euros) AUG - - 1773M
8:00 AM Norway Existing Homes QoQ 3Q - - 2.8%
9:00 AM Italy Bank of Italy Releases August Public Finance Supplement
9:00 AM European Union Euro-Zone CPI - Core (YoY) SEP 1.5% 1.2%
9:00 AM European Union Euro-Zone CPI (MoM) SEP 0.8% 0.2%
9:00 AM European Union Euro-Zone CPI (YoY) SEP 3.0% - -
9:00 AM European Union Euro-Zone Trade Balance sa AUG - - -2.5B
9:00 AM European Union Euro-Zone Trade Balance AUG - - 4.3B
9:00 AM Italy CPI (NIC incl. tobacco) (MoM) SEP F 0.1% 0.1%
9:00 AM Italy CPI (NIC incl. tobacco) (YoY) SEP F 3.1% 3.1%
9:00 AM Italy CPI - EU Harmonized (MoM) SEP F 1.9% 1.9%
9:00 AM Italy CPI - EU Harmonized (YoY) SEP F 3.5% 3.5%
12:30 PM Canada Manufacturing Sales MoM AUG 0.5% 2.7%
12:30 PM United States of America Import Price Index (MoM) SEP -0.4% -0.4%
12:30 PM United States of America Import Price Index (YoY) SEP 12.5% 13.0%
12:30 PM United States of America Advance Retail Sales SEP 0.4% 0.0%
12:30 PM United States of America Retail Sales Less Autos SEP 0.2% 0.1%
12:30 PM United States of America Retail Sales Ex Auto & Gas SEP 0.2% 0.1%
1:00 PM Italy Bank of Italy Releases the Quarterly Economic Bulletin
1:55 PM United States of America U. of Michigan Confidence OCT P 60.0 59.4
2:00 PM United States of America Business Inventories AUG 0.4% 0.4%


Friday, October 14
01:00 SGD Singaporean Retail Sales (YoY) 12.0% 10.7%
04:00 EUR Italian Trade Balance 0.74B 1.44B
05:00 EUR Core CPI (YoY) 1.5% 1.2%
05:00 EUR Trade Balance -1.1B -2.5B
05:00 EUR CPI (YoY) 3.0% 3.0%
05:00 EUR Italian CPI (MoM) 0.1% 0.1%
08:30 USD Retail Sales (MoM) 0.5% 0.0%
08:30 CAD Manufacturing Sales (MoM) 0.50% 2.70%
08:30 USD Import Price Index (MoM) -0.4% -0.4%
08:30 USD Core Retail Sales (MoM) 0.2% 0.1%
09:55 USD Michigan Inflation Expectations 3.3%
09:55 USD Michigan Consumer Sentiment Index 60.0 59.4
10:00 USD Business Inventories (MoM) 0.4% 0.4%


Results for the week of: 02/10/2011 - 07/10/2011
2 Oct 2011 - 7 Oct 2011

Date Time Currency Event Importance Actual Forecast Previous Notes


Sun
Oct 2
22:30 Currency: aud AUD AiG Performance of Manufacturing Index (SEP) Medium 42.3 43.3
23:01 Currency: gbp GBP Hometrack Housing Survey (MoM) (SEP) Low -0.1% -0.1%
23:01 Currency: gbp GBP Hometrack Housing Survey (YoY) (SEP) Low -3.5% -3.7%
23:01 Currency: gbp GBP Lloyds Business Barometer (SEP) Low 7 -3
23:30 Currency: aud AUD TD Securities Inflation Expectation (MoM) (SEP) Low 0.1% -0.1%
23:30 Currency: aud AUD TD Securities Inflation Expectation (MoM) (SEP) Low 2.8% 2.9%
23:50 Currency: jpy JPY Tankan Large Manufacturers Outlook (3Q) High 4 3 2
23:50 Currency: jpy JPY Tankan Large All Industry Capex (3Q) Medium 3.0% 4.3% 4.2%
23:50 Currency: jpy JPY Tankan Large Manufacturers Index (3Q) Medium 2 2 -9
23:50 Currency: jpy JPY Tankan Non-Manufacturing Index (3Q) Medium 1 2 -5
23:50 Currency: jpy JPY Tankan Non-Manufacturing Outlook (3Q) Medium 1 2 -2
23:50 Currency: jpy JPY Loans & Discounts Corp (YoY) (AUG) Low -1.6% -1.6%

Mon Oct 3
00:00 Currency: nzd NZD ANZ Commodity Price (SEP) Low -1.3% -1.4%
01:00 Currency: cny CNY China Non-manufacturing PMI (SEP) Medium 59.3 57.6
05:00 Currency: jpy JPY Vehicle Sales (YoY) (SEP) Low 1.7% -25.5%
07:15 Currency: chf CHF Retail Sales (Real) (YoY) (AUG) Medium -1.9% 2.9%
07:30 Currency: chf CHF SVME-Purchasing Managers Index (SEP) Medium 48.2 50.5 51.7
07:45 Currency: eur EUR Italian Purchasing Manager Index Manufacturing (SEP) Low 48.3 46.5 47
07:50 Currency: eur EUR French Purchasing Manager Index Manufacturing (SEP F) Low 48.2 47.3 47.3
07:55 Currency: eur EUR German Purchasing Manager Index Manufacturing (SEP F) Medium 50.3 50 50
08:00 Currency: eur EUR Euro-Zone Purchasing Manager Index Manufacturing (SEP F) Medium 48.5 48.4 48.4
08:30 Currency: gbp GBP Purchasing Manager Index Manufacturing (SEP) Medium 51.1 48.5 49.4
14:00 Currency: usd USD ISM Manufacturing (SEP) High 51.6 50.5 50.6
14:00 Currency: usd USD Construction Spending (MoM) (AUG) Medium 1.4% -0.2% -1.4%
14:00 Currency: usd USD ISM Prices Paid (SEP) Medium 56.0 54.0 55.5
16:00 Currency: eur EUR Italian New Car Registrations (YoY) (SEP) Low -5.7% 1.5%
17:00 Currency: eur EUR Italian Budget Balance (euros) (SEP) Low -11.8B -6.9B
17:00 Currency: eur EUR Italian Budget Balance (euros) (YTD) (SEP) Low -58.8B -46.8B
21:00 Currency: usd USD Domestic Vehicle Sales (SEP) Low 10.17M 9.60M 9.52M
21:00 Currency: usd USD Total Vehicle Sales (SEP) Low 13.04M 12.55M 12.10M
21:00 Currency: nzd NZD NZIER Business Opinion Survey (3Q) Low 25 27
22:00 Currency: usd USD Fed's Lacker Speaks in Madison, Wisconsin Low
23:50 Currency: jpy JPY Monetary Base (YoY) (SEP) Low 16.7% 15.9%

Tue Oct 4
00:30 Currency: aud AUD Trade Balance (Australian dollar) (AUG) Medium 3100M 2000M 1817M
00:30 Currency: aud AUD Building Approvals (MoM) (AUG) Low 11.4% 1.0% 1.8%
00:30 Currency: aud AUD Building Approvals (YoY) (AUG) Low -5.5% -15.1% -14.3%
01:30 Currency: jpy JPY Labor Cash Earnings (YoY) (AUG) Medium -0.6% -0.2%
03:30 Currency: aud AUD Reserve Bank of Australia Rate Decision (OCT 4) High 4.75% 4.75% 4.75%
05:30 Currency: aud AUD RBA Commodity Index SDR (YoY) (SEP) Low 26.6% 25.1%
05:30 Currency: aud AUD RBA Commodity Price Index (SEP) Low 115.4 113.3
08:30 Currency: gbp GBP Purchasing Manager Index Construction (SEP) Medium 50.1 51.6 52.6
09:00 Currency: eur EUR Euro-Zone Producer Price Index (YoY) (AUG) High 5.9% 5.8% 6.1%
09:00 Currency: eur EUR Euro-Zone Producer Price Index (MoM) (AUG) Medium -0.1 -0.2% 0.5%
14:00 Currency: usd USD Fed Chairman Bernanke to Testify Before JEC High
14:00 Currency: usd USD Factory Orders (AUG) Medium -0.2% 0.0% 2.1%
22:30 Currency: aud AUD AiG Performance of Service Index (SEP) Medium 52.1
23:01 Currency: gbp GBP BRC Shop Price Index (YoY) (SEP) Low 2.7%

Wed Oct 5
Currency: gbp GBP Halifax House Price (3MoY) (SEP) Low 0.2% -2.6%
Currency: gbp GBP Halifax Plc House Prices s.a. (MoM) (SEP) Low -2.1% -1.2%
00:30 Currency: aud AUD Retail Sales s.a. (MoM) (AUG) Medium 0.2% 0.5%
07:45 Currency: eur EUR Italian Purchasing Manager Index Services (SEP) Low 48.4
07:50 Currency: eur EUR French Purchasing Manager Index Services (SEP F) Low 52.5 52.5
07:55 Currency: eur EUR German Purchasing Manager Index Services (SEP F) Medium 50.3 50.3
08:00 Currency: eur EUR Euro-Zone Purchasing Manager Index Composite (SEP F) Medium 49.2 49.2
08:00 Currency: eur EUR Euro-Zone Purchasing Manager Index Services (SEP F) Medium 49.1 49.1
08:30 Currency: gbp GBP Gross Domestic Product (QoQ) (2Q F) High 0.2% 0.2%
08:30 Currency: gbp GBP Gross Domestic Product (YoY) (2Q F) High 0.7% 0.7%
08:30 Currency: gbp GBP Current Account (Pounds) (2Q) Medium -11.0B -9.4B
08:30 Currency: gbp GBP Purchasing Manager Index Services (SEP) Medium 50.5 51.1
08:30 Currency: gbp GBP Total Business Investment (YoY) (2Q) Medium 2.7%
08:30 Currency: gbp GBP Exports (2Q P) Low -0.1% 2.4%
08:30 Currency: gbp GBP Government Spending (2Q P) Low -0.1% 0.5%
08:30 Currency: gbp GBP Gross Fixed Capital Formation (2Q P) Low 0.7% -2.0%
08:30 Currency: gbp GBP Imports (2Q P) Low -1.0% -2.4%
08:30 Currency: gbp GBP Official Reserves (Changes) (SEP) Low $2237M
08:30 Currency: gbp GBP Private Consumption (2Q P) Low -0.3% -0.6%
08:30 Currency: gbp GBP Total Business Investment (QoQ) (2Q) Low -3.2%
09:00 Currency: eur EUR Euro-Zone Retail Sales (YoY) (AUG) High -0.7% -0.3%
09:00 Currency: eur EUR Euro-Zone Retail Sales (MoM) (AUG) Medium -0.3% 0.2%
11:00 Currency: usd USD MBA Mortgage Applications (SEP 30) Low 9.3%
11:30 Currency: usd USD Challenger Job Cuts (YoY) (SEP) Low 47.0%
12:15 Currency: usd USD ADP Employment Change (SEP) Medium 70K 91K
14:00 Currency: usd USD ISM Non-Manufacturing Composite (SEP) Medium 52.8 53.3
14:30 Currency: usd USD DOE Cushing OK Crude Inventory (SEP 30) Low -1078K
14:30 Currency: usd USD DOE U.S. Crude Oil Inventories (SEP 30) Low 1915K
14:30 Currency: usd USD DOE U.S. Distillate Inventory (SEP 30) Low 72K
14:30 Currency: usd USD DOE U.S. Gasoline Inventories (SEP 30) Low 791K

Thu Oct 6
07:00 Currency: chf CHF Foreign Currency Reserves (SEP) Low 253.4B
07:15 Currency: chf CHF CPI - EU Harmonised (MoM) (SEP) Medium -0.6%
07:15 Currency: chf CHF CPI - EU Harmonised (YoY) (SEP) Medium -0.3%
07:15 Currency: chf CHF Consumer Price Index (MoM) (SEP) Medium 0.1% -0.3%
07:15 Currency: chf CHF Consumer Price Index (YoY) (SEP) Medium 0.3% 0.2%
08:30 Currency: gbp GBP Bank of England Housing Equity Withdrawal (Pounds) (2Q) Low -£6.0B -£5.8B
08:30 Currency: gbp GBP Index of Services (3Mo3M) (JUL) (JUL) Low 0.9% 0.5%
08:30 Currency: gbp GBP Index of Services (MoM) (JUL) Low -0.1% -0.1%
10:00 Currency: eur EUR German Factory Orders n.s.a. (YoY) (AUG) Medium 4.7% 8.7%
10:00 Currency: eur EUR German Factory Orders s.a. (MoM) (AUG) Medium 0.0% -2.8%
11:00 Currency: gbp GBP BOE Asset Purchase Target (OCT) High 200B 200B
11:00 Currency: gbp GBP Bank of England Rate Decision (OCT 6) High 0.50% 0.50%
11:45 Currency: eur EUR European Central Bank Rate Decision (OCT 6) High 1.50% 1.50%
12:30 Currency: cad CAD Building Permits (MoM) (AUG) Low -0.3% -0.6%
12:30 Currency: usd USD Continuing Claims (SEP 24) (SEP 24) Low 3725K 3729K
12:30 Currency: usd USD Initial Jobless Claims (SEP 30) (SEP 30) Low 410K 391K
13:45 Currency: usd USD Bloomberg Consumer Comfort (OCT 2) Low -53
14:00 Currency: cad CAD Ivey Purchasing Managers Index s.a. (SEP) Medium 55.0 56.4
14:30 Currency: usd USD EIA Natural Gas Storage Change (SEP 30) Low 111
22:30 Currency: aud AUD AiG Performance of Construction Index (SEP) Medium 32.1

Fri Oct 7
Currency: jpy JPY Bank of Japan Rate Decision (OCT 7) High 0.10%
Currency: usd USD ICSC Chain Store Sales (YoY) (SEP) Medium 4.6%
Currency: gbp GBP New Car Registrations (YoY) (SEP) Low 7.3%
05:00 Currency: jpy JPY Leading Index (AUG P) Medium 103.5 104.6
05:00 Currency: jpy JPY Coincident Index (AUG P) Low 107.4 107.1
05:30 Currency: aud AUD Foreign Reserves (Australian dollar) (SEP) Low A$43.8B
05:45 Currency: chf CHF Unemployment Rate (SEP) Medium 2.8% 2.8%
05:45 Currency: chf CHF Unemployment Rate s.a. (SEP) Medium 3.0% 3.0%
06:45 Currency: eur EUR French Central Government Balance (euros) (AUG) Low -105.0B -86.6B
06:45 Currency: eur EUR French Trade Balance (euros) (AUG) Low -5950M -6460M
08:30 Currency: gbp GBP Producer Price Index Output Core n.s.a. (YoY) (SEP) Medium 3.7% 3.6%
08:30 Currency: gbp GBP Producer Price Index Output n.s.a. (YoY) (SEP) Medium 6.2% 6.1%
08:30 Currency: gbp GBP Producer Price Index Input n.s.a. (MoM) (SEP) Low 1.2% -1.9%
08:30 Currency: gbp GBP Producer Price Index Input n.s.a. (YoY) (SEP) Low 17.1% 16.2%
08:30 Currency: gbp GBP Producer Price Index Output Core n.s.a. (MoM) (SEP) Low 0.1% 0.2%
08:30 Currency: gbp GBP Producer Price Index Output n.s.a. (MoM) (SEP) Low 0.2% 0.1%
10:00 Currency: eur EUR German Industrial Production n.s.a. and w.d.a. (YoY) (AUG) Medium 6.4% 10.1%
10:00 Currency: eur EUR German Industrial Production s.a. (MoM) (AUG) Medium -2.0% 4.0%
11:00 Currency: cad CAD Net Change in Employment (SEP) High 15.0K -5.5K
11:00 Currency: cad CAD Unemployment Rate (SEP) High 7.3% 7.3%
11:00 Currency: cad CAD Full Time Employment Change (SEP) Medium 25.7K
11:00 Currency: cad CAD Part Time Employment Change (SEP) Medium -31.2K
11:00 Currency: cad CAD Participation Rate (SEP) Medium 66.7
12:30 Currency: usd USD Change in Non-farm Payrolls (SEP) High 50K 0K
12:30 Currency: usd USD Unemployment Rate (SEP) High 9.1% 9.1%
12:30 Currency: usd Average Hourly Earning (MoM) (SEP) Medium 0.2% -0.1%
12:30 Currency: usd Average Hourly Earning (YoY) (SEP) Medium 1.9% 1.9%
12:30 Currency: usd USD Change in Manufacturing Payrolls (SEP) Medium -3K -3K
12:30 Currency: usd USD Change in Private Payrolls (SEP) Medium 90K 17K
12:30 Currency: usd Avg Weekly Hours All Employees (SEP) Low 34.2 34.2
12:30 Currency: usd USD Change in Household Employment Survey (SEP) Low 331
14:00 Currency: usd USD Wholesale Inventories (AUG) Low 0.6% 0.8%
14:45 Currency: usd USD Fed's Lockhart Speaks on Economy in Atlanta Low
19:00 Currency: usd USD Consumer Credit (AUG) Medium $7.500B $11.965B

Sat Oct 8
02:30 Currency: cny CNY China HSBC Services PMI (SEP) Low 50.6


Results for the week of: 25/09/2011 - 01/10/2011
25 Sept 2011 - 1 Oct 2011

Sun Sep 25
8:30am CAD BOC Gov Carney Speaks
5:45pm NZD Trade Balance -641M -315M 111M

Mon Sep 26
4:00am EUR German Ifo Business Climate 107.5 107.0 108.7
4:30am GBP MPC Member Broadbent Speaks
9:15am USD FOMC Member Raskin Speaks
10:00am USD New Home Sales 295K 296K 302K
7:50pm JPY CSPI y/y -0.4% -0.4% -0.3%

Tue Sep 27
2:00am CHF UBS Consumption Indicator 0.79 1.28
2:00am EUR GfK German Consumer Climate 5.2 5.1 5.2
3:30am GBP MPC Member Posen Speaks
4:00am EUR M3 Money Supply y/y 2.8% 2.0% 2.1%
4:00am EUR Private Loans y/y 2.6% 2.5% 2.4%
6:00am GBP CBI Realized Sales -15 -14 -14
9:00am USD S&P/CS Composite-20 HPI y/y -4.1% -4.4% -4.4%
9:59am USD Richmond Manufacturing Index -6 -8 -10
10:00am USD CB Consumer Confidence 45.4 46.2 45.2
1:20pm USD FOMC Member Fisher Speaks
4:10pm CAD Gov Council Member Macklem Speaks
8:53pm AUD HIA New Home Sales m/m 1.1% -8.0%

Wed Sep 28
2:00am EUR German Import Prices m/m -0.7% -0.3% 0.8%
All Day EUR German Prelim CPI m/m 0.1% -0.1% 0.0%
4:30am GBP BOE Credit Conditions Survey
8:30am USD Core Durable Goods Orders m/m -0.1% 0.1% 0.7%
8:30am USD Durable Goods Orders m/m -0.1% -0.2% 4.1%
10:30am USD Crude Oil Inventories 1.9M 1.1M -7.3M
12:15pm CHF Gov Board Member Jordan Speaks
5:00pm USD Fed Chairman Bernanke Speaks
7:50pm JPY Retail Sales y/y -2.6% -0.6% 0.6%

Thu Sep 29
2:00am GBP Nationwide HPI m/m 0.1% 0.1% -0.6%
2:15am JPY BOJ Gov Shirakawa Speaks
3:00am GBP MPC Member Miles Speaks
3:55am EUR German Unemployment Change -26K -9K -9K
4:30am GBP Net Lending to Individuals m/m 1.0B 0.8B 1.0B
4:30am GBP M4 Money Supply m/m -0.2% 0.3% 0.0%
4:30am GBP Mortgage Approvals 52K 50K 50K
8:30am CAD RMPI m/m -3.2% -1.9% -1.1%
8:30am CAD IPPI m/m 0.5% -0.4% -0.4%
8:30am USD Unemployment Claims 391K 420K 428K
8:30am USD Final GDP q/q 1.3% 1.2% 1.0%
8:30am USD Final GDP Price Index q/q 2.5% 2.4% 2.4%
10:00am USD Pending Home Sales m/m -1.2% -1.7% -1.3%
10:30am USD Natural Gas Storage 111B 97B 89B
5:45pm NZD Building Consents m/m 12.5% 14.3%
7:01pm GBP GfK Consumer Confidence -30 -33 -31
7:15pm JPY Manufacturing PMI 49.3 51.9
7:30pm JPY Household Spending y/y -4.1% -2.7% -2.1%
7:30pm JPY Tokyo Core CPI y/y -0.1% -0.1% -0.2%
7:30pm JPY National Core CPI y/y 0.2% 0.1% 0.1%
7:30pm JPY Unemployment Rate 4.3% 4.7% 4.7%
7:50pm JPY Prelim Industrial Production m/m 0.8% 1.5% 0.4%
8:00pm NZD NBNZ Business Confidence 30.3 34.4
9:30pm AUD Private Sector Credit m/m 0.2% 0.2% 0.3%
10:30pm CNY HSBC Final Manufacturing PMI 49.9 49.4

Fri Sep 30
1:00am JPY Housing Starts y/y 14.0% 4.6% 21.2%
2:00am EUR German Retail Sales m/m -2.9% -0.4% 0.3%
2:45am EUR French Consumer Spending m/m 0.2% 0.4% -0.2%
2:45am EUR French Consumer Spending m/m -0.2% 0.2% 0.9%
4:00am EUR Italian Monthly Unemployment Rate 7.9% 8.0% 8.0%
4:00am EUR Italian Quarterly Unemployment Rate 8.0% 8.0% 8.1%
5:00am EUR CPI Flash Estimate y/y 3.0% 2.5% 2.5%
5:00am EUR Unemployment Rate 10.0% 10.0% 10.0%
5:00am EUR Italian Prelim CPI m/m 0.1% -0.1% 0.3%
5:30am CHF KOF Economic Barometer 1.21 1.41 1.61
8:30am CAD GDP m/m 0.3% 0.3% 0.2%
8:30am USD Core PCE Price Index m/m 0.1% 0.2% 0.2%
8:30am USD Personal Spending m/m 0.2% 0.2% 0.7%
8:30am USD Personal Income m/m -0.1% 0.1% 0.1%
9:45am USD Chicago PMI 60.4 55.8 56.5
9:55am USD Revised UoM Consumer Sentiment 59.4 57.9 57.8
9:55am USD Revised UoM Inflation Expectations 3.3% 3.7%
9:00pm CNY Manufacturing PMI 51.2 51.2 50.9

Sat Oct 1

12:00pm AUD Daylight Saving Time Shift


Results for the week of: 18/09/2011 - 23/09/2011

18 Sept 2011 - 23 Sept 2011


GMT Country/Event Actual Cons. Previous Vol.


Sep 18

United Kingdom
Rightmove House Price Index (YoY) (Sep) 1.5% -0.3% 2
23:01

United Kingdom
Rightmove House Price Index (MoM) (Sep) 0.7% -2.1%Revised from -2.2% 1
Sep 19
00:00

Japan
Respect-for-the-Aged Day Bank Holiday 0
09:00

European Monetary Union
Construction Output w.d.a (YoY) (Jul) 1.2% -11.5%Revised from -11.3% 1
09:00

European Monetary Union
Construction Output s.a (MoM) (Jul) 1.4% -1.3%Revised from -1.8% 1
14:00

United States
NAHB Housing Market Index (Sep) 14 15 15 1
14:30

United States Press Conference
Sep 20
01:30

Australia
RBA Meeting's Minutes 3
05:00

Japan
Coincident Index (Jul) 107.1 107.4Revised from 109.3 1
05:00

Japan
Leading Economic Index (Jul) 104.6 102.6Revised from 103.3 2
05:45

Switzerland
SECO Economic Forecasts 1
06:00

Switzerland
Trade Balance (Aug) 808.00M 1.97B 2808.00MRevised from 2825.00M 2
06:00

Germany
Producer Price Index (MoM) (Aug) -0.3% 0.2% 0.7% 3
06:00

Germany
Producer Price Index (YoY) (Aug) 5.5% 5.8% 5.8% 3
09:00

Germany
ZEW Survey - Current Situation (Sep) 43.6 40.0 53.5 2
09:00

Germany
ZEW Survey - Economic Sentiment (Sep) -43.3 -43.9 -37.6 3
09:00

European Monetary Union
ZEW Survey - Economic Sentiment (Sep) -44.6 -42.3 -40.0 2
12:30

Canada
Leading Indicators (MoM) (Aug) 0.0% 0.2% 0.1%Revised from 0.2% 2
12:30

Canada
Wholesale Sales (MoM) (Jul) 0.8% 0.6% 0.0%Revised from 0.0% 1
12:30

United States
Building Permits (MoM) (Aug) 0.620M 0.600M 0.597M 2
12:30

United States
Housing Starts (MoM) (Aug) 0.571M 0.590M 0.601MRevised from 0.604M 2
22:45

New Zealand
Visitor Arrivals (YoY) (Aug) 4.7% -3.7% 1
22:45

New Zealand
Current Account (Q2) -0.92B -0.69B -0.09BRevised from -0.10B 2
23:06

United Kingdom
Nationwide Consumer Confidence (Aug) 48 47 49 2
23:50

Japan
Adjusted Merchandise Trade Balance (Aug) ¥-294.378 ¥-22.100B ¥-160.200BRevised from ¥-130.500B 1
23:50

Japan
Merchandise Trade Balance Total (Aug) ¥775.3B ¥-300.0B ¥70.0BRevised from ¥72.5B 2
Sep 21
00:30

Australia
Westpac Leading Index (MoM) (Jul) 0.5% 0.1% 1
03:00

New Zealand
Credit Card Spending s.a. (YoY) (Aug) 4.7% 7.2%Revised from 7.3% 2
04:30

Japan
All Industry Activity Index (MoM) (Jul) 0.4% 0.9% 2.3% 2
08:30

United Kingdom
Public Sector Net Borrowing (Aug) £13.161B £11.300B £-1.961B 2
08:30

United Kingdom
Bank of England Minutes 3
11:00

Canada
Consumer Price Index (YoY) (Aug) 3.1% 2.9% 2.7% 3
11:00

United States
MBA Mortgage Applications (Sep 16) 0.6% 6.3% 1
11:00

Canada
Consumer Price Index (MoM) (Aug) 0.3% 0.1% 0.2% 2
11:00

Canada
Bank of Canada Consumer Price Index Core (MoM) (Aug) 0.4% 0.2% 0.2% 1
11:00

Canada
Bank of Canada Consumer Price Index Core (YoY) (Aug) 1.9% 1.6% 1.6% 2
14:00

United States
Existing Home Sales (MoM) (Aug) 7.7% 1.4% -3.5% 1
14:00

United States
Existing Home Sales Change (Aug) 5.03M 4.76M 4.67M 2
14:30

United States
EIA Crude Oil Stocks change (Sep 16) -7.3M -6.7M 1
18:15

United States
Fed Interest Rate Decision (Sep 21) 0.25% 0.25% 3
22:45

New Zealand
Gross Domestic Product (YoY) (Q2) 1.7% 1.5% 2
22:45

New Zealand
Gross Domestic Product (QoQ) (Q2) 0.5% 0.8% 2
Sep 22
02:30

China
HSBC Manufacturing PMI (Sep) Preliminar 49.8 1
07:30

Germany
Purchasing Manager Index Manufacturing (Sep) Preliminar 50.2 50.9 2
07:30

Germany
Purchasing Manager Index Services (Sep) Preliminar 50.6 51.1 2
08:00

European Monetary Union
Purchasing Manager Index Services (Sep) Preliminar 51.1 51.5 2
08:00

European Monetary Union
Purchasing Manager Index Manufacturing (Sep) Preliminar 48.6 49.0 2
09:00

Switzerland
ZEW Survey - Expectations (Sep) -71.4 2
09:00

European Monetary Union
Industrial New Orders s.a. (MoM) (Jul) -1.1% -0.7% 1
09:00

European Monetary Union
Industrial New Orders (YoY) (Jul) 10.5% 11.1% 2
10:00

United Kingdom
CBI Industrial Trends Survey - Orders (MoM) (Sep) -5% 1% 1
12:30

Canada
Retail Sales (MoM) (Jul) -0.3% 0.7% 2
12:30

Canada
Retail Sales ex Autos (MoM) (Jul) 0.2% -0.1% 1
12:30

United States
Initial Jobless Claims (Sep 16) 418K 428K 1
12:30

United States
Continuing Jobless Claims (Sep 10) 3.726M 1
14:00

United States
Leading Indicators (MoM) (Aug) 0.2% 0.5% 2
14:00

United States
Housing Price Index (MoM) (Jul) 0.0% 0.9% 2
14:00

European Monetary Union
Consumer Confidence (Sep) Preliminar -18.0 -16.5 2
Sep 23
00:00

Australia
Conference Board Australia Leading Index (Jul) -0.8% 2
00:00

Japan
Autumnal Equinox Day 0
08:30

United Kingdom
BBA Mortgage Approvals (Aug) 33.4K 2
20:25

European Monetary Union
ECB Trichet's Speech

Results for the week of: 11/09/2011 - 11/16/2011
11 Sep 2011 - 16 Sep 2011
Time Cur. Imp. Event Actual Forecast Previous

Sunday, September 11
18:00 EUR ECB President Trichet Speaks
19:50 JPY Monetary Policy Meeting Minutes
19:50 JPY Tertiary Industry Activity Index (MoM) -0.1% 0.3% 1.9%
19:50 JPY CGPI (YoY) 2.6% 2.7% 2.9%
19:50 JPY BSI Large Manufacturing Conditions 10.3 -23.3
21:30 AUD Trade Balance 1.83B 1.90B 2.05B

Monday, September 12
01:30 INR Indian Industrial Production (YoY) 6.5% 8.7%
04:00 EUR Italian Industrial Production (MoM) 0.1% -0.6%
05:00 EUR German House Price Index (MoM) 1.0% 1.6%
16:00 USD FOMC Member Fisher Speaks
18:45 NZD FPI (MoM) 2.0%
18:45 NZD Manufacturing Sales (QoQ) 2.9%
19:01 GBP RICS House Price Balance -23% -22%
21:30 AUD NAB Business Confidence 2

Tuesday, September 13
All Day Holiday Hong Kong - Day Following Mid-autumn Festival
01:30 EUR French CPI (MoM) 0.3% -0.4%
03:00 EUR Spanish CPI (YoY) 3.0% 3.1%
04:30 GBP Trade Balance -8.5B -8.9B
04:30 GBP DCLG House Price Index (YoY) -1.2% -2.0%
04:30 GBP RPI (YoY) 5.1% 5.0%
04:30 GBP CPI (YoY) 4.5% 4.4%
04:30 GBP Core CPI (YoY) 3.0% 3.1%
07:30 USD NFIB Small Business Optimism 88.2 89.9
08:00 BRL Brazilian Retail Sales (YoY) 6.8% 7.1%
08:30 USD Import Price Index (MoM) -0.8% 0.3%
10:00 USD IBD/TIPP Economic Optimism 37.0 35.8
14:00 USD Federal Budget Balance -126.5B -129.4B
20:30 AUD Westpac Consumer Sentiment -3.50%
21:30 AUD Housing Starts (QoQ) 2.10% 3.10%

Wednesday, September 14
00:30 JPY Industrial Production (MoM) 0.6% 0.6%
Tentative INR Indian CPI (YoY) 9.2% 9.2%
03:15 CHF PPI (MoM) -0.3% -0.6%
04:30 GBP Unemployment Rate 7.9% 7.9%
04:30 GBP Claimant Count Change 32.0K 37.1K
04:30 GBP Average Earnings Index +Bonus 2.7% 2.6%
05:00 EUR Industrial Production (MoM) 1.5% -0.7%
07:00 USD MBA Mortgage Applications -4.9%
08:30 USD Retail Sales (MoM) 0.2% 0.5%
08:30 USD Treasury Secretary Geithner Speaks
08:30 USD PPI (MoM) 0.0% 0.2%
08:30 CAD Capacity Utilization Rate 79.7% 79.0%
08:30 USD Core PPI (MoM) 0.2% 0.4%
08:30 USD Core Retail Sales (MoM) 0.2% 0.5%
10:00 USD Business Inventories (MoM) 0.5% 0.3%
10:30 USD Crude Oil Inventories -4.0M
10:30 USD Gasoline Inventories 0.2M
17:00 NZD RBNZ Rate Statement
17:00 NZD Interest Rate Decision 2.50% 2.50%
17:00 NZD RBNZ Monetary Policy Statement
18:30 NZD Business NZ PMI 53.2
21:00 AUD MI Inflation Expectations 2.7%
21:30 AUD RBA Bulletin
21:30 AUD New Motor Vehicle Sales (MoM) 8.6%

Thursday, September 15
01:00 SGD Singaporean Retail Sales (YoY) 8.8% 10.9%
03:15 CHF Industrial Production (QoQ) 3.0% -9.2%
03:30 CHF Interest Rate Decision 0.00% 0.00%
04:00 EUR ECB Monthly Report
04:00 EUR Italian CPI (MoM) 0.3% 0.3%
04:30 GBP Retail Sales (MoM) -0.2% 0.2%
04:30 GBP Inflation Expectations 3.9%
05:00 EUR Employment Change (QoQ) 0.2% 0.1%
05:00 EUR Core CPI (YoY) 1.2% 1.2%
05:00 EUR CPI (YoY) 2.5% 2.5%
08:30 USD Initial Jobless Claims 410K 414K
08:30 USD NY Empire State Manufacturing Index -4.00 -7.70
08:30 USD Continuing Jobless Claims 3700K 3717K
08:30 CAD New Motor Vehicle Sales (MoM) 10.8%
08:30 USD Current Account -121.0B -119.0B
08:30 USD CPI (MoM) 0.2% 0.5%
08:30 CAD Manufacturing Sales (MoM) 1.20% -1.50%
08:30 USD Core CPI (MoM) 0.2% 0.2%
09:15 USD Capacity Utilization Rate 77.5% 77.5%
09:15 USD Industrial Production (MoM) 0.1% 0.9%
09:45 USD Bloomberg Consumer Confidence -49.3
10:00 USD Philadelphia Fed Manufacturing Index -16.0 -30.7
10:30 USD Natural Gas Storage 64B
14:00 EUR ECB President Trichet Speaks

Friday, September 16
01:00 SGD Singaporean Trade Balance 5.42B
04:00 EUR Italian Trade Balance -1.97B -1.83B
04:00 EUR Current Account -5.6B -7.4B
05:00 EUR Trade Balance 1.7B -1.6B
08:30 CAD Foreign Securities Purchases -3.46B
09:00 USD TIC Net Long-Term Transactions 27.3B 3.7B
09:55 USD Michigan Inflation Expectations 3.5%
09:55 USD Michigan Consumer Sentiment Index 56.0 55.7

Results for the week of: 04/09/2011 - 10/09/2011
04 Sep 2011 - 10 Sep 2011


Time Cur. Imp. Event Actual Forecast Previous
Sunday, September 04
19:30 AUD AIG Services Index 52.1 48.8
20:30 AUD MI Inflation Gauge (MoM) -0.1% 0.3%
21:30 AUD ANZ Job Advertisements (MoM) -0.60% -0.60%
21:30 AUD Company Gross Operating Profits (QoQ) 6.7% 2.9% -2.2%

Monday, September 05
All Day Holiday United States - Labor Day
01:00 IDR Indonesian Trade Balance 1.36B 1.80B 3.33B
03:50 EUR French Services PMI 56.8 56.1 56.1
03:55 EUR German Services PMI 51.1 50.4 50.4
04:00 EUR Services PMI 51.5 51.5 51.5
04:30 GBP Services PMI 51.1 54.3 55.4
04:30 EUR Sentix Investor Confidence -15.4 -18.0 -13.5
05:00 EUR Retail Sales (MoM) 0.2% 0.1% 0.7%
19:01 GBP BRC Retail Sales Monitor (YoY) -0.6% 0.0% 0.6%
20:30 KRW South Korean GDP (QoQ) 0.9% 0.7% 1.3%
21:30 AUD Home Loans (MoM) 1.0% 1.5% 0.6%
21:30 AUD Current Account -7.4B -7.0B -11.1B

Tuesday, September 06
00:30 AUD RBA Rate Statement
00:30 AUD Interest Rate Decision 4.75% 4.75% 4.75%
03:15 CHF CPI (MoM) -0.3% -0.2% -0.8%
05:00 EUR GDP (QoQ) 0.2% 0.2% 0.2%
06:00 EUR German Factory Orders (MoM) -2.8% -1.5% 1.8%
08:00 BRL Brazilian CPI (YoY) 7.2% 7.0% 6.9%
10:00 USD ISM Non-Manufacturing Index 53.3 51.0 52.7
19:01 GBP BRC Shop Price Index (YoY) 2.70% 2.80%
19:30 AUD RBA Governor Stevens Speaks
19:30 AUD AIG Construction Index 32.1 36.1
21:30 AUD GDP (QoQ) 1.2% 1.0% -0.9%
23:20 JPY Interest Rate Decision 0.10% 0.10% 0.10%

Wednesday, September 07
01:00 JPY Leading Index 106.0 105.9 103.3
03:00 GBP Halifax House Price Index (MoM) -1.20% 0.50% 0.20%
03:15 JPY BoJ Press Conference
04:30 GBP Manufacturing Production (MoM) 0.1% 0.1% -0.4%
04:30 GBP Industrial Production (MoM) -0.2% 0.0% 0.0%
06:00 EUR German Industrial Production (MoM) 4.0% 0.5% -1.0%
07:00 USD MBA Mortgage Applications -4.9% -9.6%
09:00 CAD Interest Rate Decision 1.00% 1.00% 1.00%
10:00 GBP NIESR GDP Estimate 0.2% 0.6%
10:00 CAD Ivey PMI 57.6 46.7 45.4
11:15 USD Chicago Fed President Evans Speaks
14:00 USD Beige Book
19:50 JPY Bank Lending (YoY) -0.5% -0.6%
19:50 JPY Current Account 0.75T 0.99T 0.92T
19:50 JPY Core Machinery Orders (MoM) -8.2% -4.2% 7.7%
21:00 KRW South Korean Interest Rate Decision 3.25% 3.25% 3.25%
21:30 AUD Unemployment Rate 5.3% 5.1% 5.1%
21:30 AUD Employment Change -9.7K 10.0K -4.1K

Thursday, September 08
01:00 JPY BoJ Monthly Report
01:00 JPY Economy Watchers Current Index 47.3 54.3 52.6
01:30 EUR French Non-Farm Payrolls (QoQ) 0.2% 0.4% 0.4%
01:45 CHF Unemployment Rate 3.0% 3.0% 3.0%
02:00 JPY Machine Tool Orders (YoY) 15.3% 34.6%
02:00 EUR German Trade Balance 10.1B 11.0B 11.5B
02:45 EUR French Trade Balance -6.5B -5.9B -5.4B
03:00 EUR Spanish Industrial Production (YoY) -2.8% -1.5% -2.0%
07:00 GBP Interest Rate Decision 0.50% 0.50% 0.50%
07:45 EUR Interest Rate Decision 1.50% 1.50% 1.50%
08:30 USD Initial Jobless Claims 414K 405K 412K
08:30 USD Continuing Jobless Claims 3717K 3705K 3747K
08:30 EUR ECB Press Conference
08:30 CAD Trade Balance -0.8B -1.1B -1.4B
08:30 CAD Building Permits (MoM) 6.3% 0.0% 2.8%
08:30 CAD New Housing Price Index (MoM) 0.1% 0.4% 0.3%
08:30 USD Trade Balance -44.8B -51.0B -51.6B
09:45 USD Bloomberg Consumer Confidence -49.3 -49.1
10:30 USD Natural Gas Storage 64B 60B 55B
11:00 USD Gasoline Inventories 0.2M -1.4M -2.8M
11:00 USD Crude Oil Inventories -4.0M -2.2M 5.3M
13:30 USD Fed Chairman Bernanke Speaks
15:00 USD Consumer Credit 12.0B 5.4B 11.3B
19:50 JPY M2 Money Stock (YoY) 2.7% 2.9% 3.0%
19:50 JPY GDP Price Index (YoY) -2.2% -1.5% -2.2%
19:50 JPY GDP (QoQ) -0.5% -0.5% -0.3%
22:00 CNY Chinese PPI (YoY) 7.3% 7.3% 7.5%
22:00 CNY Chinese CPI (YoY) 6.2% 6.3% 6.5%

Friday, September 09
01:00 JPY Household Confidence 37.0 41.3 37.0
01:30 CNY Chinese Retail Sales (YoY) 17.0% 16.8% 17.2%
01:30 CNY Chinese Fixed Asset Investment (YoY) 25.0% 25.3% 25.4%
01:30 CNY Chinese Industrial Production (YoY) 13.5% 14.0% 14.0%
02:00 EUR German WPI (MoM) 0.1% 0.3% -0.6%
02:00 EUR German CPI (MoM) 0.0% -0.1% -0.1%
02:45 EUR French Industrial Production (MoM) 1.5% 0.4% -1.5%
02:45 EUR French Government Budget Balance -86.6B -75.0B -61.3B
04:00 EUR Italian GDP (QoQ) 0.3% 0.3% 0.3%
04:30 GBP PPI Output (MoM) 0.1% 0.1% 0.3%
04:30 GBP PPI Input (MoM) -1.9% -1.5% 0.5%
05:00 GBP CB Leading Index (MoM) 0.3% 0.0%
07:00 CAD Unemployment Rate 7.3% 7.3% 7.2%
07:00 CAD Employment Change -5.5K 22.5K 7.1K
08:15 CAD Housing Starts 185K 200K 205K
08:30 CAD Labor Productivity (QoQ) -0.9% 0.4%
10:00 USD Wholesale Inventories (MoM) 0.8% 0.8% 0.6%
23:00 CNY Chinese Trade Balance 17.8B 24.7B 31.5B

Saturday, September 10
22:30 CNY Chinese M2 Money Stock (YoY) 13.50% 14.30% 14.70%

Results for the week of: 28/08/2011 - 2/09/2011
28 Aug 2011 - 2 Sept 2011

Time Cur. Imp. Event Actual Forecast Previous
Sunday, August 28
21:00 AUD HIA New Home Sales (MoM) -8.0% -8.7%


Monday, August 29
All Day Holiday United Kingdom - Summer
03:05 EUR Spanish Retail Sales (YoY) -6.0% -7.5% -7.6%
04:00 EUR Italian Consumer Confidence 100.3 101.5 103.7
08:00 EUR German CPI (MoM) -0.1% 0.0% 0.4%
08:30 USD Personal Income (MoM) 0.3% 0.4% 0.2%
08:30 USD Personal Spending (MoM) 0.8% 0.5% -0.1%
08:30 USD Core PCE Price Index (MoM) 0.2% 0.2% 0.2%
09:00 EUR ECB President Trichet Speaks
10:00 USD Pending Home Sales (MoM) -1.3% -1.0% 2.4%
18:45 NZD Building Consents (MoM) 13.0% -1.0%
19:30 JPY Household Spending (YoY) -2.1% -3.5% -4.2%
19:30 JPY Unemployment Rate 4.7% 4.6% 4.6%
19:50 JPY Retail Sales (YoY) 0.7% 1.5% 1.2%
21:30 AUD Building Approvals (MoM) 1.0% 2.1% -3.6%


Tuesday, August 30
All Day Holiday Singapore - Hari Raya Puasa
02:00 INR Indian GDP (YoY) 7.7% 7.6% 7.8%
02:00 CHF Consumption Indicator 1.29 1.52
04:00 EUR Italian Retail Sales (MoM) -0.2% 0.2% -0.2%
04:30 GBP M4 Money Supply (MoM) -0.1% 0.4% -0.4%
04:30 GBP Net Lending to Individuals 0.9B 1.1B 0.4B
04:30 GBP Mortgage Approvals 49K 49K 48K
05:00 EUR Business and Consumer Survey 98.3 102.0 103.0
05:00 EUR Italian Business Confidence 99.9 97.0 98.8
08:30 CAD RMPI (MoM) -1.2% 0.2% -2.4%
08:30 CAD Current Account -15.3B -13.8B -10.1B
08:30 CAD IPPI (MoM) -0.3% 0.0% -0.2%
09:00 USD S&P/CS Home Price Indices Composite - 20 (YoY) -4.5% -4.7% -4.6%
10:00 USD CB Consumer Confidence 44.5 52.2 59.2
14:00 USD FOMC Meeting Minutes
19:01 GBP GfK Consumer Confidence -31 -31 -30
19:15 JPY Manufacturing PMI 51.9 52.1
19:50 JPY Industrial Production (MoM) 0.6% 1.6% 3.8%
20:00 KRW South Korean Retail Sales (MoM) 2.3% 1.5% 1.4%
20:00 KRW South Korean Industrial Production (YoY) 3.8% 7.0% 6.5%
21:00 NZD Business Confidence 34.40 47.60
21:30 AUD Private Sector Credit (MoM) 0.2% 0.2% -0.1%
21:30 JPY Average Cash Earnings (YoY) -0.1% -0.4% -0.7%


Wednesday, August 31
01:00 JPY Housing Starts (YoY) 21.2% 4.7% 5.8%
02:00 EUR German Retail Sales (MoM) 0.0% -1.5% 4.5%
03:55 EUR German Unemployment Change -8K -10K -10K
03:55 EUR German Unemployment Rate 7.0% 7.0% 7.0%
04:00 EUR Italian Monthly Unemployment Rate 8.0% 8.1% 8.0%
05:00 EUR Unemployment Rate 10.0% 9.9% 10.0%
05:00 EUR CPI (YoY) 2.5% 2.5% 2.5%
05:00 EUR Italian CPI (MoM) 0.3% 0.3% 0.3%
06:00 EUR Spanish Business Confidence -13 -15 -15
06:00 EUR Italian PPI (MoM) 0.3% 0.3% 0.0%
07:00 USD MBA Mortgage Applications -9.6% -2.4%
07:30 USD Challenger Job Cuts (YoY) 47.0% 59.4%
08:00 BRL Brazilian Industrial Production (YoY) 1.4% 0.8% 1.0%
08:15 USD ADP Nonfarm Employment Change 91K 103K 109K
08:30 CAD GDP (MoM) 0.2% 0.1% -0.3%
09:45 USD Chicago PMI 56.5 54.8 58.8
10:00 USD Factory Orders (MoM) 2.4% 1.0% -0.4%
10:30 USD Gasoline Inventories -2.8M -0.9M 1.4M
10:30 USD Crude Oil Inventories 5.3M 0.9M -2.2M
18:00 BRL Brazilian Interest Rate Decision 12.00% 12.50% 12.50%
18:45 NZD Terms of Trade Index (QoQ) 2.3% 0.6% 0.8%
19:00 KRW South Korean CPI (YoY) 5.3% 4.5% 4.7%
19:30 AUD AIG Manufacturing Index 43.3 43.4
21:00 NZD ANZ Commodity Price Index (MoM) -1.2% -0.2%
21:30 AUD Retail Sales (MoM) 0.5% 0.3% -0.1%
21:30 AUD Private New Capital Expenditure (QoQ) 4.9% 4.1% 7.7%
22:00 KRW South Korean Trade Balance 0.82B 4.00B 6.30B


Thursday, September 01
01:45 CHF GDP (QoQ) 0.4% 0.4% 0.6%
02:00 GBP Nationwide HPI (MoM) -0.6% 0.1% 0.3%
02:00 EUR German GDP (QoQ) 0.1% 0.1% 0.1%
02:30 INR Indian Trade Balance -11.1B 14.9B -7.7B
02:30 EUR French Unemployment Rate 9.1% 9.3% 9.2%
02:30 AUD Commodity Prices (YoY) 25.2% 28.9%
03:15 CHF Retail Sales (YoY) 1.9% 4.6% 7.9%
03:30 CHF SVME PMI 51.7 51.2 53.5
03:50 EUR French Manufacturing PMI 49.1 49.3 49.3
03:55 EUR German Manufacturing PMI 50.9 52.0 52.0
04:00 EUR Manufacturing PMI 49.0 49.7 49.7
04:30 GBP Manufacturing PMI 49.0 49.5 49.4
08:30 USD Continuing Jobless Claims 3735K 3685K 3753K
08:30 USD Unit Labor Costs (QoQ) 3.3% 2.3% 2.2%
08:30 USD Initial Jobless Claims 409K 409K 421K
08:30 USD Nonfarm Productivity (QoQ) -0.7% -0.4% -0.3%
09:45 USD Bloomberg Consumer Confidence -49.1 -46.3 -47.0
10:00 BRL Brazilian Trade Balance 3.87B 2.70B 3.14B
10:00 USD Construction Spending (MoM) -1.3% 0.2% 1.6%
10:00 USD ISM Manufacturing Prices 55.5 55.0 59.0
10:00 USD ISM Manufacturing Index 50.6 48.5 50.9
10:30 USD Natural Gas Storage 55B 60B 73B
12:30 USD Chain Store Sales (YoY) 4.6% 4.6%
16:00 USD Total Vehicle Sales 12.1M 12.1M 12.2M
19:50 JPY Monetary Base (YoY) 15.9% 14.2% 15.0%
19:50 JPY Capital Spending -7.80% 1.10% 3.00%

Friday, September 02
00:05 USD Monster Employment Index 147 144
03:15 CHF Employment Level 2.77M 4.11M 4.11M
04:30 GBP Construction PMI 52.6 53.1 53.5
05:00 EUR PPI (MoM) 0.5% 0.5% 0.0%
08:00 BRL Brazilian GDP (YoY) 3.1% 3.3% 4.2%
08:30 USD Private Nonfarm Payrolls 17K 110K 156K
08:30 USD Average Weekly Hours 34.2 34.3 34.3
08:30 USD Nonfarm Payrolls 0K 74K 85K
08:30 USD Average Hourly Earnings (MoM) -0.1% 0.2% 0.5%
08:30 USD Unemployment Rate 9.1% 9.1% 9.1%

Results for the week of: 22/08/2011 - 26/08/2011
22 Aug 2011 - 26 Aug 2011
Date Time Event Importance Actual Forecast Previous

Mon Aug 22

CHF Real Estate Index Family Homes (2Q) Medium 392.3
05:00 JPY Supermarket Store Sales (YoY) (JUL) Low 2.1% 0.1%
07:00 CHF Money Supply M3 (YoY) (JUL) Low 5.9% 4.9%
07:00 JPY Convenience Store Sales (YoY) (JUL) Low 9.5% 9.0%
12:30 USD Chicago Fed Nat Activity Index (JUL) Medium -0.06 -0.48 -0.38
14:00 USD MBA Mortgage Foreclosures (2Q) Low 4.52%
14:00 USD Mortgage Delinquencies (2Q) Low 8.32%
Tue Aug 23
00:00 GBP CBI Trends Total Orders (AUG) Low -12 -10
02:30 CNY HSBC Flash China Manufacturing PMI (AUG) Low 48.9
03:00 NZD Reserve Bank of New Zealand 2-Year Inflation Expectation (3Q) Medium 3.0%
06:00 CHF Trade Balance (Swiss franc) (JUL) Medium 1.74B
06:00 JPY Machine Tool Orders (YoY) (JUL F) Medium
06:00 CHF Exports (MoM) (JUL) Low -2.5% 5.2%
06:00 CHF Imports (MoM) (JUL) Low 2.5%
07:00 EUR French Purchasing Manager Index Manufacturing (AUG P) Low 49.7 50.5
07:00 EUR French Purchasing Manager Index Services (AUG P) Low 53.5 54.2
08:30 GBP BBA Loans for House Purchase (JUL) Medium 31750 31747
09:00 EUR German ZEW Survey (Economic Sentiment) (AUG) High -26.0 -15.1
09:00 EUR Euro-Zone ZEW Survey (Economic Sentiment) (AUG) Medium -7
09:00 EUR German ZEW Survey (Current Situation) (AUG) Medium 85.0 90.6
10:00 GBP CBI Trends Selling Prices (AUG) Low 4
12:30 CAD Retail Sales (MoM) (JUN) Medium 0.1%
12:30 CAD Retail Sales Less Autos (MoM) (JUN) Low 0.5%
14:00 EUR Euro-Zone Consumer Confidence (AUG A) Medium -12.4 -11.2
14:00 USD New Home Sales (JUL) Medium 315K 312K
14:00 USD New Home Sales (MoM) (JUL) Medium 1.0% -1.0%
14:00 USD Richmond Fed Manufacturing Index (AUG) Low -5 -1
22:45 NZD Balance (YTD) (New Zealand dollars) (JUL) Medium 1104 1021
22:45 NZD Trade Balance (New Zealand dollars) (JUL) Medium -100M 230M
22:45 NZD Exports (New Zealand dollars) (JUL) Low 3.85B 3.97B
22:45 NZD Imports (New Zealand dollars) (JUL) Low 3.90B 3.74B
23:50 JPY Corporate Service Price (YoY) (JUL) Low -0.5% -0.7%
Wed Aug 24
00:00 AUD Conference Board Leading Index (JUN) Medium -0.1%
EUR Euro-Zone Purchasing Manager Index Composite (AUG A) Medium 50.0 51.1
EUR Euro-Zone Purchasing Manager Index Manufacturing (AUG A) Medium 49.5 50.4
EUR Euro-Zone Purchasing Manager Index Services (AUG A) Medium 50.9 51.6
EUR German Purchasing Manager Index Manufacturing (AUG A) Medium 50.6 52.0
EUR German Purchasing Manager Index Services (AUG A) Medium 52.0 52.9
CNY Leading Index (JUL) Low 101.76
JPY Small Business Confidence (AUG) Low 47.1
01:30 AUD Construction Work Done (2Q) Low 1.0% 0.7%
08:00 EUR German IFO - Business Climate (AUG) Medium 111.0 112.9
08:00 EUR German IFO - Current Assessment (AUG) Medium 119.8 121.4
08:00 EUR German IFO - Expectations (AUG) Medium 102.8 105.0
09:00 EUR Euro-Zone Industrial New Orders (YoY) (JUN) Medium 11.9% 15.5%
09:00 EUR Euro-Zone Industrial New Orders s.a. (MoM) (JUN) Low 0.4% 3.6%
11:00 USD MBA Mortgage Applications (AUG 19) Low
12:30 USD Durable Goods Orders (JUL) High 2.3% -1.9%
12:30 USD Durables Ex Transportation (JUL) Medium -0.5% 0.1%
12:30 USD Cap Goods Orders Nondef Ex Air (JUL) Low -1.8% -0.4%
12:30 USD Cap Goods Ship Nondef Ex Air (JUL) Low 1.0%
14:00 USD House Price Index (MoM) (JUN) Medium 0.1% 0.4%
14:00 USD House Price Purchase Index (QoQ) (2Q) Medium -0.5% -2.5%
14:30 DOE Cushing OK Crude Inventory (AUG 19) Low
14:30 DOE U.S. Crude Oil Inventories (AUG 19) Low
14:30 DOE U.S. Distillate Inventory (AUG 19) Low
14:30 DOE U.S. Gasoline Inventories (AUG 19) Low
14:30 DOE U.S. Refinery Utilization (AUG 19) Low
22:45 NZD Retail Sales Ex Inflation (QoQ) (2Q) Medium 0.6% 0.9%
22:45 NZD Food Prices (MoM) (JUL) Low 1.4%
23:30 AUD CBAHIA House Affordability (2Q) Low 55.7
23:50 JPY Foreign Buying Japan Bonds (Yen) (AUG 19) Low
23:50 JPY Foreign Buying Japan Stocks (Yen) (AUG 19) Low
23:50 JPY Japan Buying Foreign Bonds (Yen) (AUG 19) Low
23:50 JPY Japan Buying Foreign Stocks (Yen) (AUG 19) Low
Thu Aug 25
GBP CBI Reported Sales (AUG) Medium -10 -5
GBP Nationwide House Prices n.s.a. (YoY) (AUG) Medium -0.4%
EUR German Import Price Index (MoM) (JUL) Low 0.3% -0.6%
EUR German Import Price Index (YoY) (JUL) Low 7.0% 6.5%
GBP Nationwide House Prices s.a. (MoM) (AUG) Low 0.2%
09:00 CHF ZEW Survey (Expectations) (AUG) Medium -58.9
12:30 USD Continuing Claims (AUG 13) Low 3700K 3702K
12:30 USD Initial Jobless Claims (AUG 19) Low 405K 408K
13:45 USD Bloomberg Consumer Comfort (AUG 21) Low
14:30 USD EIA Natural Gas Storage Change (AUG 19) Low
16:00 EUR French Total Jobseekers (JUL) Low 2720.4
16:00 EUR French Total Jobseekers Change (JUL) Low 33.6
23:30 JPY National Consumer Price Index Ex-Fresh Food (YoY) (JUL) Medium -0.1% -0.2%
23:30 JPY National Consumer Price Index Ex Food, Energy (YoY) (JUL) Medium -0.6% -0.8%
23:30 JPY National Consumer Price Index (YoY) (JUL) Medium 0.0% -0.4%
23:30 JPY Tokyo Consumer Price Index Ex-Fresh Food (YoY) (AUG) Low -0.1% 0.4%
23:30 JPY Tokyo Consumer Price Index Ex Food, Energy (YoY) (AUG) Low -0.1% 0.3%
23:30 JPY Tokyo Consumer Price Index (YoY) (AUG) Low -0.2% 0.5%
Fri Aug 26
01:35 CNY MNI August Business Condition Survey Low
02:00 CNY Industrial Profits YTD (YoY) (JUL) Medium 28.7%
04:00 EUR German Retail Sales (YoY) (JUL) Medium -1.0%
04:00 EUR German Retail Sales (MoM) (JUL) Low 6.3%
06:00 EUR German GfK Consumer Confidence Survey (SEP) Medium 5.4
08:00 EUR Euro-Zone M3 s.a. (3M) (JUL) Low 2.3% 2.2%
08:00 EUR Euro-Zone M3 s.a. (YoY) (JUL) Low 2.2% 2.1%
08:30 GBP Gross Domestic Product (QoQ) (2Q P) High 0.2% 0.2%
08:30 GBP Gross Domestic Product (YoY) (2Q P) High 0.7% 0.7%
08:30 GBP Total Business Investment (YoY) (2Q P) Medium 2.7%
08:30 GBP Index of Services (3Mo3M) (JUN) Low 1.2%
08:30 GBP Index of Services (MoM) (JUN) Low 1.6%
08:30 GBP Private Consumption (2Q P) Low -0.6%
08:30 GBP Total Business Investment (QoQ) (2Q P) Low -3.2%
09:30 CHF KOF Swiss Leading Indicator (AUG) Medium 1.80 2.04
12:30 USD Gross Domestic Product (Annualized) (2Q S) High 1.1% 1.3%
12:30 USD Gross Domestic Product Price Index (2Q S) High 2.3% 2.3%
12:30 USD Core Personal Consumption Expenditure (QoQ) (2Q S) Medium 2.1% 2.1%
12:30 USD Personal Consumption (2Q S) Medium 0.2% 0.1%
13:55 USD U. of Michigan Confidence (AUG F) (AUG F) High 56 54.9
14:00 USD Bernanke Speech

Results for the week of: 14/08/2011 - 19/08/2011
14 Aug 2011 - 19 Aug 2011

GMT Country/Event Actual Cons. Previous Vol.
Aug 14
23:01 United Kingdom Rightmove House Price Index (YoY) (Aug) -0.3% 0.1% 1
23:01 United Kingdom Rightmove House Price Index (MoM) (Aug) -2.2% -1.6% 1
23:50 Japan Gross Domestic Product Deflator (YoY) (Q2) Preliminar -2.2% -1.7% -1.9% 1
23:50 Japan Gross Domestic Product Annualized (Q2) Preliminar -1.3% -2.6% -3.6%Revised from -3.5% 2
23:50 Japan Gross Domestic Product (QoQ) (Q2) Preliminar -0.3% -0.7% -0.9% 2 Aug 15
01:30 Australia New Motor Vehicle Sales (YoY) (Jul) 0.9% -11.5% 1
01:30 Australia New Motor Vehicle Sales (MoM) (Jul) 8.6% 1.9%Revised from 1.3% 1
07:15 Switzerland Producer and Import Prices (YoY) (Jul) -0.6% -0.4% 1
07:15 Switzerland Producer and Import Prices (MoM) (Jul) -0.7% -0.5% -0.5% 1
12:30 United States NY Empire State Manufacturing Index (Aug) -7.72 0.80 -3.76 1
12:30 Canada New Motor Vehicle Sales (MoM) (Jun) 10.8% 2.4% -6.1% 1
13:00 United States Net Long-Term TIC Flows (Jun) $3.7B $30.4B $24.2BRevised from $23.6B 2
13:00 United States Total Net TIC Flows (Jun) $-29.5B $-48.8BRevised from $-67.5B 1
14:00 United States NAHB Housing Market Index (Aug) 15 15 15 1 Aug 16
01:30 Australia RBA Meeting's Minutes (Aug) 3
02:30 China FDI - Foreign Direct Investment (YTD)(YoY) (Jul) 18.6% 2.8% 1
06:00 Germany Gross Domestic Product s.a (QoQ) (Q2) Preliminar 0.1% 0.5% 1.3%Revised from 1.5% 2
06:00 Germany Gross Domestic Product w.d.a (YoY) (Q2) Preliminar 2.7% 2.9% 4.9% 2
06:00 Germany Gross Domestic Product n.s.a (YoY)Preliminar 2.8% 3.2% 5.0%Revised from 5.2% 2
08:30 United Kingdom DCLG House Price Index (YoY) -2.0% 0.9% -1.6% 1
08:30 United Kingdom Retail Price Index (MoM) (Jul) -0.2% -0.2% 0.0% 1
08:30 United Kingdom Retail Price Index (YoY) (Jul) 5% 5% 5% 2
08:30 United Kingdom Consumer Price Index (MoM) (Jul) 0.0% -0.1% -0.1% 2
08:30 United Kingdom Consumer Price Index (YoY) (Jul) 4.4% 4.3% 4.2% 2
08:30 United Kingdom Core Consumer Price Index (YoY) (Jul) 3.1% 3.0% 2.8% 2
09:00 European Monetary Union Gross Domestic Product s.a. (YoY) (Q2) Preliminar 1.7% 1.8% 2.5% 2
09:00 European Monetary Union Trade Balance s.a. (Jun) EUR-1.6B EUR0.0B EUR-0.8BRevised from EUR-0.6B 1
09:00 European Monetary Union Trade Balance n.s.a. (Jun) EUR0.9B EUR1.1B EUR0.2BRevised from EUR0.0B 1
09:00 European Monetary Union Gross Domestic Product s.a. (QoQ) (Q2) Preliminar 0.2% 0.3% 0.8% 2
12:30 United States Import Price Index (YoY) (Jul) 14.0% 13.0% 13.6% 1
12:30 Canada Manufacturing Shipments (MoM) (Jun) -1.5% -0.3% -0.7%Revised from -0.8% 1
12:30 United States Import Price Index (MoM) (Jul) 0.3% -0.1% -0.6%Revised from -0.5% 1
12:30 United States Housing Starts (MoM) (Jul) 0.604M 0.608M 0.613MRevised from 0.629M 1
12:30 United States Building Permits (MoM) (Jul) 0.597M 0.605M 0.620M 1
13:15 United States Capacity Utilization (Jul) 77.5% 76.9% 76.9%Revised from 76.7% 1
13:15 United States Industrial Production (MoM) (Jul) 0.9% 0.5% 0.4%Revised from 0.2% 2
22:45 New Zealand Producer Price Index - Input (QoQ) (Q2) 0.9% 1.2% 2.2% 1
22:45 New Zealand Producer Price Index - Output (QoQ) (Q2) 1.4% 0.8% 1.7% 1

Aug 17
00:30 Australia Westpac Leading Index (MoM) 0.1% -0.1% 1
01:30 Australia Wage Price Index (YoY) (Q2) 3.8% 3.8% 1
01:30 Australia Wage Price Index (QoQ) (Q2) 0.9% 0.9% 0.8% 1
08:00 European Monetary Union Current Account s.a (Jun) EUR-7.4B EUR-3.6B EUR-5.6BRevised from EUR-5.2B 1
08:00 European Monetary Union Current Account n.s.a (Jun) EUR-3.3B EUR-18.7BRevised from EUR-18.3B 1
08:30 United Kingdom Average Earnings including Bonus (3Mo/Yr) (Jun) 2.6% 2.3% 2.3% 2
08:30 United Kingdom Claimant Count Rate (Jul) 4.9% 4.7% 4.7% 2
08:30 United Kingdom ILO Unemployment Rate (3M) (Jun) 7.9% 7.7% 7.7% 2
08:30 United Kingdom Bank of England Minutes 3
08:30 United Kingdom Claimant Count Change (Jul) 37.1K 20.0K 31.3KRevised from 24.5K 2
08:30 United Kingdom Average Earnings excluding Bonus (3Mo/Yr) (Jun) 2.2% 2.3% 2.1% 2
09:00 European Monetary Union Consumer Price Index - Core (YoY) (Jul) 1.2% 1.6% 1.6% 2
09:00 European Monetary Union Consumer Price Index (YoY) (Jul) 2.5% 2.5% 2.7% 2
09:00 European Monetary Union Consumer Price Index (MoM) (Jul) -0.6% -0.6% 0.0% 1
11:00 United States MBA Mortgage Applications (Aug 12) 4.1% 21.7% 1
12:30 United States Producer Price Index (YoY) (Jul) 7.2% 7.0% 7.0% 2
12:30 United States Producer Price Index ex Food & Energy (MoM) (Jul) 0.4% 0.2% 0.3% 1
12:30 United States Producer Price Index ex Food & Energy (YoY) (Jul) 2.5% 2.3% 2.4% 2
12:30 Canada Canadian Investment in Foreign Securities (Jun) $-0.34B $-3.61BRevised from $-3.51B 1
12:30 Canada Foreign investment in Canadian securities (Jun) $-3.46B $10.33B $15.34BRevised from $15.44B 1
12:30 United States Producer Price Index (MoM) (Jul) 0.2% 0.1% -0.4% 1
14:30 United States EIA Crude Oil Stocks change (Aug 12) 4.2M -0.4M -5.2M 1
23:50 Japan Adjusted Merchandise Trade Balance (Jul) ¥-130.5B ¥-131.9B ¥-196.5BRevised from ¥-191.2B 1
23:50 Japan Merchandise Trade Balance Total (Jul) ¥72.5B ¥69.3B ¥68.6BRevised from ¥70.7B 1 Aug 18
01:30 Australia RBA Foreign Exchange Transaction (Jul) 605M 1280M 1
05:00 Japan Leading Economic Index (Jun) 103.2 99.4 1
05:00 Japan Coincident Index (Jun) 108.8 106.1Revised from 108.6 1
08:30 United Kingdom Retail Sales ex-Fuel (MoM) (Jul) 0.2% 0.3% 1.0%Revised from 0.8% 1
08:30 United Kingdom Retail Sales ex-Fuel (YoY) (Jul) -0.2% 0.3% 0.2% 2
08:30 United Kingdom Retail Sales (MoM) (Jul) 0.2% 0.4% 0.8%Revised from 0.7% 1
08:30 United Kingdom Retail Sales (YoY) (Jul) 0.0% 0.1% 0.4% 2
09:00 European Monetary Union Construction Output w.d.a (YoY) (Jun) -11.3% -1.9% 1
09:00 European Monetary Union Construction Output s.a (MoM) (Jun) -1.8% -1.1% 1
12:30 United States Continuing Jobless Claims (Aug 6) 3.702K 3.700M 3.695MRevised from 3.688M 1
12:30 United States Initial Jobless Claims (Aug 12) 408K 403K 399KRevised from 395K 1
12:30 Canada Wholesale Sales (MoM) (Jun) 0.2% 0.0% 2.0%Revised from 1.9% 1
12:30 Canada Leading Indicators (MoM) (Jul) 0.2% 0.2% 0.1%Revised from 0.2% 2
12:30 United States Consumer Price Index (YoY) (Jul) 3.6% 3.3% 3.6% 3
12:30 United States Consumer Price Index (MoM) (Jul) 0.5% 0.2% -0.2% 2
12:30 United States Consumer Price Index Ex Food & Energy (YoY) (Jul) 1.8% 1.7% 1.6% 3
12:30 United States Consumer Price Index Ex Food & Energy (MoM) (Jul) 0.2% 0.2% 0.3% 2
14:00 United States Leading Indicators (MoM) (Jul) 0.5% 0.2% 0.3% 1
14:00 United States Philadelphia Fed Manufacturing Survey (Aug) -30.7 4.2 3.2 2
14:00 United States Existing Home Sales Change (Jul) 4.67M 4.92M 4.84MRevised from 4.77M 2
14:00 United States Existing Home Sales (MoM) (Jul) -3.5% 3.5% 0.6%Revised from -0.8% 2
14:30 Canada Bank of Canada Monetary Policy Report 2
22:45 New Zealand Visitor Arrivals (YoY) (Jul) -3.7% -9.9% 1

Aug 19
03:00 New Zealand Credit Card Spending s.a. (YoY) (Jul) 7.3% 4.6%Revised from 4.5% 2
04:30 Japan All Industry Activity Index (MoM) 2.3% 2.2% 1.8%Revised from 2.0% 2
06:00 Germany Producer Price Index (YoY) (Jul) 5.8% 5.3% 5.6% 3
06:00 Germany Producer Price Index (MoM) (Jul) 0.7% 0.1% 0.1% 2
08:30 United Kingdom Public Sector Net Borrowing (Jul) £-1.961B £0.200B £12.374BRevised from £11.977B 2
11:00 Canada Consumer Price Index (MoM) (Jul) 0.2% 0.2% -0.7% 2
11:00 Canada Consumer Price Index (YoY) (Jul) 2.7% 2.8% 3.1% 3
11:00 Canada Bank of Canada Consumer Price Index Core (MoM) (Jul) 0.2% 0.2% -0.6% 1
11:00 Canada Bank of Canada Consumer Price Index Core (YoY) (Jul) 1.6% 1.6% 1.3% 2

Results for the week of: 7/08/2011 - 12/08/2011
7 Aug 2011 - 12 Aug 2011

Sunday, August 07, 2011


Time Event Period Consensus Prior
11:01 PM United Kingdom Lloyds Employment Confidence JUL - - -50
11:50 PM Japan Japan Money Stock M2 YoY JUL - - 2.9%
11:50 PM Japan Japan Money Stock M3 YoY JUL - - 2.2%
11:50 PM Japan Bank Lending Ex-Trusts YoY JUL - - -0,60%
11:50 PM Japan Bank Lending incl Trusts (YoY) JUL - - -0,60%
11:50 PM Japan Current Account Total JUN ?652.8B ?590.7B
11:50 PM Japan Adjusted Current Account Total JUN ?961.1B ?391.0B
11:50 PM Japan Current Account Balance YOY% JUN -40,10% -51,70%
11:50 PM Japan Trade Balance - BOP Basis JUN ?113.1B -?772.7B
12:00 AM New Zealand Quotable Value NZ House Price Inflation Report
12:00 AM New Zealand QV House Prices YoY% JUL - - -0,90%
1:30 AM Australia ANZ Job Advertisements (MoM) JUL - - 3,70%
4:30 AM Japan Bankruptcies (YoY) JUL - - 1,50%
5:00 AM Japan Eco Watchers Survey: Current JUL 50 49,6
5:00 AM Japan Eco Watchers Survey: Outlook JUL - - 49
5:00 AM Japan Bank of Japan Monthly Economic Report
5:45 AM Switzerland Unemployment Rate JUL - - 2,80%
5:45 AM Switzerland Unemployment Rate (sa) JUL 3,00% 3,00%
6:30 AM France Bank of France Bus. Sentiment JUL - - 99
6:30 AM Australia Foreign Reserves JUL - - A$41.1B
8:00 AM Norway Credit Indicator Growth (YoY) JUN - - 6,50%
8:30 AM European Union Sentix Investor Confidence AUG 4 5,3
1:30 PM European Union ECB Calls for Bids in 7-Day Main Refinancing Tender
1:30 PM European Union ECB Calls for Bids in 1-Month Tender
1:30 PM European Union ECB Announces Bond Purchases

Monday, August 08, 2011
10:45 PM New Zealand Statistics New Zealand on Electronic Card Transactions 10:45 PM New Zealand NZ Card Spending - Retail MoM JUL 0,50% 1,20%
10:45 PM New Zealand NZ Card Spending - Total MoM JUL 0,50% 0,80%
11:01 PM United Kingdom BRC Sales Like-For-Like YoY JUL - - -0,60%
11:01 PM United Kingdom RICS House Price Balance JUL - - -27%
11:50 PM Japan Japan Money Stock M2 YoY JUL 2,90% 2,90%
11:50 PM Japan Japan Money Stock M3 YoY JUL 2,20% 2,20%
1:30 AM Australia Home Loans MoM JUN 0,80% 4,40%
1:30 AM Australia Investment Lending JUN - - 4,40%
1:30 AM Australia Owner-Occupied Home Loan Value MoM JUN - - 2,20%
1:30 AM Australia NAB Business Confidence JUL - - 0
1:30 AM Australia NAB Business Conditions JUL - - 2
5:00 AM Japan Consumer Confidence JUL 37 35,3
5:45 AM Switzerland SECO Consumer Confidence JUL -5 -1
6:00 AM Germany Exports SA (MoM) JUN -1,00% 4,30%
6:00 AM Germany Imports SA (MoM) JUN -1,80% 3,70%
6:00 AM Germany Current Account (EURO) JUN 10.0B 6.9B
6:00 AM Germany Trade Balance JUN 14.0B 14.8B
6:00 AM Japan Machine Tool Orders (YoY) JUL P - - 53,50%
6:45 AM France Central Govt. Balance (Euros) JUN - - -68.4B
8:30 AM United Kingdom Industrial Production (MoM) JUN 0,40% 0,90%
8:30 AM United Kingdom Industrial Production (YoY) JUN 0,20% -0,80%
8:30 AM United Kingdom Manufacturing Production (MoM) JUN 0,20% 1,80%
8:30 AM United Kingdom Manufacturing Production (YoY) JUN 2,90% 2,80%
8:30 AM United Kingdom Visible Trade Balance GBP/Mn JUN -?8100 -?8478
8:30 AM United Kingdom Trade Balance Non EU GBP/Mn JUN - - -?5109
8:30 AM United Kingdom Total Trade Balance (GBP/Mln) JUN - - -?4060
9:15 AM European Union ECB Announces Allotment in 7-Day Main Refinancing Tender
9:15 AM European Union ECB Announces Allotment in 1-Month Tender
11:00 AM European Union ECB Announces Allotment in 7-Day Term Deposits
11:30 AM United States of America NFIB Small Business Optimism JUL - - 90,8
12:15 PM Canada Housing Starts JUL 193.2K 197.4K
12:30 PM United States of America Unit Labor Costs 2Q P 2,30% 0,70%
12:30 PM United States of America Nonfarm Productivity 2Q P -0,80% 1,80%
2:00 PM United States of America IBD/TIPP Economic Optimism AUG - - 41,4
6:15 PM United States of America FOMC Rate Decision 09-aug 0,25% 0,25%

Tuesday, August 09, 2011
11:50 PM Japan BOJ to Publish Minutes of July 11-12 Board Meeting
11:50 PM Japan Housing Loans YoY 2Q - - 2,70%
11:50 PM Japan Tertiary Industry Index (MoM) JUN 1,00% 0,90%
11:50 PM Japan Domestic CGPI (MoM) JUL 0,00% -0,10%
11:50 PM Japan Domestic CGPI (YoY) JUL 2,60% 2,50%
12:30 AM Australia Westpac Consumer Confidence s.a. (MoM) AUG - - -8,30%
12:30 AM Australia Westpac Consumer Confidence Index AUG - - 92,8
6:00 AM Germany Consumer Price Index (MoM) JUL F 0,40% 0,40%
6:00 AM Germany Consumer Price Index (YoY) JUL F 2,40% 2,40%
6:00 AM Germany CPI - EU Harmonised (MoM) JUL F 0,50% 0,50%
6:00 AM Germany CPI - EU Harmonised (YoY) JUL F 2,60% 2,60%
6:45 AM France Industrial Production (MoM) JUN - - 2,00%
6:45 AM France Industrial Production (YoY) JUN - - 2,60%
6:45 AM France Current Account (EURO) JUN - - -5.5B
6:45 AM France Manufacturing Production (MoM) JUN - - 1,50%
6:45 AM France Manufacturing Production (YoY) JUN - - 5,40%
8:00 AM Norway CPI (MoM) JUL - - -0,40%
8:00 AM Norway CPI (YoY) JUL - - 1,30%
8:00 AM Norway CPI Underlying (MoM) JUL - - -0,20%
8:00 AM Norway CPI Underlying (YoY) JUL - - 0,70%
8:00 AM Norway Producer Prices incl.Oil (MoM) JUL - - -0,90%
8:00 AM Norway Producer Prices incl.Oil (YoY) JUL - - 14,40%
9:30 AM United Kingdom Bank of England Inflation Report
9:30 AM United Kingdom Bank of England Releases Quarterly Inflation Report
11:00 AM United States of America MBA Mortgage Applications 05-aug - - 7,10%
12:00 PM Norway Norwegian Deposit Rates 10-aug - - 2,25%
2:00 PM United States of America JOLTs Job Openings JUN - - 2974
2:00 PM United States of America Wholesale Inventories JUN 1,00% 1,80%
6:00 PM United States of America Monthly Budget Statement JUL -$140.0B -$43.1B

Wednesday, August 10, 2011
10:30 PM New Zealand Business NZ Publishes Performance of Manufacturing Index
10:30 PM New Zealand Business NZ PMI JUL - - 54,3
11:50 PM Japan Machine Orders (MoM) JUN 1,80% 3,00%
11:50 PM Japan Machine Orders YOY% JUN 11,30% 10,50%
11:50 PM Japan Japan Buying Foreign Bonds 05-aug - -
11:50 PM Japan Japan Buying Foreign Stocks 05-aug - -
11:50 PM Japan Foreign Buying Japan Bonds 05-aug - -
11:50 PM Japan Foreign Buying Japan Stocks 05-aug - -
1:00 AM New Zealand ANZ-Roy Morgan Consumer Confidence Survey
1:00 AM Australia Consumer Inflation Expectation AUG - - 3,40%
1:00 AM New Zealand ANZ Consumer Confidence Index AUG - - 109,4
1:00 AM New Zealand ANZ Consumer Confidence MoM AUG - - -2,30%
1:30 AM Australia Employment Change JUL 10.0K 23.4K
1:30 AM Australia Unemployment Rate JUL 4,90% 4,90%
1:30 AM Australia Full Time Employment Change JUL - - 59.0K
1:30 AM Australia Part Time Employment Change JUL - - -35.6K
1:30 AM Australia Participation Rate JUL 65,60% 65,60%
2:00 AM Japan Tokyo Avg Office Vacancies (%) JUL - - 8,81
7:30 AM Sweden CPI - Headline Rate (MoM) JUL - - -0,20%
7:30 AM Sweden CPI - Headline Rate (YoY) JUL - - 3,10%
7:30 AM Sweden SW CPI - CPIF (MoM) JUL - - -0,30%
7:30 AM Sweden SW CPI - CPIF (YoY) JUL - - 1,50%
7:30 AM Sweden CPI Level JUL - - 311,28
8:00 AM European Union ECB Publishes Aug. Monthly Report
8:00 AM Sweden PES Unemployment Rate JUL - - 4,10%
12:30 PM Canada New Housing Price Index MoM JUN - - 0,40%
12:30 PM Canada New Housing Price Index YoY JUN - - 1,90%
12:30 PM Canada Int'l Merchandise Trade JUN -1.0B -0.8B
12:30 PM United States of America Trade Balance JUN -$47.5B -$50.2B
12:30 PM United States of America Initial Jobless Claims 05-aug - - 400K
12:30 PM United States of America Continuing Claims 30-jul - - - -
1:45 PM United States of America Bloomberg Consumer Comfort 07-aug - - -47,6

Thursday, August 11, 2011
3:00 AM New Zealand Foreign Holdings of New Zealand Government Bonds
3:00 AM New Zealand Non Resident Bond Holdings JUL - - 61,40%
4:30 AM Japan Industrial Production (MoM) JUN F - - 3,90%
4:30 AM Japan Industrial Production YOY% JUN F - - -1,60%
4:30 AM Japan Capacity Utilization (MoM) JUN - - 12,80%
5:30 AM France CPI - EU Harmonised (MoM) JUL - - 0,10%
5:30 AM France CPI - EU Harmonised (YoY) JUL - - 2,30%
5:30 AM France Consumer Price Index (MoM) JUL - - 0,10%
5:30 AM France Consumer Price Index (YoY) JUL - - 2,10%
5:30 AM France CPI Ex Tobacco Index JUL - - 122,49
5:30 AM France Gross Domestic Product (QoQ) 2Q P - - 0,90%
5:30 AM France Gross Domestic Product (YoY) 2Q P - - 2,20%
6:45 AM France Non-Farm Payrolls (QoQ) 2Q P - - 0,40%
6:45 AM France Wages (QoQ) 2Q P - - 1,00%
8:00 AM Italy Trade Balance (Total) (Euros) JUN - - -2407M
8:00 AM Italy Trade Balance Eu (Euros) JUN - - -600M
8:00 AM Norway Retail sales - vol sa (MoM) JUN - - 1,60%
8:00 AM Norway Retail Sales Vol. nsa. (YoY) JUN - - 7,70%
9:00 AM European Union Euro-Zone Ind. Prod. wda (YoY) JUN 4,50% 4,00%
9:00 AM European Union Euro-Zone Ind. Prod. sa (MoM) JUN 0,10% 0,10%
9:00 AM Italy CPI (NIC incl. tobacco) (MoM) JUL F 0,30% 0,30%
9:00 AM Italy CPI (NIC incl. tobacco) (YoY) JUL F 2,70% 2,70%
9:00 AM Italy CPI - EU Harmonized (MoM) JUL F -1,70% -1,70%
9:00 AM Italy CPI - EU Harmonized (YoY) JUL F 2,10% 2,10%
12:30 PM United States of America Advance Retail Sales JUL 0,40% 0,10%
12:30 PM United States of America Retail Sales Less Autos JUL 0,20% 0,00%
12:30 PM United States of America Retail Sales Ex Auto & Gas JUL 0,20% 0,20%
1:55 PM United States of America U. of Michigan Confidence AUG P 63,2 63,7
2:00 PM United States of America Business Inventories JUN 0,60% 1,00%
2:00 PM United States of America Fed's Dudley to Speak on Regional Economy in New York

Friday, August 12, 2011
Time Event Period Consensus Prior
3:00 AM New Zealand Foreign Holdings of New Zealand Government Bonds
3:00 AM New Zealand Non Resident Bond Holdings JUL - - 61,40%
4:30 AM Japan Industrial Production (MoM) JUN F - - 3,90%
4:30 AM Japan Industrial Production YOY% JUN F - - -1,60%
4:30 AM Japan Capacity Utilization (MoM) JUN - - 12,80%
5:30 AM France CPI - EU Harmonised (MoM) JUL - - 0,10%
5:30 AM France CPI - EU Harmonised (YoY) JUL - - 2,30%
5:30 AM France Consumer Price Index (MoM) JUL - - 0,10%
5:30 AM France Consumer Price Index (YoY) JUL - - 2,10%
5:30 AM France CPI Ex Tobacco Index JUL - - 122,49
5:30 AM France Gross Domestic Product (QoQ) 2Q P - - 0,90%
5:30 AM France Gross Domestic Product (YoY) 2Q P - - 2,20%
6:45 AM France Non-Farm Payrolls (QoQ) 2Q P - - 0,40%
6:45 AM France Wages (QoQ) 2Q P - - 1,00%
8:00 AM Italy Trade Balance (Total) (Euros) JUN - - -2407M
8:00 AM Italy Trade Balance Eu (Euros) JUN - - -600M
8:00 AM Norway Retail sales - vol sa (MoM) JUN - - 1,60%
8:00 AM Norway Retail Sales Vol. nsa. (YoY) JUN - - 7,70%
9:00 AM European Union Euro-Zone Ind. Prod. wda (YoY) JUN 4,50% 4,00%
9:00 AM European Union Euro-Zone Ind. Prod. sa (MoM) JUN 0,10% 0,10%
9:00 AM Italy CPI (NIC incl. tobacco) (MoM) JUL F 0,30% 0,30%
9:00 AM Italy CPI (NIC incl. tobacco) (YoY) JUL F 2,70% 2,70%
9:00 AM Italy CPI - EU Harmonized (MoM) JUL F -1,70% -1,70%
9:00 AM Italy CPI - EU Harmonized (YoY) JUL F 2,10% 2,10%
12:30 PM United States of America Advance Retail Sales JUL 0,40% 0,10%
12:30 PM United States of America Retail Sales Less Autos JUL 0,20% 0,00%
12:30 PM United States of America Retail Sales Ex Auto & Gas JUL 0,20% 0,20%
1:55 PM United States of America U. of Michigan Confidence AUG P 63,2 63,7
2:00 PM United States of America Business Inventories JUN 0,60% 1,00%
2:00 PM United States of America Fed's Dudley to Speak on Regional Economy in New York

Results for the week of: 31/07/2011 - 5/08/2011
31 July 2011 - 5 Aug 2011 31 July 2011 - 5 Aug 2011

Sunday, July 31, 2011
Time Event Period Consensus Prior
11:01 PM United Kingdom Lloyds Business Barometer JUL - - 36
11:30 PM Australia AiG Performance of Mfg Index JUL - - 52.9
12:30 AM Australia TD Securities Inflation MoM% JUL - - 0.0%
12:30 AM Australia TD Securities Inflation YoY% JUL - - 2.9%
1:00 AM New Zealand Commodity Price Index
1:00 AM New Zealand ANZ Commodity Price JUL - - -1.2%
1:00 AM Australia HIA New Home Sales (MoM) JUN - - -0.2%
2:00 AM New Zealand Treasury Publishes Monthly Economic Indicators
5:00 AM Japan Vehicle Sales (YoY) JUL - - -23.3%
6:30 AM Sweden Swedbank PMI Survey JUL - - 52.9
7:00 AM Norway Norway PMI SA JUL - - 56.1
7:30 AM Switzerland PMI Manufacturing JUL - - 53.4
7:45 AM Italy PMI Manufacturing JUL 49.0 49.9
7:50 AM France PMI Manufacturing JUL F 50.1 50.1
7:55 AM Germany PMI Manufacturing JUL F 52.1 52.1
8:00 AM Italy Unemployment Rate (SA) JUN P - - 8.1%
8:00 AM European Union PMI Manufacturing JUL F 50.4 50.4
8:30 AM United Kingdom PMI Manufacturing JUL 51.0 51.3
9:00 AM European Union Euro-Zone Unemployment Rate JUN 9.9% 9.9%
1:30 PM European Union ECB Calls for Bids in 7-Day Main Refinancing Tender
1:30 PM European Union ECB Announces Bond Purchases
2:00 PM United States of America Construction Spending MoM JUN -0.1% -0.6%
2:00 PM United States of America ISM Manufacturing JUL 55.0 55.3
2:00 PM United States of America ISM Prices Paid JUL 64.0 68.0
4:00 PM Italy New Car Registrations (YoY) JUL - - -1.7%
5:00 PM Italy Budget Balance JUL - - 1.3B
5:00 PM Italy Budget Balance (Year to date) JUL - - -43.5B

Monday, August 01, 2011 10:45 PM New Zealand Statistics New Zealand on Labor Costs Index
10:45 PM New Zealand Average Hourly Earnings QoQ 2Q 0.8% 0.3%
10:45 PM New Zealand Private Wages Exc Overtime QoQ 2Q 0.5% 0.4%
10:45 PM New Zealand Private Wages Inc Overtime QoQ 2Q 0.5% 0.4%
11:50 PM Japan Monetary Base (YoY) JUL - - 17.0%
1:30 AM Australia House Price Index QoQ 2Q -1.0% -1.7%
1:30 AM Australia House Price Index YoY 2Q -3.0% -0.2%
1:30 AM Australia Trade Balance JUN - - 2333M
1:30 AM Japan Labor Cash Earnings YoY JUN 0.4% 1.1%
1:30 AM Australia Building Approvals (MoM) JUN 3.0% -7.9%
1:30 AM Australia Building Approvals (YoY) JUN -10.3% -14.4%
4:30 AM Australia RBA CASH TARGET aug-02 4.75% 4.75%
6:30 AM Australia RBA Commodity Price Index Au JUL - - 109.4
6:30 AM Australia RBA Commodity Index SDR YoY% JUL - - 28.2%
7:15 AM Switzerland Retail Sales (Real) (YoY) JUN - - -4.1%
7:30 AM Switzerland PMI Manufacturing JUL 52.8 53.4
8:30 AM United Kingdom PMI Construction JUL 53.2 53.6
9:00 AM European Union Euro-Zone PPI (MoM) JUN 0.1% -0.2%
9:00 AM European Union Euro-Zone PPI (YoY) JUN 6.0% 6.2%
9:15 AM European Union ECB Announces Allotment in 7-Day Main Refinancing Tender
11:00 AM European Union ECB Announces Allotment in 7-Day Term Deposits
12:30 PM United States of America Annual Revisions: Personal Income and Spending
12:30 PM United States of America Personal Income JUN 0.2% 0.3%
12:30 PM United States of America Personal Spending JUN 0.2% 0.0%
12:30 PM United States of America PCE Deflator (YoY) JUN - - 2.5%
12:30 PM United States of America PCE Core (MoM) JUN 0.2% 0.3%
12:30 PM United States of America PCE Core (YoY) JUN 1.4% 1.2%
3:00 PM New Zealand Fonterra Milk Powder Auction Results Due
9:00 PM United States of America Total Vehicle Sales JUL 11.85M 11.41M
9:00 PM United States of America Domestic Vehicle Sales JUL 9.30M 8.95M

Tuesday, August 02, 2011 10:00 PM New Zealand Trade Minister Speaks at Pipfruit Conference
11:01 PM United Kingdom BRC Shop Price Index YoY JUL - - 2.9%
11:30 PM Australia AiG Perf of Construction Index JUL - - 35.8
11:30 PM Australia AiG Performance of Service Index JUL - - 48.5
1:30 AM Australia Retail Sales s.a. (MoM) JUN 0.4% -0.6%
1:30 AM Australia Trade Balance JUN 2200M 2333M
1:30 AM Australia Retail Sales Ex Inflation(QoQ) 2Q 0.4% 0.0%
2:30 AM New Zealand RBNZ Assistant Governor McDermott Speech
6:00 AM Switzerland UBS Real Estate Bubble Index 2Q - - 0.63
6:30 AM Australia Foreign Reserves JUL - - A$41.1B
7:15 AM France PMI Services JUL F 54.2 54.2
7:45 AM Italy PMI Services JUL - - 47.4
7:55 AM Germany PMI Services JUL F 52.9 52.9
8:00 AM European Union PMI Composite JUL F - - 50.8
8:00 AM European Union PMI Services JUL F 51.4 51.4
8:30 AM United Kingdom PMI Services JUL 53.5 53.9
8:30 AM United Kingdom Official Reserves (Changes) JUL - - -$148M
9:00 AM European Union Euro-Zone Retail Sales (MoM) JUN 0.5% -1.1%
9:00 AM European Union Euro-Zone Retail Sales (YoY) JUN -0.9% -1.9%
11:00 AM United States of America MBA Mortgage Applications jul-29 - - -5.0%
11:30 AM United States of America Challenger Job Cuts YoY JUL - - 5.3%
12:15 PM United States of America ADP Employment Change JUL 100K 157K
2:00 PM United States of America ISM Non-Manf. Composite JUL 54.0 53.3
2:00 PM United States of America Factory Orders JUN -0.6% 0.8%

Wednesday, August 03, 2011
10:45 PM New Zealand Statistics New Zealand on Jobless, Employment
10:45 PM New Zealand Participation Rate (QoQ) 2Q 68.4% 68.7%
10:45 PM New Zealand Employment Change (QoQ) 2Q 0.0% 1.4%
10:45 PM New Zealand Unemployment Rate 2Q 6.5% 6.6%
10:45 PM New Zealand Employment Change (YoY) 2Q 2.0% 1.8%
11:50 PM Japan Japan Buying Foreign Bonds jul-29 - - -?224.0B
11:50 PM Japan Japan Buying Foreign Stocks jul-29 - - ?61.7B
11:50 PM Japan Foreign Buying Japan Bonds jul-29 - - -?146.0B
11:50 PM Japan Foreign Buying Japan Stocks jul-29 - - ?2.3B
2:00 AM New Zealand Transport Minister Speaks at Conference
8:00 AM Norway Unemployment rate(AKU) MAY - - 3.4%
10:00 AM Germany Factory Orders YoY (nsa) JUN 6.8% 12.2%
10:00 AM Germany Factory Orders MoM (sa) JUN -0.2% 1.8%
11:00 AM United Kingdom Bank of England Monetary Policy Committee Decision
11:00 AM United Kingdom BOE Asset Purchase Target AUG 200B 200B
11:00 AM United Kingdom BOE ANNOUNCES RATES aug-04 0.50% 0.50%
11:45 AM European Union ECB Announces Interest Rates aug-04 1.50% 1.50%
12:00 PM United States of America RBC Consumer Outlook Index AUG - - 43.7 12:30 PM European Union Trichet Speaks at ECB Monthly News Conference
12:30 PM United States of America Initial Jobless Claims jul-30 - - 398K
12:30 PM United States of America Continuing Claims jul-23 - - 3703K
1:45 PM United States of America Bloomberg Consumer Comfort jul-31 - - -46.8

Thursday, August 04, 2011 10:00 PM New Zealand Finance Minister English Speaks
11:01 PM United Kingdom Lloyds Employment Confidence JUL - - -50
11:30 PM Australia AiG Perf of Construction Index JUL - - 35.8
5:00 AM Japan Coincident Index CI JUN P 108,7 106,3
5:00 AM Japan Leading Index CI JUN P 103,4 99,6
6:13 AM Switzerland Foreign Currency Reserves JUL - - 196.0B
6:45 AM France Trade Balance (Euros) JUN -6500M -7422M
7:00 AM Switzerland Foreign Currency Reserves JUL - - 196.0B
7:00 AM United Kingdom Halifax House Price 3Mths/Year JUL -2,80% -3,50%
7:00 AM United Kingdom Halifax House Prices sa (MoM) JUL 0,00% 1,20%
7:15 AM Switzerland CPI (MoM) JUL -0,60% -0,20%
7:15 AM Switzerland CPI (YoY) JUL 0,70% 0,60%
7:15 AM Switzerland CPI - EU Harmonised (MoM) JUL - - 0,00%
7:15 AM Switzerland CPI - EU Harmonised (YoY) JUL - - 0,60%
7:30 AM Sweden Service Production MoM SA JUN 0,70% 0,40%
7:30 AM Sweden Service Production YoY WDA JUN 5,20% 5,30%
7:30 AM Sweden Budget Balance JUL - - -20.4B
8:00 AM Italy Industrial Production sa (MoM) JUN 0,20% -0,60%
8:00 AM Norway Industrial Production SA MoM JUN 0,60% -2,70%
8:00 AM Italy Industrial Production wda(YoY) JUN 1,80% 1,80%
8:00 AM Norway Industrial Prod. WDAJ YOY JUN 2,00% -12,40%
8:00 AM Norway Ind Prod Manufacturing SA MoM JUN - - 2,40%
8:00 AM Italy Industrial Production nsa(YoY) JUN - - 4,90%
8:00 AM Norway Ind Prod Manufacturing WDA YoY JUN - - 5,60%
8:30 AM United Kingdom PPI Input NSA (MoM) JUL 0,70% 0,40%
8:30 AM United Kingdom PPI Input NSA (YoY) JUL 18,70% 17,00%
8:30 AM United Kingdom PPI Output n.s.a. (MoM) JUL 0,20% 0,10%
8:30 AM United Kingdom PPI Output n.s.a. (YoY) JUL 5,80% 5,70%
8:30 AM United Kingdom PPI Output Core NSA (MoM) JUL 0,20% 0,20%
8:30 AM United Kingdom PPI Output Core NSA (YoY) JUL 3,20% 3,20%
9:00 AM Italy GDP sa and wda (QoQ) 2Q P 0,30% 0,10%
9:00 AM Italy GDP sa and wda (YoY) 2Q P 0,80% 1,00%
10:00 AM Germany Industrial Prod. YoY (nsa wda) JUN 8,10% 7,60%
10:00 AM Germany Industrial Production MoM (sa) JUN 0,10% 1,20%
11:00 AM Canada Unemployment Rate JUL 7,40% 7,40%
11:00 AM Canada Net Change in Employment JUL 15.0K 28.4K
11:00 AM Canada Full Time Employment Change JUL - - 7,3
11:00 AM Canada Part Time Employment Change JUL - - 21,1
11:00 AM Canada Participation Rate JUL 67 66,9
12:30 PM Canada Building Permits MoM JUN -5,00% 20,90%
12:30 PM United States of America Change in Nonfarm Payrolls JUL 85K 18K
12:30 PM United States of America Change in Private Payrolls JUL 113K 57K
12:30 PM United States of America Change in Manufact. Payrolls JUL 10K 6K
12:30 PM United States of America Unemployment Rate JUL 9,20% 9,20%
12:30 PM United States of America Avg Hourly Earning MOM All Emp JUL 0,20% 0,00%
12:30 PM United States of America Avg Hourly Earning YOY All Emp JUL 1,90% 1,90%
12:30 PM United States of America Avg Weekly Hours All Employees JUL 34,3 34,3
12:30 PM United States of America Chg in Household Survey Emply JUL - - -445
2:00 PM Canada IVEY Purchasing Mangers NSA JUL 62 68,2
2:00 PM Canada Ivey Purchasing Managers Index SA JUL 61 59,9
7:00 PM United States of America Consumer Credit JUN $5.000B $5.077B

Friday, August 05, 2011
10:00 PM New Zealand Finance Minister English Speaks
11:01 PM United Kingdom Lloyds Employment Confidence
11:30 PM Australia AiG Perf of Construction Index
5:00 AM Japan Coincident Index CI
5:00 AM Japan Leading Index CI
6:13 AM Switzerland Foreign Currency Reserves
6:45 AM France Trade Balance (Euros)
7:00 AM Switzerland Foreign Currency Reserves
7:00 AM United Kingdom Halifax House Price 3Mths/Year
7:00 AM United Kingdom Halifax House Prices sa (MoM)
7:15 AM Switzerland CPI (MoM)
7:15 AM Switzerland CPI (YoY)
7:15 AM Switzerland CPI - EU Harmonised (MoM)
7:15 AM Switzerland CPI - EU Harmonised (YoY)
7:30 AM Sweden Service Production MoM SA
7:30 AM Sweden Service Production YoY WDA
7:30 AM Sweden Budget Balance
8:00 AM Italy Industrial Production sa (MoM)
8:00 AM Norway Industrial Production SA MoM
8:00 AM Italy Industrial Production wda(YoY)
8:00 AM Norway Industrial Prod. WDAJ YOY
8:00 AM Norway Ind Prod Manufacturing SA MoM
8:00 AM Italy Industrial Production nsa(YoY)
8:00 AM Norway Ind Prod Manufacturing WDA YoY
8:30 AM United Kingdom PPI Input NSA (MoM)
8:30 AM United Kingdom PPI Input NSA (YoY)
8:30 AM United Kingdom PPI Output n.s.a. (MoM)
8:30 AM United Kingdom PPI Output n.s.a. (YoY)
8:30 AM United Kingdom PPI Output Core NSA (MoM)
8:30 AM United Kingdom PPI Output Core NSA (YoY)
9:00 AM Italy GDP sa and wda (QoQ)
9:00 AM Italy GDP sa and wda (YoY)
10:00 AM Germany Industrial Prod. YoY (nsa wda)
10:00 AM Germany Industrial Production MoM (sa)
11:00 AM Canada Unemployment Rate
11:00 AM Canada Net Change in Employment
11:00 AM Canada Full Time Employment Change
11:00 AM Canada Part Time Employment Change
11:00 AM Canada Participation Rate
12:30 PM Canada Building Permits MoM
12:30 PM United States of America Change in Nonfarm Payrolls
12:30 PM United States of America Change in Private Payrolls
12:30 PM United States of America Change in Manufact. Payrolls
12:30 PM United States of America Unemployment Rate
12:30 PM United States of America Avg Hourly Earning MOM All Emp
12:30 PM United States of America Avg Hourly Earning YOY All Emp
12:30 PM United States of America Avg Weekly Hours All Employees
12:30 PM United States of America Chg in Household Survey Emply
2:00 PM Canada IVEY Purchasing Mangers NSA
2:00 PM Canada Ivey Purchasing Managers Index SA
7:00 PM United States of America Consumer Credit

Results for the week of: 22/07/2011 - 28/07/2011
22 July 2011 - 28 July 2011

* GMT Time

GMT Country/Event Actual Cons. Previous Vol.

Jul 22

12:30 Canada
Retail Sales ex Autos (MoM) (May)
0.5% 0.2% 0.0% 2

12:30 Canada
Retail Sales (MoM) (May)
0.1% -0.3% 0.3% 1

Jul 25

01:30 Australia
Producer Price Index (YoY) (Q2)
3.4% 3.1% 2.9% 2

01:30 Australia
Producer Price Index (QoQ) (Q2)
0.8% 0.6% 1.2% 2

02:30 Japan
BoJ's Governor Shirakawa Speech
2

08:30 United Kingdom
BBA Mortgage Approvals (Jun)
31.3K 30.5K 1

22:45 New Zealand
Trade Balance (Jun)
404M 605M 2

23:50 Japan
Corporate Service Price (YoY) (Jun)
-0.9% -0.9% 1

Jul 26

00:00 Australia
Conference Board Australia Leading Index (May)
0.1% 2

06:00 Switzerland
UBS Consumption Indicator (Jun)
1.91 2

06:00 Germany
Gfk Consumer Confidence Survey (Aug)
5.6 5.7 1

08:30 United Kingdom
Index of Services (3M/3M) (May)
0.9% 0.9% 1

08:30 United Kingdom
Gross Domestic Product (YoY) (Q2) Preliminar
0.8% 1.6% 2

08:30 United Kingdom
Gross Domestic Product (QoQ) (Q2) Preliminar
0.2% 0.5% 2

13:00 United States
S&P/Case-Shiller Home Price Indices (YoY) (May)
-4.6% -4.0% 1

14:00 United States
New Home Sales (Jun)
0.321M 0.319M 2

14:00 United States
Richmond Fed Manufacturing Index (Jul)
5 3 2

14:00 United States
Consumer Confidence (Jul)
57.9 58.5 2

14:00 United States
New Home Sales (MoM) (Jun)
0.3% -2.1% 2

Jul 27
01:00 New Zealand
Business Confidence (Jul) 46.5 2

01:30 Australia
Consumer Price Index (YoY) (Q2)
3.4% 3.3% 3

01:30 Australia
Consumer Price Index (QoQ) (Q2)
0.7% 1.6% 2

06:00 Germany
Consumer Price Index (YoY) (Jul) Preliminar
2.3% 2.3% 2

06:00 Germany
Consumer Price Index (MoM) (Jul) Preliminar
0.3% 0.1% 2

08:00 European Monetary Union
M3 Money Supply (3m) (Jun)
2.3% 2.2% 2

08:00 European Monetary Union
M3 Money Supply (YoY) (Jun)
2.4% 2.4% 2

09:30 Switzerland
KOF Leading Indicator (Jul)
2.13 2.23 2

10:00 United Kingdom
CBI Industrial Trends Survey - Orders (MoM) (Jul)
-3% 1% 1

11:00 United States
MBA Mortgage Applications (Jul 22)
15.5% 1

12:30 United States
Durable Goods Orders ex Transportation (Jun)
0.5% 0.6% 2

12:30 United States
Durable Goods Orders (Jun)
0.4% 1.9% 2

14:30 United States
EIA Crude Oil Stocks change (Jul 22)
-3.7M 1

18:00 United States
Fed's Beige Book
2

21:00 New Zealand
RBNZ Interest Rate Decision (Jul 28)
2.5% 2.5% 3

23:50 Japan
Retail Trade (YoY) (Jun)
-0.5% -1.3% 2

23:50 Japan
Large Retailer's Sales (Jun)
-0.4% -2.4% 2

23:50 Japan
Retail Trade s.a (MoM) (Jun)
1.5% 2.4% 1

Jul 28

07:55 Germany
Unemployment Rate s.a. (Jul)
7% 7% 2

07:55 Germany
Unemployment Change (Jul)
16K -8K 3

09:00 European Monetary Union
Economic Confidence (Jul)
104.0 105.1 1

09:00 European Monetary Union
Industrial Confidence (Jul)
2.0 3.2 1

09:00 European Monetary Union
Consumer Confidence (Jul)
-11.4 -9.8 2

10:00 United Kingdom
CBI Distributive Trades Survey - Realized (MoM) (Jul)
2% -2% 1

12:30 United States
Continuing Jobless Claims (Jul 16)
3.698M 1

12:30 United States
Initial Jobless Claims (Jul 22)
412K 418K 1

14:00 United States
Pending Home Sales (MoM) (Jun)
-1.0% 8.2% 1

22:45 New Zealand
Building Permits s.a. (MoM) (Jun)
3.0% 2.2% 1

23:01 United Kingdom
Gfk Consumer Confidence (Jul)
-26 -25 2

23:15 Japan
Nomura/ JMMA Manufacturing Puchasing Manager Index (Jul)
50.7 2

23:30 Japan
Tokyo CPI ex Food, Energy (YoY) (Jul)
0.1% 0.1% 2

23:30 Japan
Tokyo Consumer Price Index (YoY) (Jul)
0.0% -0.2% 1

23:30 Japan
Unemployment Rate (Jun)
4.6% 4.5% 2

23:30 Japan
Tokyo CPI ex Fresh Food (YoY) (Jul)
0.2% 0.1% 1

23:30 Japan
National CPI Ex Food, Energy (YoY) (Jun)
0.1% 0.1% 2

23:30 Japan
National Consumer Price Index (YoY) (Jun)
0.2% 0.3% 2

23:30 Japan
Overall Household Spending (YoY) (Jun)
-2.2% -1.9% 2

23:30 Japan
National CPI Ex-Fresh Food (YoY) (Jun)
0.5% 0.6% 2

23:50 Japan
Industrial Production (YoY) (Jun) Preliminar
-1.2% -5.5% 2

23:50 Japan
Industrial Production (MoM) (Jun) Preliminar
4.5% 6.2% 1

Jul 29 01:30 Australia
Private Sector Credit (YoY) (Jun)
3.2% 3.1% 2

01:30 Australia
Private Sector Credit (MoM) (Jun)
0.4% 0.3% 2

03:00 New Zealand
M3 Money Supply (YoY) (Jun)
-2% 1

04:00 Japan
Vehicle Production (YoY) (Jun)
-6.3% 1

05:00 Japan
Housing Starts (YoY) (Jun)
4.6% 6.4% 2

05:00 Japan
Annualized Housing Starts (Jun)
0.809M 0.815M 2

06:00 Germany
Retail Sales (MoM) (Jun)
1.6% -2.8% 1

06:00 Germany
Retail Sales (YoY) (Jun)
2.2% 2

06:00 United Kingdom
Nationwide Housing Prices s.a (MoM) (Jul)
-0.2% 0.0% 1

06:00 United Kingdom
Nationwide Housing Prices n.s.a (YoY) (Jul)
-0.8% -1.1% 2

08:30 United Kingdom
Mortgage Approvals (Jun)
46.00K 45.94K 2

08:30 United Kingdom
Consumer Credit (Jun)
£0.3B £0.2B 2

08:30 United Kingdom
M4 Money Supply (MoM) (Jun)
0.3% 0.1% 1

08:30 United Kingdom
M4 Money Supply (YoY) (Jun)
0.3% -0.2% 1

09:00 European Monetary Union
Consumer Price Index (YoY) (Jul) Preliminar
2.7% 2.7% 2

12:30 Canada
Raw Material Price Index (Jun)
1.4% -5.2% 1

12:30 Canada
Industrial Product Price (MoM) (Jun)
0.4% -0.2% 1

12:30 United States
Real Personal Consumption Expenditures (QoQ) (Q2) Preliminar
1.0% 2.2% 2

12:30 Canada
Gross Domestic Product (MoM) (May)
0.1% 0.0% 2

12:30 United States
Gross Domestic Product Annualized (Q2)
1.6% 1.9% 2

12:30 United States
Gross Domestic Purchases Price Index (Q2) Preliminar
2.0% 3.9% 2

13:45 United States
Chicago Purchasing Managers' Index (Jul)
60.2 61.1 2

13:55 United States
Reuters/Michigan Consumer Sentiment Index (Jul)
64.1 71.5 1

Results for the week of: 17/07/2011 - 22/07/2011
17 July 2011 - 22 July 2011

* GMT Time

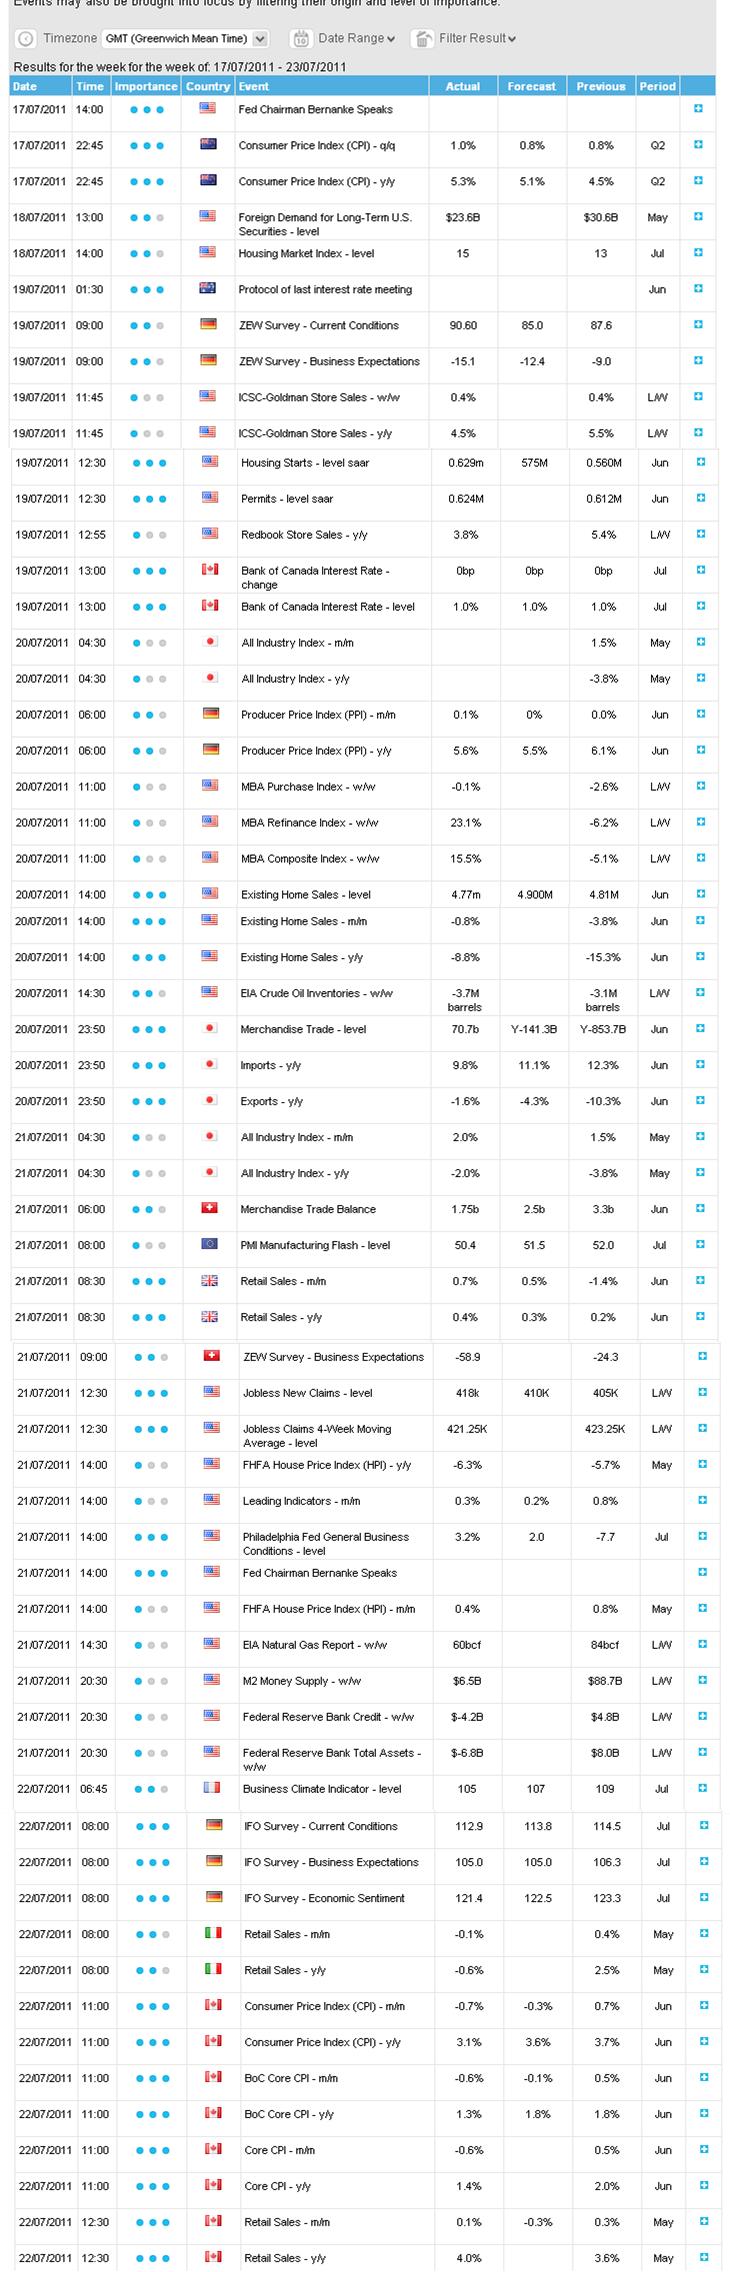
Results for the week of: 10/07/2011 - 15/07/2011
10 July 2011 - 15 July 2011

* GMT Time

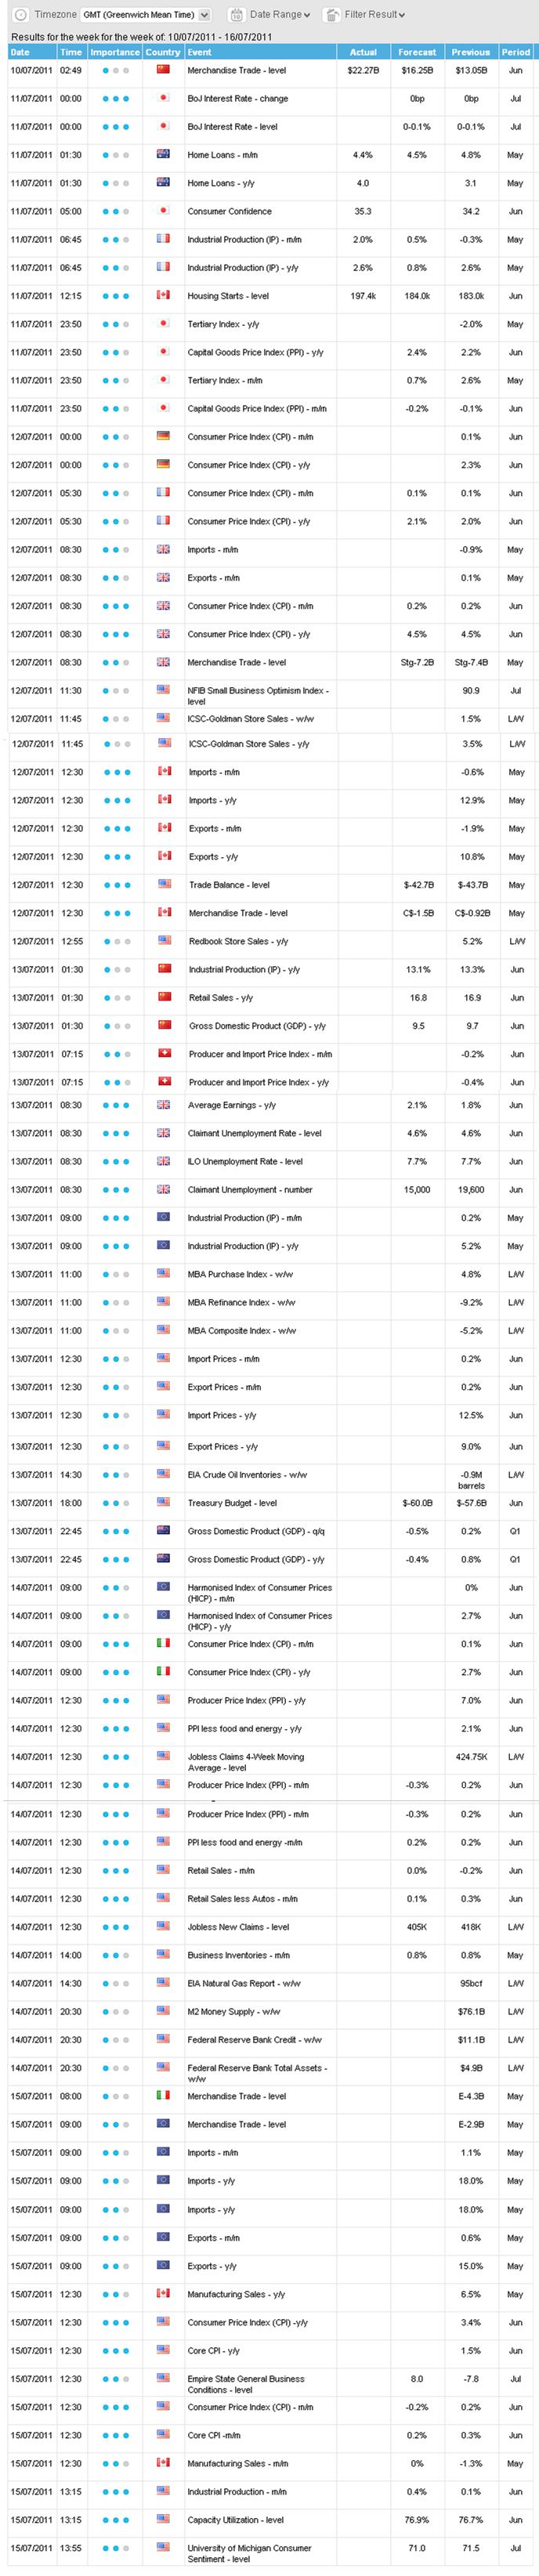
Results for 4 July 2011 - 8 July 2011
* GMT Time

GMT Country/Event Actual Cons. Previous Vol.


Jul 05 07:55
Germany
Purchasing Manager Index Services (Jun) 56.7 58.3 56.1 2

08:00
European Monetary Union
Purchasing Manager Index Services (Jun) 53.7 54.2 56.0 2

08:30
United Kingdom
Purchasing Manager Index Services (Jun) 53.9 53.5 53.8 2

09:00
European Monetary Union
Retail Sales (YoY) (May) -1.9% -0.6% 0.8%Revised from 0.8% 2

09:00
European Monetary Union
Retail Sales (MoM) (May) -1.1% -1.0% 0.7%Revised from 0.8% 1

14:00
United States
Factory Orders (May) 0.8% 1.0% -0.9%Revised from -1.2% 2

23:01
United Kingdom
BRC Shop Price Index (MoM) (Jun) 2.3% 1

Jul 06

05:00
Japan
Leading Economic Index (May) Preliminar 99.8 96.2 1

05:00
Japan
Coincident Index (May) Preliminar 106.1 103.6 1

09:00
European Monetary Union
Gross Domestic Product s.a. (YoY) (Q1) 2.5% 2.5% 2

09:00
European Monetary Union
Gross Domestic Product s.a. (QoQ) (Q1) 0.8% 0.8% 2

10:00
Germany
Factory Orders n.s.a. (YoY) (May) 9.8% 7.2% 2

10:00
Germany
Factory Orders s.a. (MoM) (May) -0.5% 2.8% 2

11:00
United States
MBA Mortgage Applications (Jul 1) -2.7% 1

12:30
Canada
Building Permits (MoM) (May) 5.0% -21.1% 1

14:00
United States
ISM Non-Manufacturing (Jun) 53.5 54.6 2

22:45
New Zealand
Gross Domestic Product (YoY) (Q1) 0.5% 1.5% 2

22:45
New Zealand
Gross Domestic Product (QoQ) (Q1) 0.3% 0.2% 2

23:30
Australia
AiG Performance of Construction Index (Jun) 39.6 2

23:50
Japan
Core Machinery Orders (MoM) (May) 3.0% -3.3% 1

Jul 07

01:30
Australia
Unemployment Rate s.a. (Jun) 4.9% 4.9% 3

01:30
Australia
Employment Change s.a. (Jun) 15.3K 7.8K 3

07:15
Switzerland
Consumer Price Index (YoY) (Jun) 0.4% 2

07:15
Switzerland
Consumer Price Index (MoM) (Jun) -0.1% 0.0% 2

08:30
United Kingdom
Industrial Production (YoY) (May) -0.6% -1.2% 2

08:30
United Kingdom
Manufacturing Production (YoY) (May) -0.6% 1.3% 2

08:30
United Kingdom
Manufacturing Production (MoM) (May) 1.0% -1.5% 1

08:30
United Kingdom
Industrial Production (MoM) (May) 1.0% -1.7% 1

10:00
Germany
Industrial Production s.a. w.d.a. (YoY) (May) 7.0% 9.6% 2

10:00
Germany
Industrial Production s.a. (MoM) (May) 0.8% -0.6% 2

11:00
United Kingdom
BoE Asset Purchase Facility (Jul 7) £200B £200B 3

11:00
United Kingdom
BoE Interest Rate Decision (Jul 7) 0.5% 0.5% 3

11:45
European Monetary Union
ECB Interest Rate Decision (Jul 7) 1.50% 1.25% 3

12:15
United States
ADP Employment Change (Jun) 70K 38K 2

12:30
United States
Continuing Jobless Claims (Jun 25) 3.700M 3.702M 1

12:30
Canada
New Housing Price Index (MoM) (May) 0.2% 0.3% 1

12:30
European Monetary Union
ECB Press Conference 3

12:30
United States
Initial Jobless Claims (Jul 1) 421K 428K 1

14:00
Canada
Ivey Purchasing Managers Index (Jun) 62.5 69.1 2

15:00
United States
EIA Crude Oil Stocks change (Jul 1) -4.4M 1

23:50
Japan
Trade Balance - BOP Basis (May) ¥-764.0B ¥-417.5B 2

23:50
Japan
Money Supply M2+CD (YoY) (May) 2.8% 2.7% 1

23:50
Japan
Current Account n.s.a. (May) ¥388.0B ¥405.6B 1

Jul 08

05:00
Japan
Eco Watchers Survey: Outlook (Jun) 44.9 2

05:00
Japan
Eco Watchers Survey: Current (Jun) 40.1 36.0 2

05:45
Switzerland
Unemployment Rate n.s.a (MoM) (Jun) 3.0% 2.9% 2

06:00
Germany
Trade Balance s.a. (May) EUR12.2B EUR12.0B 2

06:00
Germany
Current Account n.s.a. (May) EUR7.0B EUR8.8B 2

08:30
United Kingdom
Producer Price Index - Input (YoY) n.s.a (Jun) 16.1% 15.7% 2

08:30
United Kingdom
Producer Price Index - Output (MoM) n.s.a (Jun) 0.1% 0.2% 1

08:30
United Kingdom
Producer Price Index - Output (YoY) n.s.a (Jun) 5.5% 5.3% 2

08:30
United Kingdom
Producer Price Index - Input (MoM) n.s.a (Jun) -0.1% -2.0% 1

11:00
Canada
Unemployment Rate (Jun) 7.4% 7.4% 3

11:00
Canada
Net Change in Employment (Jun) 11.3K 22.3K 3

12:30
United States
Average Weekly Hours (Jun) 34.4 34.4 1

12:30
United States
Unemployment Rate (Jun) 9.0% 9.1% 3

12:30
United States
Average Hourly Earnings (MoM) (Jun) 0.2% 0.3% 2

12:30
United States
Average Hourly Earnings (YoY) (Jun) 2.0% 1.8% 2

12:30
United States
Nonfarm Payrolls (Jun) 90K 54K 3

14:00
United States
Wholesale Inventories (May) 0.7% 0.8% 2

19:00
United States
Consumer Credit Change (May) $6.00B $6.25B 2 Results for 26 June 2011 - 1 July 2011
* GMT Time

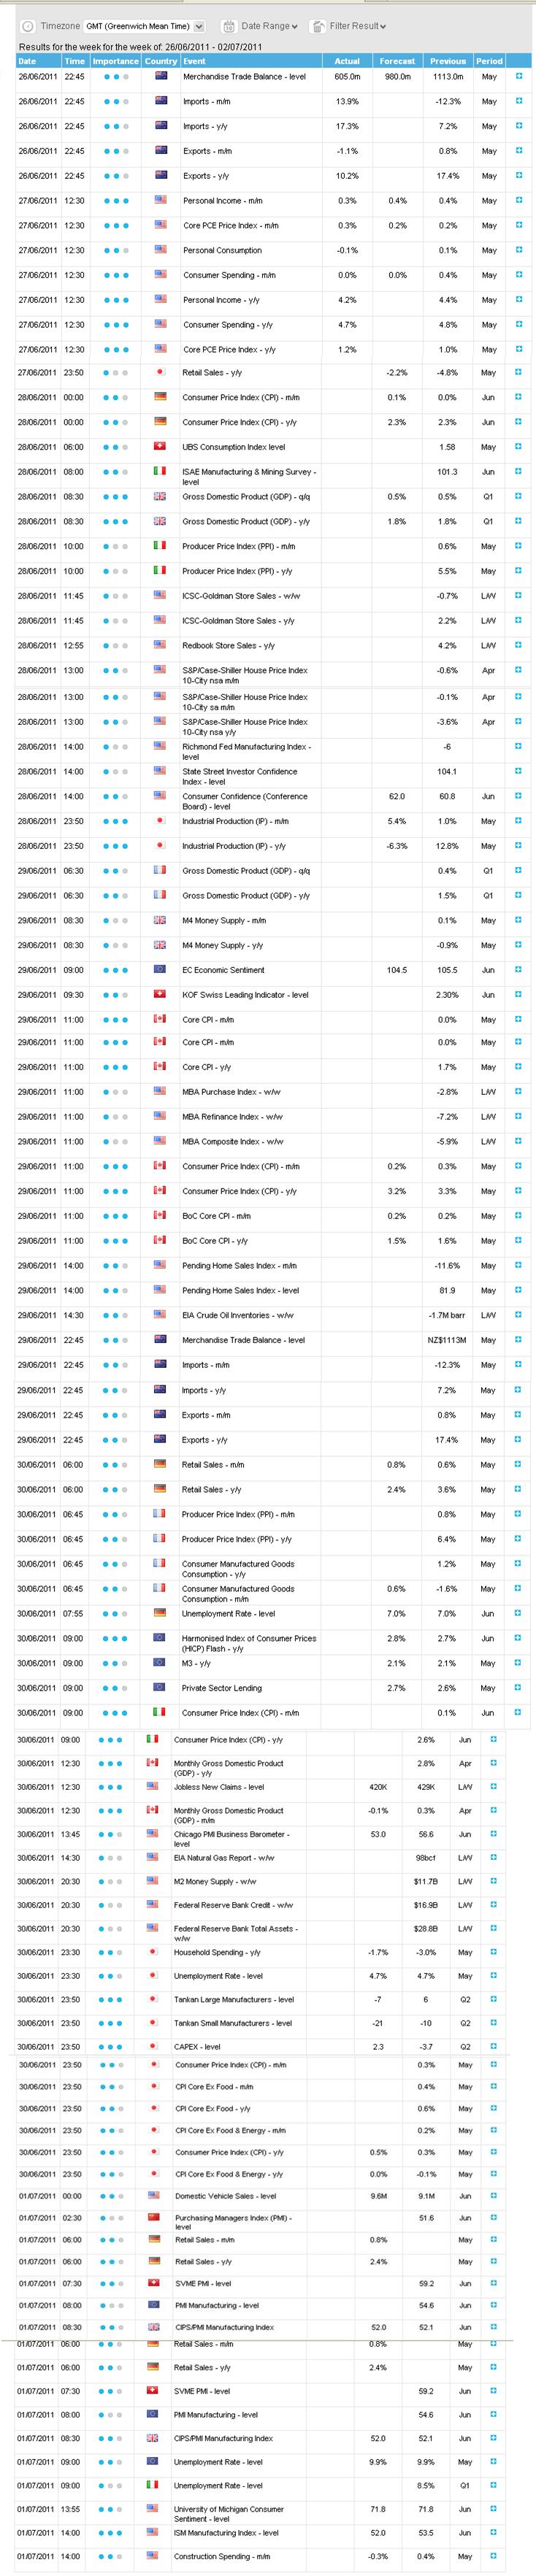
Results for 19 June 2011 - 24 June 2011
* GMT Time

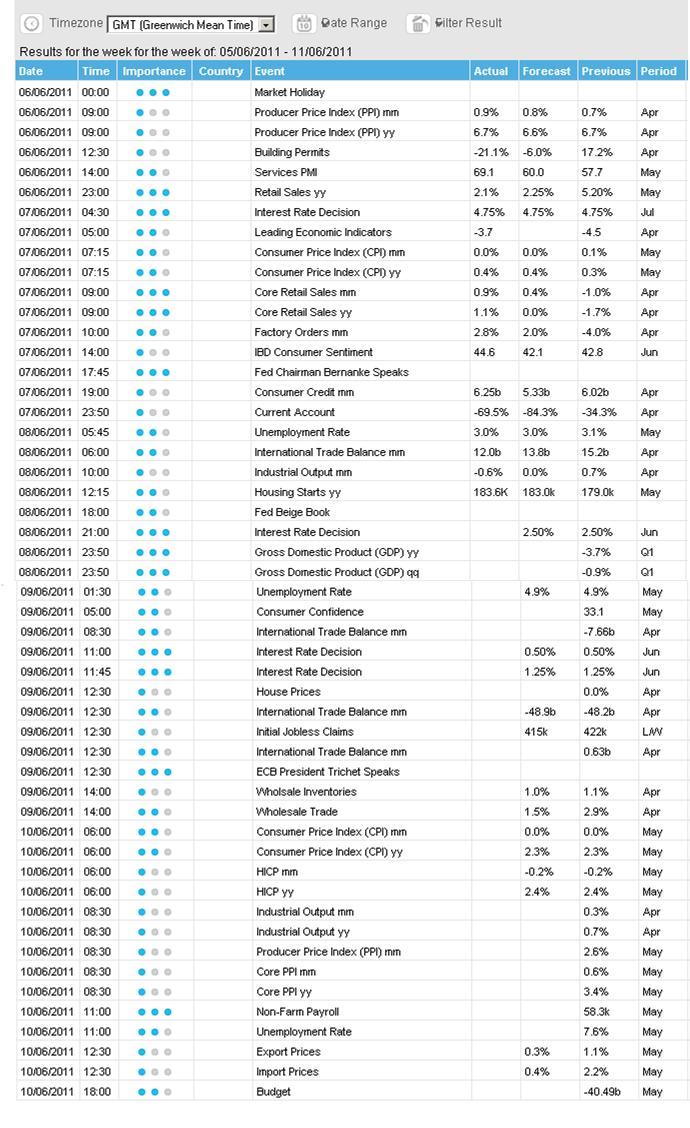
Results for 12 June 2011 - 17 June 2011


Date Time Country Event For Forecast Actual Previous

June 12, 2011 4:50 pm EDT JP Mach ord y/y Apr 5 - 6.8
June 12, 2011 4:50 pm EDT JP Machinery orders mm Apr 2.2 - 2.9
June 13, 2011 12:00 am EDT AT Mrkt Holiday - - - -
June 13, 2011 12:00 am EDT AU Mrkt Holiday - - - -
June 13, 2011 12:00 am EDT CH Mrkt Holiday - - - -
June 13, 2011 12:00 am EDT DK Mrkt Holiday - - - -
June 13, 2011 12:00 am EDT GR Mrkt Holiday - - - -
June 13, 2011 12:00 am EDT NO Mrkt Holiday - - - -
June 13, 2011 12:00 am EDT NZ REINZ HPI mm Jun - - 1.1
June 13, 2011 12:00 am EDT NZ REINZ HPI Year ago Jun - - -0.4
June 13, 2011 12:00 am EDT RU Mrkt Holiday - - -
June 13, 2011 12:00 am EDT TR Current account balance Apr -7.55 - -9.766
June 13, 2011 1:00 am EDT IT Industrial output mm sa Apr 0.1 - 0.4
June 13, 2011 1:00 am EDT IT Industrial output yy WDA Apr 2.4 - 3.1
June 13, 2011 3:45 pm EDT NZ Food price index May - - 0.1
June 13, 2011 4:01 pm EDT GB RICS Housing Survey May -20 - -21
June 13, 2011 4:50 pm EDT JP Business survey index Q2 - - -3.2
June 14, 2011 12:00 am EDT ES CPI mm May -0.2 - 1.2
June 14, 2011 12:00 am EDT ES CPI yy May 3.5 - 3.8
June 14, 2011 12:00 am EDT ES HICP mm May -0.1 - 0.9
June 14, 2011 12:00 am EDT ES HICP yy May 3.4 - 3.4
June 14, 2011 12:30 am EDT SE CPI mm May - - 0.4
June 14, 2011 12:30 am EDT SE CPI yy May - - 3.3
June 14, 2011 12:30 am EDT SE CPIF mm May - - 0.4
June 14, 2011 12:30 am EDT SE CPIF yy May - - 1.8
June 14, 2011 1:30 am EDT GB CPI mm May 0.2 - 1
June 14, 2011 1:30 am EDT GB CPI yy May 4.5 - 4.5
June 14, 2011 1:30 am EDT GB RPI mm May 0.3 - 0.8
June 14, 2011 1:30 am EDT GB RPI yy May 5.1 - 5.2
June 14, 2011 1:30 am EDT GB RPI-X (retail prices) mm May 0.4 - 0.9
June 14, 2011 1:30 am EDT GB RPIX yy May 5.2 - 5.3
June 14, 2011 4:45 am EDT US ICSC chain stores ww w/e - -0.8 0.4
June 14, 2011 4:45 am EDT US ICSC chain stores yy w/e - 2.4 2.5
June 14, 2011 5:30 am EDT US Retail sales mm May -0.4 -0.2 0.5
June 14, 2011 5:30 am EDT US Producer prices mm May 0.1 0.2 0.8
June 14, 2011 5:30 am EDT US Producer prices, core mm May 0.2 0.2 0.3
June 14, 2011 5:30 am EDT US Retail sales ex-autos mm May 0.3 0.3 0.6
June 14, 2011 5:30 am EDT US Producer prices, core yy May 2.1 2.1 2.1
June 14, 2011 5:30 am EDT US PPI inflation yy, NSA May 6.8 7.3 6.8
June 14, 2011 5:30 am EDT CA Capacity utilization Q1 77.2 79 76.4
June 14, 2011 5:55 am EDT US Redbook mm w/e - 0.8 1.3
June 14, 2011 5:55 am EDT US Redbook yy w/e - 3.2 4.2
June 14, 2011 7:00 am EDT US Business inventories mm Apr 0.9 0.8 1
June 14, 2011 3:45 pm EDT NZ Retail Sales QQ Q1 0.5 0.9 -0.4
June 14, 2011 3:45 pm EDT NZ Retail qrtly vs yr ago Q1 1.1 3.4 1.5
June 14, 2011 4:01 pm EDT GB Nationwide Consumer Conf May - 55 43
June 14, 2011 6:30 pm EDT AU NAB Business Conditions May - - 5
June 14, 2011 6:30 pm EDT AU NAB Business Confidence May - - 7
June 14, 2011 8:00 pm EDT NZ RBNZ offshore holdings May - - 57.5
June 14, 2011 8:30 pm EDT JP BOJ rate decision Jun - 0 0.1
June 14, 2011 9:30 pm EDT JP Capacity util idx chg mm Apr - - -21.5
June 14, 2011 9:30 pm EDT JP Industrial output rev Apr - - 1
June 14, 2011 11:00 pm EDT FI CPI yy May - - 3.2
June 14, 2011 11:45 pm EDT FR Current account Apr - - -4.1
June 15, 2011 12:00 am EDT FI Current account Apr - -0.8 -0.3
June 15, 2011 12:00 am EDT TR 3mth qtly jobless avg Mar - 10.8 11.5
June 15, 2011 12:15 am EDT CH Producer/import price yy May -0.2 -0.4 0.1
June 15, 2011 12:15 am EDT CH Producer/import price mm May 0 -0.2 0.3
June 15, 2011 12:30 am EDT NL Trade Balance mm Apr - 3.89 3.46
June 15, 2011 1:00 am EDT TR Budget balance May - 2.835 1.056
June 15, 2011 1:00 am EDT NO Trade balance May - 24.2 39.2
June 15, 2011 1:30 am EDT GB Avg wk Earnings 3mth yy Apr 2.1 1.8 2.3
June 15, 2011 1:30 am EDT GB Avg Earnings (ex-bonus) Apr 2.05 2 2.1
June 15, 2011 1:30 am EDT GB ILO unemployment rate Apr 7.7 7.7 7.7
June 15, 2011 1:30 am EDT GB Claimant count unem chng May 7 19.6 12.4
June 15, 2011 2:00 am EDT EZ Industrial production mm Apr -0.2 0.2 -0.2
June 15, 2011 2:00 am EDT EZ Industrial production yy Apr 4.9 5.2 5.3
June 15, 2011 4:00 am EDT US MBA Purchase: change w/e - 4.5 -4.4
June 15, 2011 4:00 am EDT US MBA 30-yr mortgage rate w/e - 4.51 4.54
June 15, 2011 4:00 am EDT US Mortgage market: change w/e - 13 -0.4
June 15, 2011 4:00 am EDT US Refinancing: change w/e - 16.5 1.3
June 15, 2011 4:00 am EDT US MBA Purchase Index w/e - 191.1 182.9
June 15, 2011 4:00 am EDT US Mortgage market index w/e - 584.6 517.5
June 15, 2011 4:00 am EDT US Mortgage refinance index w/e - 2883.7 2475.7
June 15, 2011 5:30 am EDT US NY Fed manufacturing Jun 12.5 -7.79 11.88
June 15, 2011 5:30 am EDT CA Manufacturing sales mm Apr -1.3 -1.3 1.9
June 15, 2011 5:30 am EDT US Real weekly earnings mm May - 0.1 -0.3
June 15, 2011 5:30 am EDT US CPI mm, sa May 0.1 0.2 0.4
June 15, 2011 5:30 am EDT US Core CPI mm, sa May 0.2 0.3 0.2
June 15, 2011 5:30 am EDT US Core CPI yy, nsa May 1.4 1.5 1.3
June 15, 2011 5:30 am EDT US CPI yy, nsa May 3.4 3.6 3.2
June 15, 2011 5:30 am EDT US Core CPI index, sa May - 224.39 223.75
June 15, 2011 5:30 am EDT US CPI index, nsa May 225.49 225.96 224.91
June 15, 2011 6:00 am EDT US Net L-T flows,incl.swaps Apr - 18.9 11.7
June 15, 2011 6:00 am EDT US Foreign buying, T-bonds Apr - 23.3 26.8
June 15, 2011 6:00 am EDT US Net L-T flows,exswaps Apr - 30.6 24
June 15, 2011 6:00 am EDT US Overall net capital flows Apr - 68.2 116
June 15, 2011 6:15 am EDT US Industrial output mm May 0.2 0.1 0
June 15, 2011 6:15 am EDT US Capacity utilization mm May 77 76.7 76.9
June 15, 2011 7:00 am EDT US NAHB housing market indx Jun 16 13 16
June 15, 2011 8:30 am EDT US Cleveland Fed CPI May - 0.2 0.2
June 15, 2011 3:00 pm EDT NZ Westpac consumer survey Q2 - 112 97.9
June 15, 2011 4:01 pm EDT GB Nationwide Consumer Conf May - 55 43
June 15, 2011 4:30 pm EDT JP Reuters Tankan DI Jun - -3 -9
June 15, 2011 4:50 pm EDT JP Foreign invest JP stock w/e - -76.8 8.6
June 15, 2011 4:50 pm EDT JP Foreign bond investment w/e - 239.5 -1187.1
June 15, 2011 5:30 pm EDT AU Consumer sentiment Jun - -2.6 -1.3
June 15, 2011 6:30 pm EDT AU Dwelling Unit Starts Q1 - 3.1 -5.3
June 15, 2011 10:30 pm EDT FR CPI (EU norm) final mm F May 0.2 0.1 0.4
June 15, 2011 10:30 pm EDT FR Inflation ex-tobacco m F May - 0.1 0.4
June 15, 2011 10:30 pm EDT FR CPI (EU norm) final yy F May 2.2 2.2 2.2
June 16, 2011 12:00 am EDT RU PPI mm May 1.5 1.2 2
June 16, 2011 12:00 am EDT RU PPI yy May - 19.2 20.2
June 16, 2011 12:00 am EDT TR Consumer confidence Jun - 92.85 93.46
June 16, 2011 12:00 am EDT RU Cbank reserves 1st wk $ w/e - 528 522.8
June 16, 2011 12:15 am EDT CH Industrial orders yy Q1 6 4.4 6
June 16, 2011 12:30 am EDT CH 3M target LIBOR rate Q2 0.25 0.25 0.25
June 16, 2011 12:30 am EDT NL Retail Sales yy Apr - 3.4 1.2
June 16, 2011 1:00 am EDT AT Austrian HICP m/m May 0 -0.1 0.6
June 16, 2011 1:00 am EDT IT Consumer prices final mm May 0.1 0.1 0.1
June 16, 2011 1:00 am EDT IT CPI (EU-norm) final mm May 0.2 0.2 0.2
June 16, 2011 1:00 am EDT IT Consumer prices final yy May 2.6 2.6 2.6
June 16, 2011 1:00 am EDT IT CPI (EU norm) final yy May 3 3 3
June 16, 2011 1:00 am EDT AT Austrian HICP y/y May 3.8 3.7 3.7
June 16, 2011 1:30 am EDT GB Retail Sales Ex Fuel mm May -0.6 -1.6 1.2
June 16, 2011 1:30 am EDT GB Retail sales mm May -0.6 -1.4 1.1
June 16, 2011 1:30 am EDT GB Retail Sales Ex Fuel yy May 1.8 0 2.7
June 16, 2011 1:30 am EDT GB Retail sales yy May 1.5 0.2 2.8
June 16, 2011 2:00 am EDT EZ Employment qq Q1 - 0 0.1
June 16, 2011 2:00 am EDT EZ Infl exEnerFoodAlcTob mm May - 0 0.5
June 16, 2011 2:00 am EDT EZ Inflation ex-tobacco mm May - 0 0.6
June 16, 2011 2:00 am EDT EZ Inflation, final mm May 0 0 0.6
June 16, 2011 2:00 am EDT EZ Employment yy Q1 - 0.1 0.3
June 16, 2011 2:00 am EDT EZ Infl ex food & energy mm May 0.1 0.1 0.5
June 16, 2011 2:00 am EDT EZ Infl exEnerFoodAlcTob yy May - 1.5 1.6
June 16, 2011 2:00 am EDT EZ Infl ex food & energy yy May 1.6 1.7 1.8
June 16, 2011 2:00 am EDT EZ Inflation, ex-tobacco yy May - 2.7 2.8
June 16, 2011 2:00 am EDT EZ Inflation, final yy May 2.7 2.7 2.7
June 16, 2011 2:00 am EDT GR Unemployment (qtr) Q1 - 15.9 14.2
June 16, 2011 5:00 am EDT RU Industrial output May 4.2 4.1 4.5
June 16, 2011 5:30 am EDT US Current account Q1 -126 -119.3 -113.3
June 16, 2011 5:30 am EDT US Housing starts number mm May 0.54 0.56 0.523
June 16, 2011 5:30 am EDT US Building permits: number May 0.558 0.612 0.563
June 16, 2011 5:30 am EDT CA Securities Cdns C$ mm Apr - 3.31 1.73
June 16, 2011 5:30 am EDT US House starts mm: change May - 3.5 -10.6
June 16, 2011 5:30 am EDT US Continued jobless claims w/e 3.65 3.675 3.676
June 16, 2011 5:30 am EDT CA Securities foreign C$ mm Apr - 8.22 6.34
June 16, 2011 5:30 am EDT US Build permits: change mm May - 8.7 -1.9
June 16, 2011 5:30 am EDT US Initial jobless claims w/e 420 414 427
June 16, 2011 5:30 am EDT US Jobless claims 4-wk avg w/e - 424.75 424
June 16, 2011 7:00 am EDT US Phil Fed business index Jun 6.8 -7.7 3.9
June 16, 2011 3:00 pm EDT US SEMI book/bill ratio May - 0.97 0.98
June 17, 2011 1:00 am EDT IT Global trade balance Apr - -3.761 -3.943
June 17, 2011 1:00 am EDT IT Trade balance EU Apr - -0.686 -1.079
June 17, 2011 1:00 am EDT AT PPI m/m Apr - 0.6 0.7
June 17, 2011 1:00 am EDT AT PPI y/y Apr - 5.1 5.4
June 17, 2011 2:00 am EDT EZ Eurostat trade nsa, EUR Apr -2.1 -4.1 2.8
June 17, 2011 5:00 am EDT RU Industrial output May 4.2 - 4.5
June 17, 2011 5:30 am EDT CA Wholesale trade mm Apr -0.2 -0.1 0.1
June 17, 2011 7:00 am EDT US Leading index chg mm May 0.2 0.8 -0.3
June 17, 2011 7:30 am EDT US ECRI weekly annualized w/e - 3.7 4.1
June 17, 2011 7:30 am EDT US ECRI weekly index w/e - 127.8 127.7
June 17, 2011 11:00 pm EDT FI Export prices yy May - 5.9 7.1
June 17, 2011 11:00 pm EDT FI PPI yy May - 6.6 7.3
June 17, 2011 11:00 pm EDT FI Import prices yy May - 7.5 9.6

Results for 6 June 2011 - 10 June 2011
* GMT Time

Results for 29 May 2011 - 3 June 2011
* GMT Time

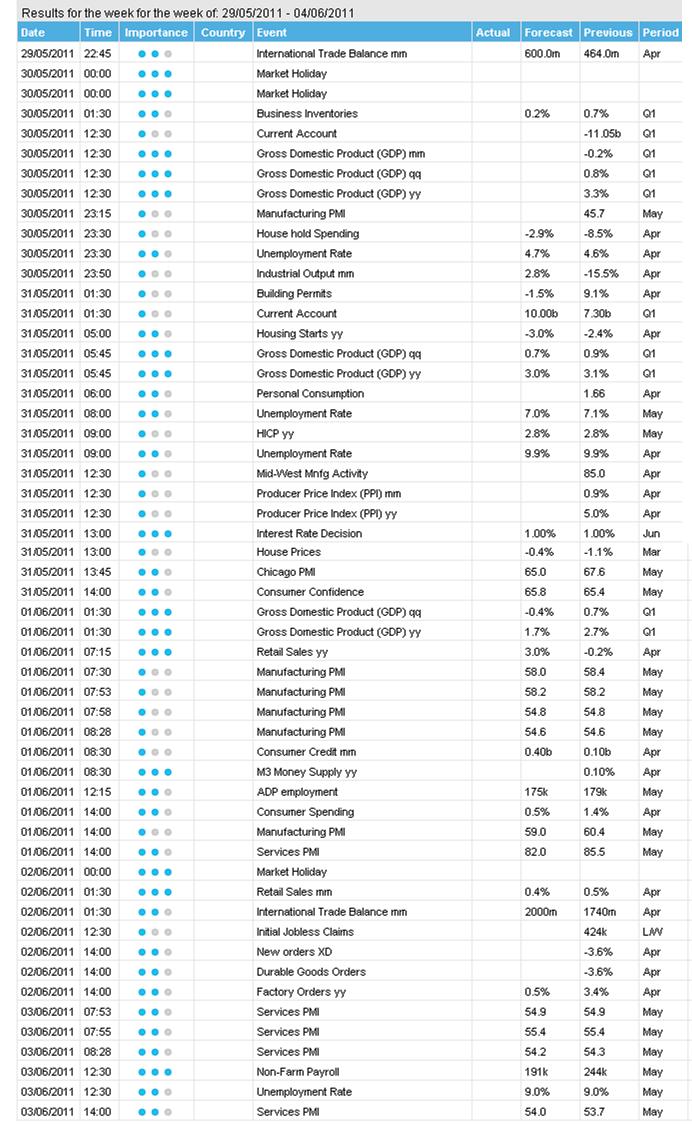
Results for 22 May 2011 - 28 May 2011
* GMT Time


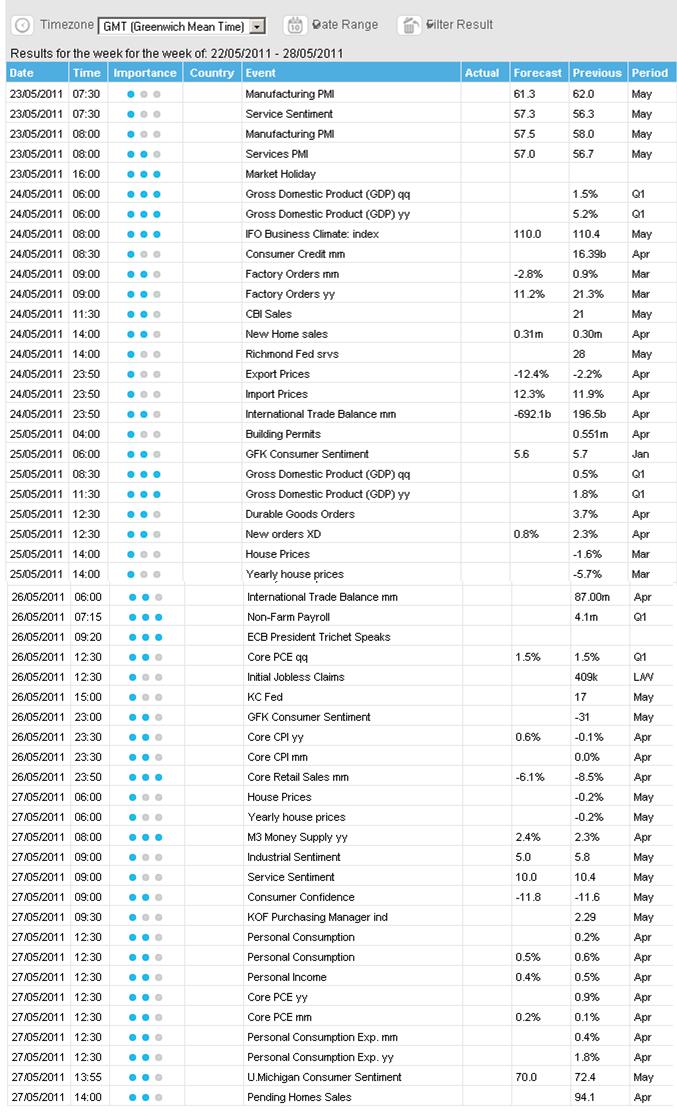
Results for 15 May 2011 - 20 May 2011
* GMT Time

Date GMT Country/ Currency Event Forecast Previous


Sun 15 May 2011
SUN 23:50 JPY Domestic Corporate Goods Price Index (YoY) 2.10% 2.00%
SUN 23:50 JPY Machine Orders (YoY) -8.00% 7.60%
SUN 01:30 AUD Home Loans 2.00% -5.60%


Mon 16 May 2011
MON 05:00 JPY Consumer Confidence 36.70 38.60
MON 09:00 EUR Euro-Zone Consumer Price Index (MoM) 0.60% 1.40%
MON 09:00 EUR Euro-Zone Consumer Price Index (YoY) 2.80% 2.80%
MON 09:00 EUR Euro-Zone CPI - Core (YoY) 1.50% 1.30%
MON 09:00 EUR Euro-Zone Trade Balance (euros) 2.0B -1.5B
MON 09:00 EUR Italian Consumer Price Index (YoY) 3.00% 3.00%
MON 13:00 USD Ben Bernanke Speaks on U.S. Economy
MON 15:00 EUR EU Finance Ministers Summit in Brussels
MON CNY China Actual Foreign Direct Investment (YoY) 36.10% 32.90%
MON 01:30 AUD Reserve Bank of Australia Meeting Minutes


Tues 17 May 2011
TUE 06:30 EUR EU Finance Ministers Summit in Brussels
TUE 08:30 GBP Consumer Price Index (YoY) 4.10% 4.00%
TUE 08:30 GBP Core Consumer Price Index (YoY) 3.20% 3.20%
TUE 09:00 EUR Euro-Zone ZEW Survey (Econ. Sentiment) 17.30 19.70
TUE 12:30 USD Housing Starts 568K 549K
TUE 12:30 USD Housing Starts (MoM) 3.50% 7.20%
TUE 12:30 USD Building Permits 587K 585K
TUE 12:30 USD Building Permits (MoM) 0.30% 11.20%
TUE 13:15 USD Industrial Production 0.40% 0.80%
TUE 13:15 USD Capacity Utilization 77.60% 77.40%
TUE CNY HSBC PMI Manufacturing 51.80


Wed 18 May 2011
WED 08:30 GBP Bank of England Meeting Minutes
WED 18:00 USD Federal Open Market Committee Minutes
WED 23:50 JPY Gross Domestic Product (QoQ) (1Q P) -0.50% -0.30%
WED 23:50 JPY Gross Domestic Product Annualized -2.00% -1.30%
WED 23:50 JPY Gross Domestic Product Deflator (YoY) -1.90% -1.60%
WED 23:50 JPY Nominal Gross Domestic Product (QoQ) -0.80% -0.70%
WED 23:50 JPY Housing Loans (YoY) 3.20%


Thurs 19 May 2011
THU 04:30 JPY Industrial Production (YoY) -12.90%
THU 05:30 JPY Nationwide Department Store Sales (YoY) -14.70%
THU 08:30 GBP Retail Sales ex Auto Fuel (YoY) 2.20% 0.90%
THU 08:30 GBP Retail Sales inc Auto Fuel (YoY) 2.50% 1.30%
THU 14:00 USD Existing Home Sales 5.20M 5.10M
THU 14:00 USD Existing Home Sales (MoM) 2.00% 3.70%
THU 14:30 CAD Bank of Canada Review Release
THU JPY Bank of Japan Interest Rate Decision 0.10% 0.10%


Fri 20 May 2011
FRI 06:00 EUR German Producer Prices (YoY) 6.00% 6.20%
FRI 08:00 EUR Italian Industrial Orders n.s.a. (YoY) 15.70% 16.20%
FRI 11:00 CAD Bank Canada CPI Core (YoY) 1.60% 1.70%
FRI 11:00 CAD Consumer Price Index (YoY) 3.40% 3.30%
FRI 12:30 CAD Retail Sales (MoM) 0.90% 0.40%
FRI 12:30 CAD Retail Sales Less Autos (MoM) 0.70% 0.70%
FRI 14:00 EUR Euro-Zone Consumer Confidence -12.00 -11.60

Results for 8 May 2011 - 13 May 2011
* GMT Time

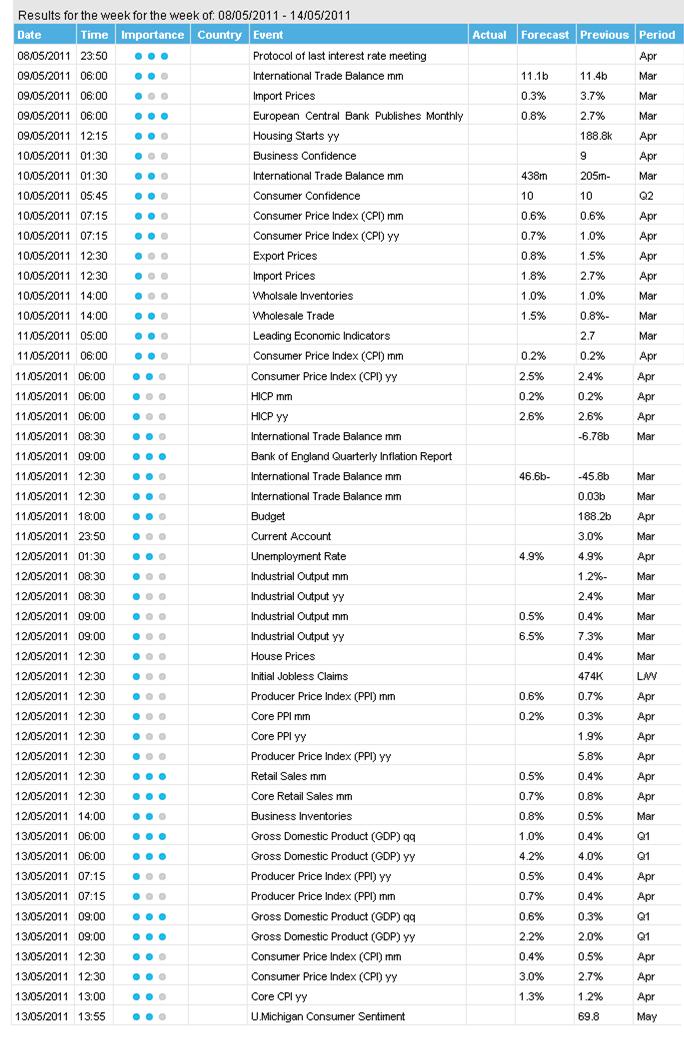
Results for 2 May 2011 - 5 May 2011
* GMT Time

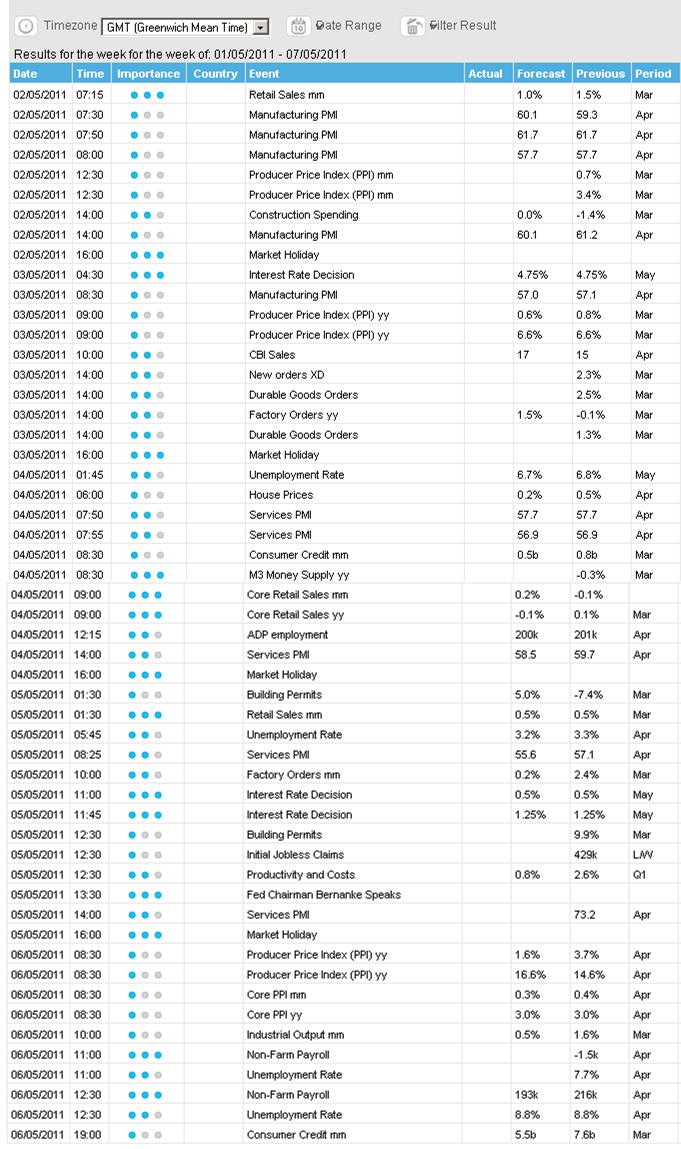
Results for 24 April 2011 - 30 April 2011
* GMT Time

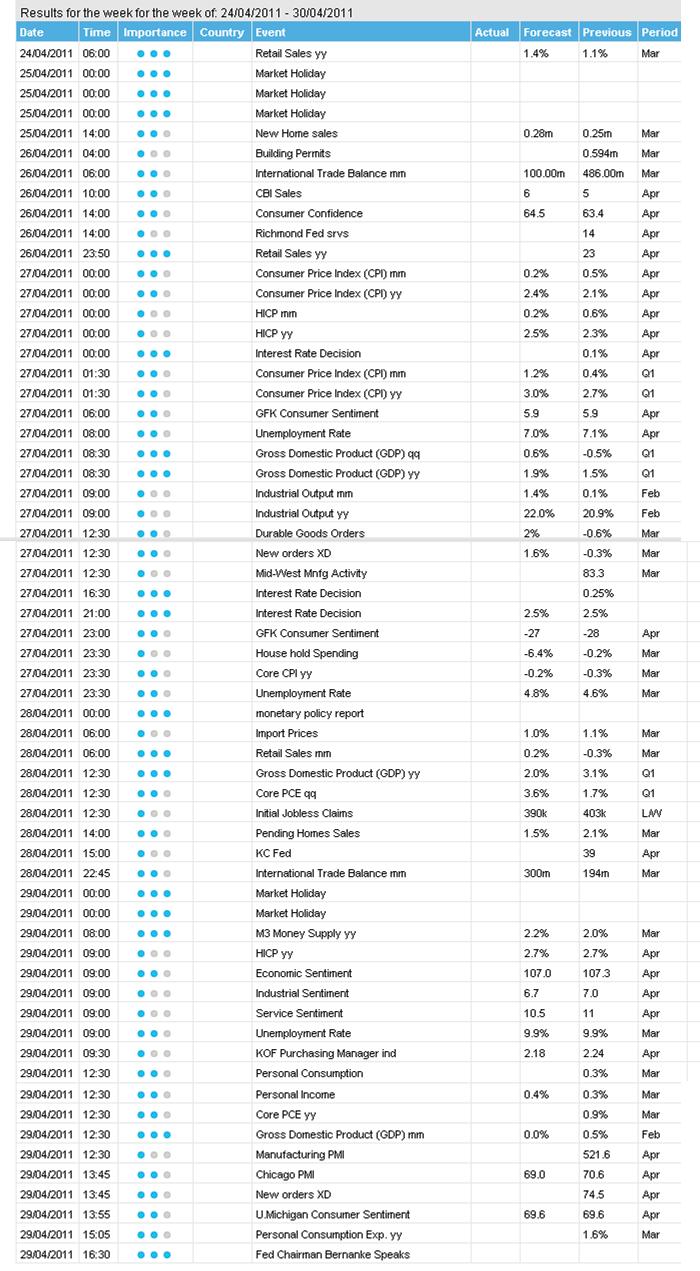
Results for 18 April 2011 - 21 April 2011
* GMT Time

18 April 2011 - 21 April 2011

Monday, 18 April 2011
GMT Ccy Events Consensus Previous
22:45 NZD CPI Q/Q Q1 1.00% 2.30%
22:45 NZD CPI Y/Y Q1 4.60% 4.00%
23:01 GBP Rightmove House Prices M/M Apr 0.80%
23:01 GBP Rightmove House Prices Y/Y Apr 0.90%
12:30 CAD International Securities Transactions (CAD) Feb 10.000B 13.290B
14:00 USD NAHB Housing Market Index Apr 17.00 17.00
14:00 EUR Eurozone Consumer Confidence Apr A -11.00 -10.60

Tuesday, 19 April 2011
GMT Ccy Events Consensus Previous
01:30 AUD RBA Board Minutes
05:00 JPY Consumer Confidence Households Mar 39.9 40.60
07:30 EUR German PMI Manufacturing Apr P 60.00 60.90
07:30 EUR German PMI Services Apr P 59.80 60.10
08:00 EUR Eurozone PMI Manufacturing Apr P 57.00 57.50
08:00 EUR Eurozone PMI Services Apr P 56.90 57.20
08:00 EUR Eurozone Current Account (EUR) Feb -2.3B -0.7B
11:00 CAD CPI M/M Mar 0.60% 0.30%
11:00 CAD CPI Y/Y Mar 2.80% 2.20%
11:00 CAD BoC CPI Core M/M Mar 0.20% 0.20%
11:00 CAD BoC CPI Core Y/Y Mar 1.20% 0.90%
12:30 CAD Leading Indicators M/M Mar 0.30% 0.80%
12:30 CAD Wholesale Sales M/M Feb -0.20% 1.50%
12:30 USD Building Permits Mar 540K 517K
12:30 USD Housing Starts Mar 520K 479K
23:50 JPY Trade Balance (JPY) Mar 0.33T 0.56T

Wednesday, 20 April 2011
GMT Ccy Events Consensus Previous
00:30 AUD Westpac Leading Index M/M Feb -0.10%
01:30 AUD Import Price Index Q/Q Q1 0.60% -3.80%
06:00 EUR German PPI M/M Mar 0.80% 0.70%
06:00 EUR German PPI Y/Y Mar 6.60% 6.40%
08:30 GBP BoE Minutes 3--0--6 3--0--6
14:00 USD Existing Home Sales Mar 5.00M 4.88M
14:30 USD Crude Oil Inventories 1.6M

Thursday, 21 April 2011
GMT Ccy Events Consensus Previous
01:30 AUD Producer Price Index Q/Q Q1 1.00% 0.10%
08:00 EUR German IFO - Business Climate Apr 110.50 111.10
08:00 EUR German IFO - Current Assessment Apr 115.50 115.80
08:00 EUR German IFO - Expectations Apr 105.50 106.50
08:30 GBP Public Sector Net Borrowing (GBP) Mar 18.7B 10.3B
08:30 GBP Retail Sales M/M Mar -0.40% -1.00%
08:30 GBP Retail Sales Y/Y Mar 0.80% 1.20%
08:30 GBP Retail Sales w/Auto Fuel M/M Mar -0.50% -0.80%
08:30 GBP Retail Sales w/Auto Fuel Y/Y Mar 1.00% 1.30%
12:30 CAD Retail Sales M/M Feb 0.50% -0.30%
12:30 CAD Retail Sales Less Autos M/M Feb 0.50% 0.00%
12:30 USD Initial Jobless Claims 390K 412K
14:00 USD House Price Index M/M Feb -0.20% -0.30%
14:00 USD Leading Indicators M/M Mar 0.30% 0.80%
14:00 USD Philly Fed Survey Apr 36.80 43.40
14:30 USD Natural Gas Storage 28B

Results for 11 April 2011 - 15 April 2011
* GMT Time

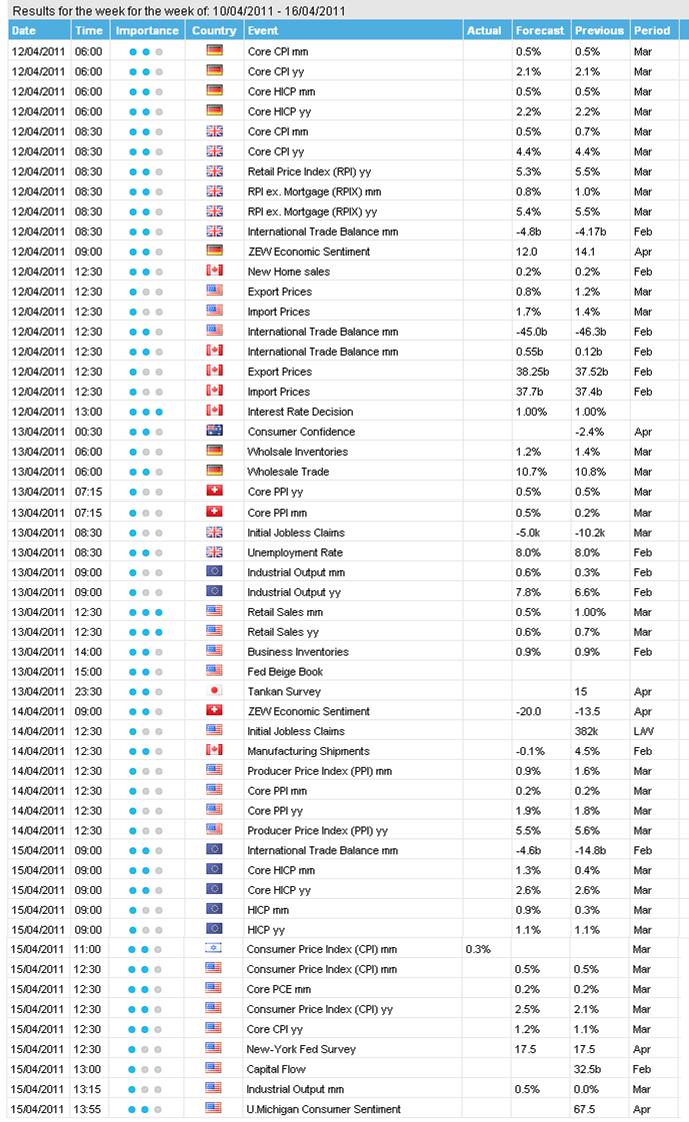
Results for 3 April 2011 - 08 April 2011
* GMT Time

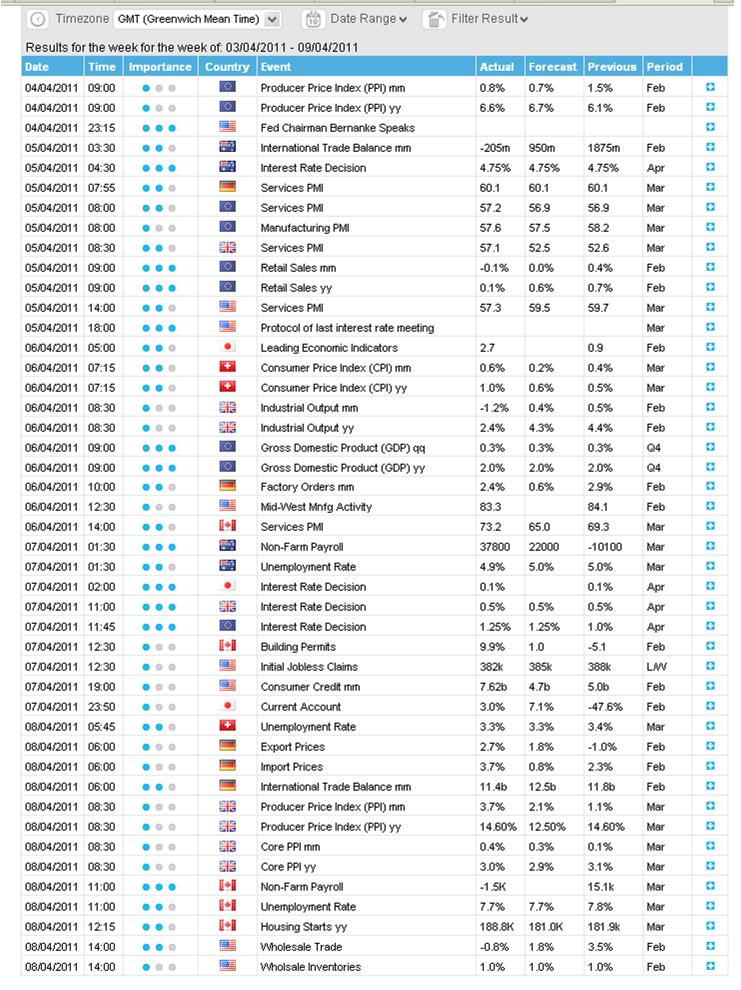
Results for 27 March 2011 - 01 April 2011
* GMT Time

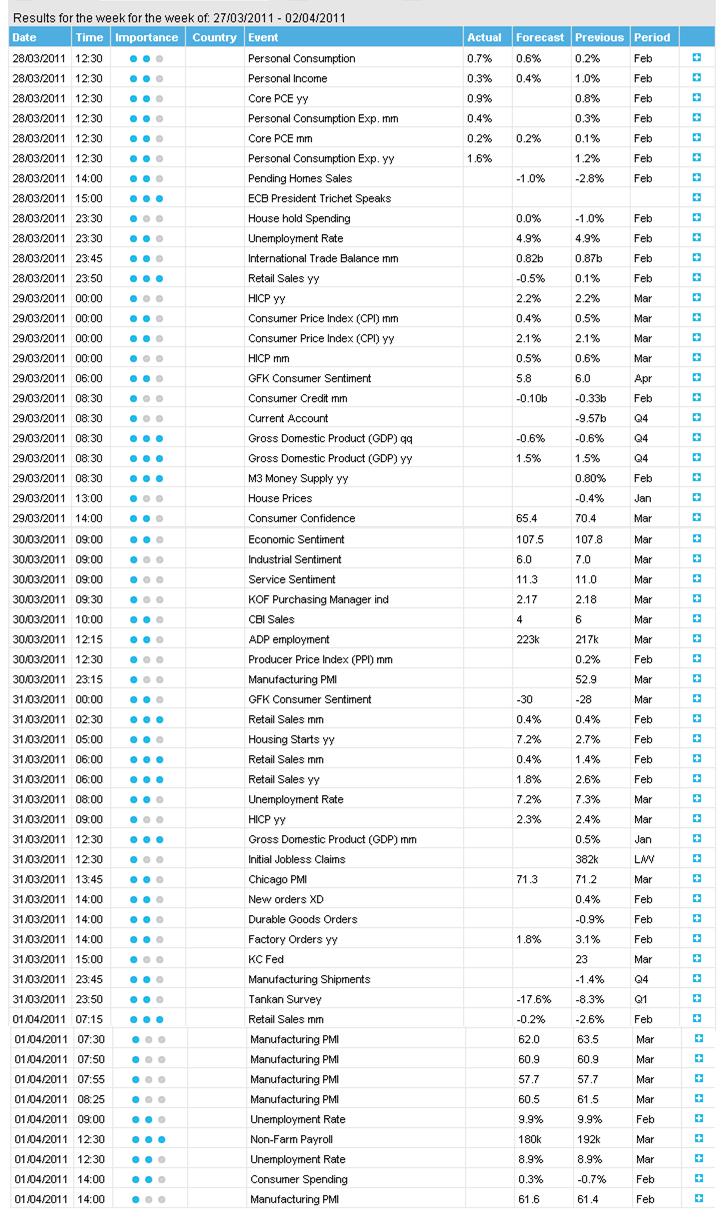
Results for 20 March 2011 - 25 March 2011
* GMT Time

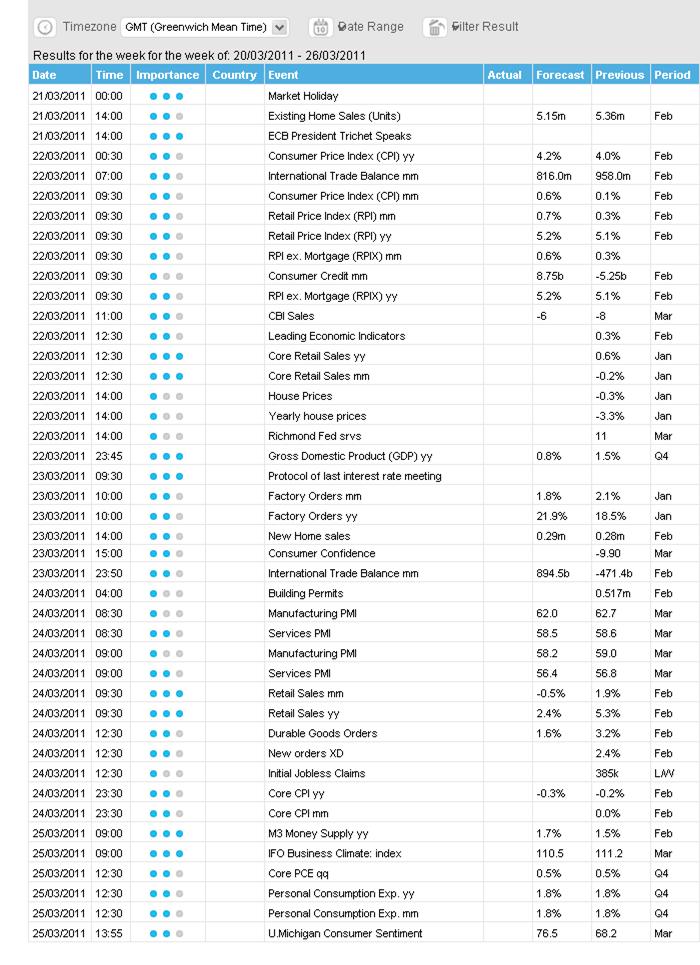
Results for 14 March 2011 - 18 March 2011
* GMT Time

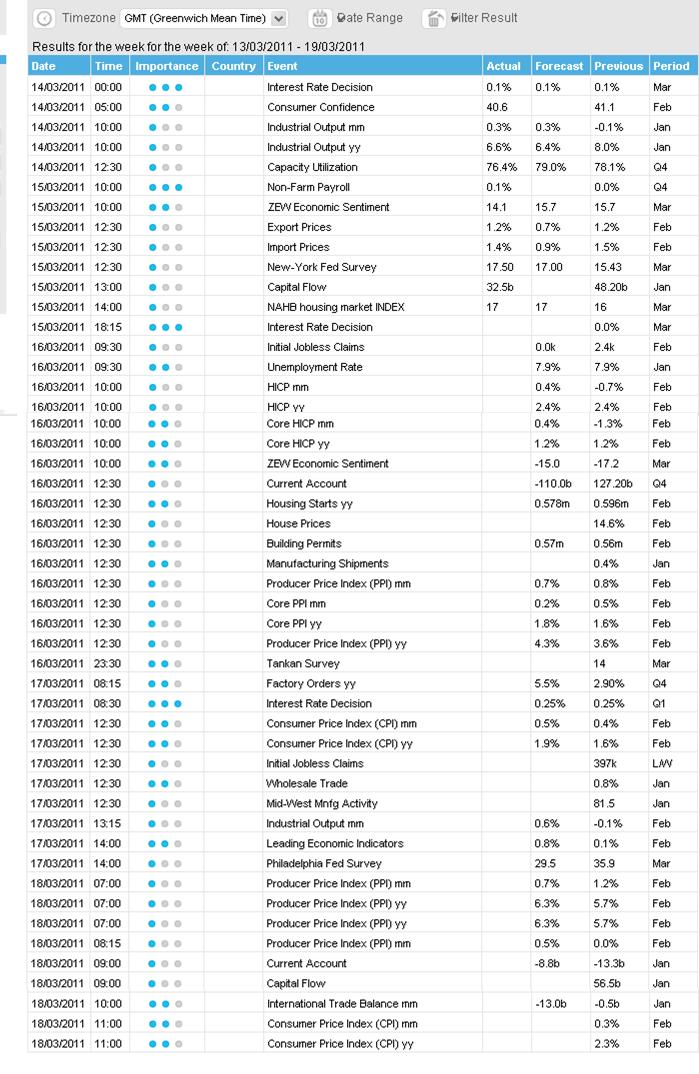
Results for 6 March 2011 - 11 March 2011
* GMT Time

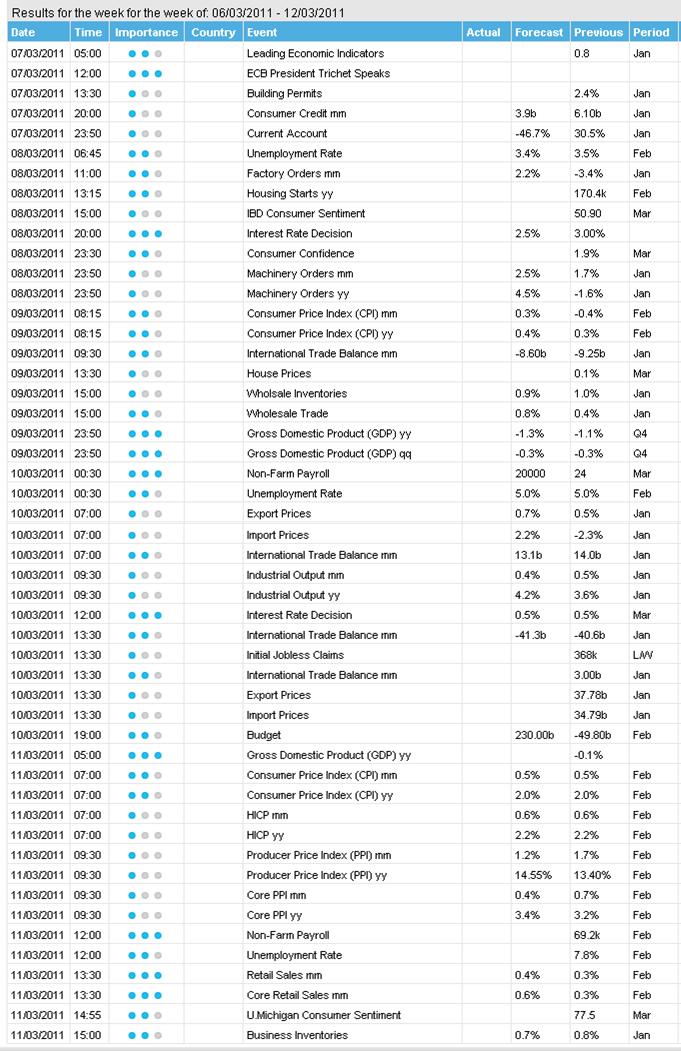
Results for 27 February 2011 - 4 March 2011
* GMT Time

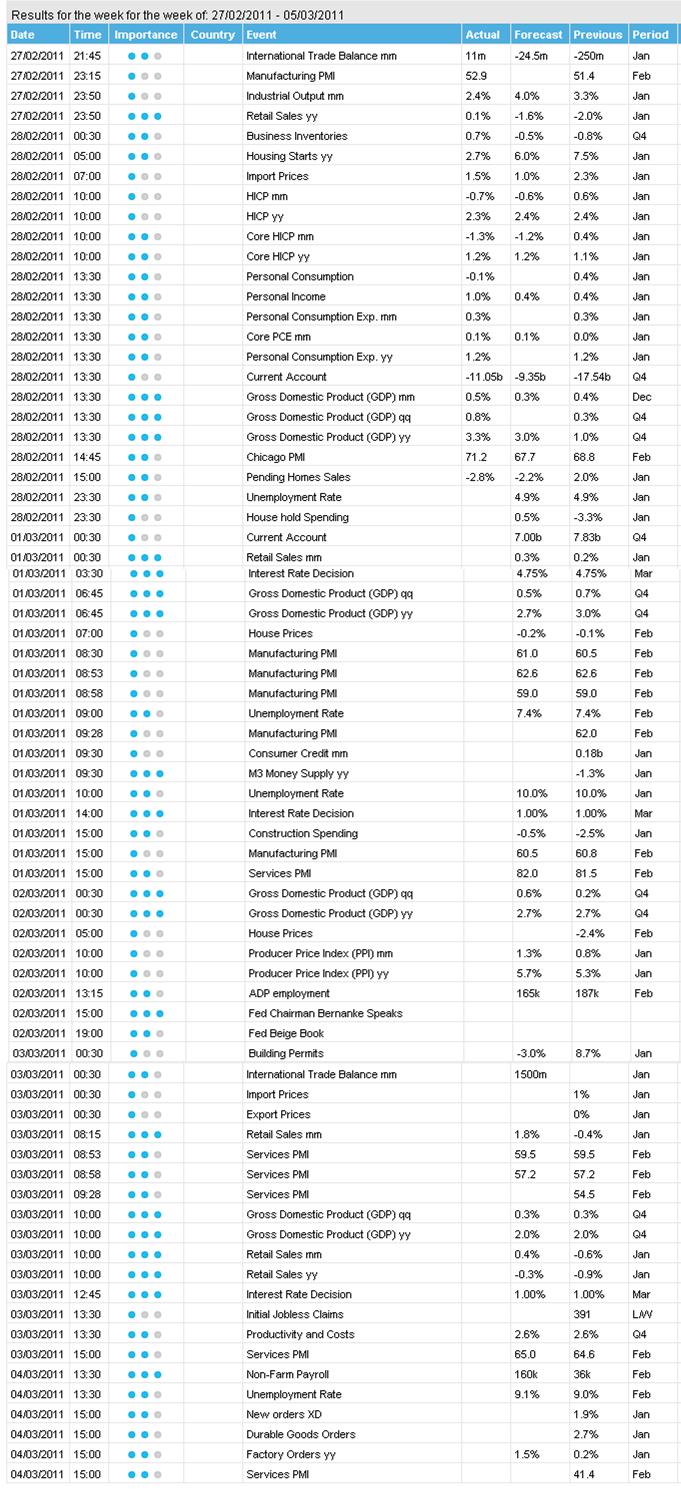
Results for 20 February 2011 - 25 February 2011
* GMT Time

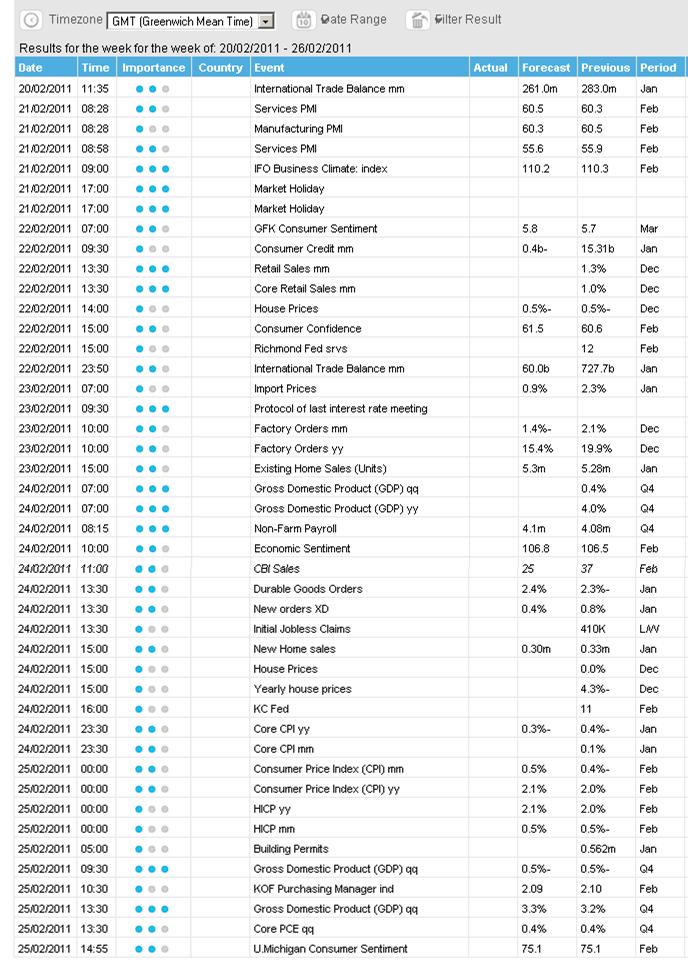
Results for 13 February 2011 - 18 February 2011
* GMT Time

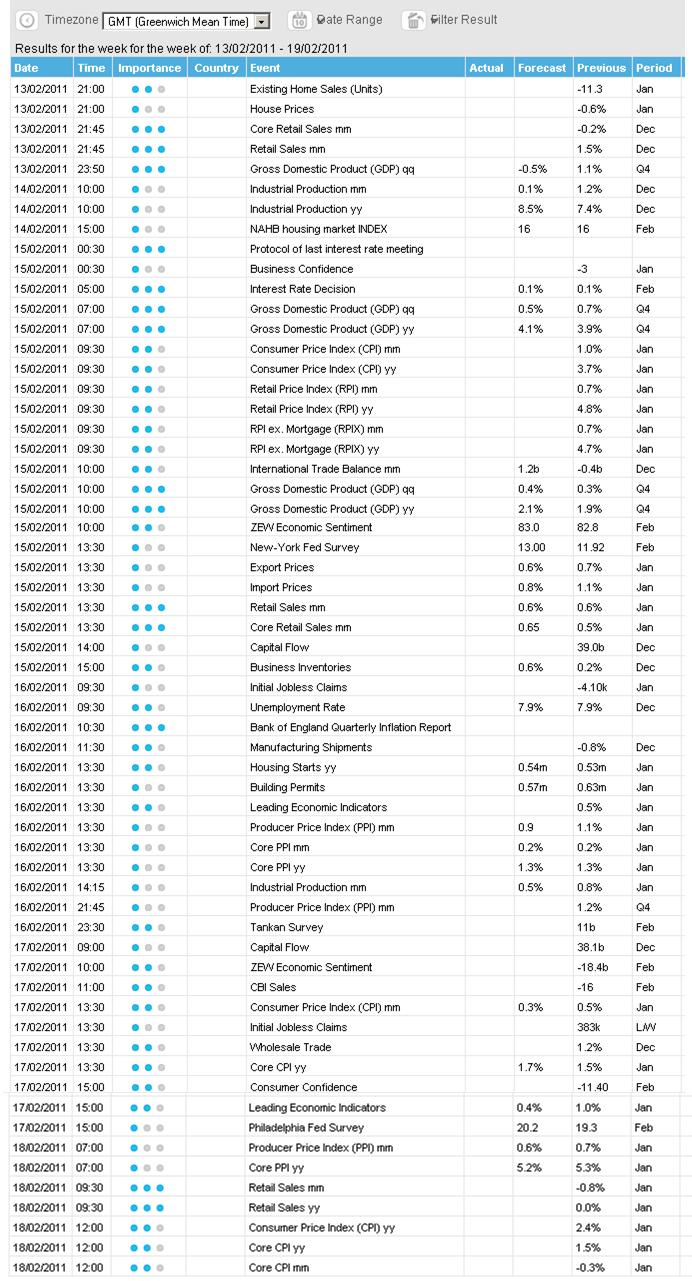
Results for 7 February 2011 - 11 February 2011
* GMT Time

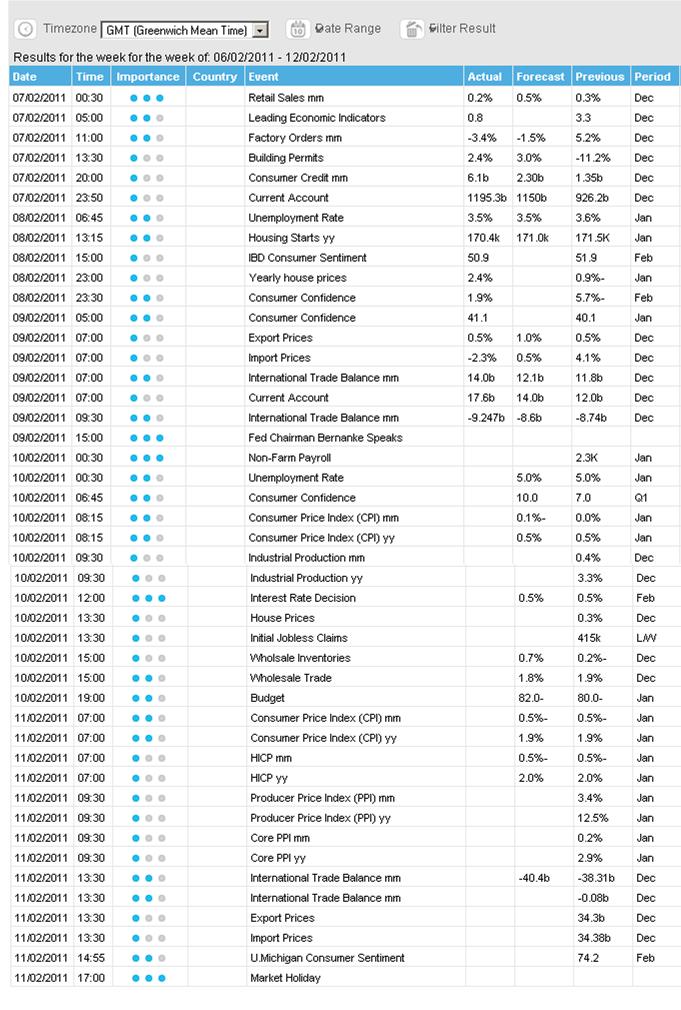
Results for 30 January 2011 - 4 February 2011
* GMT Time

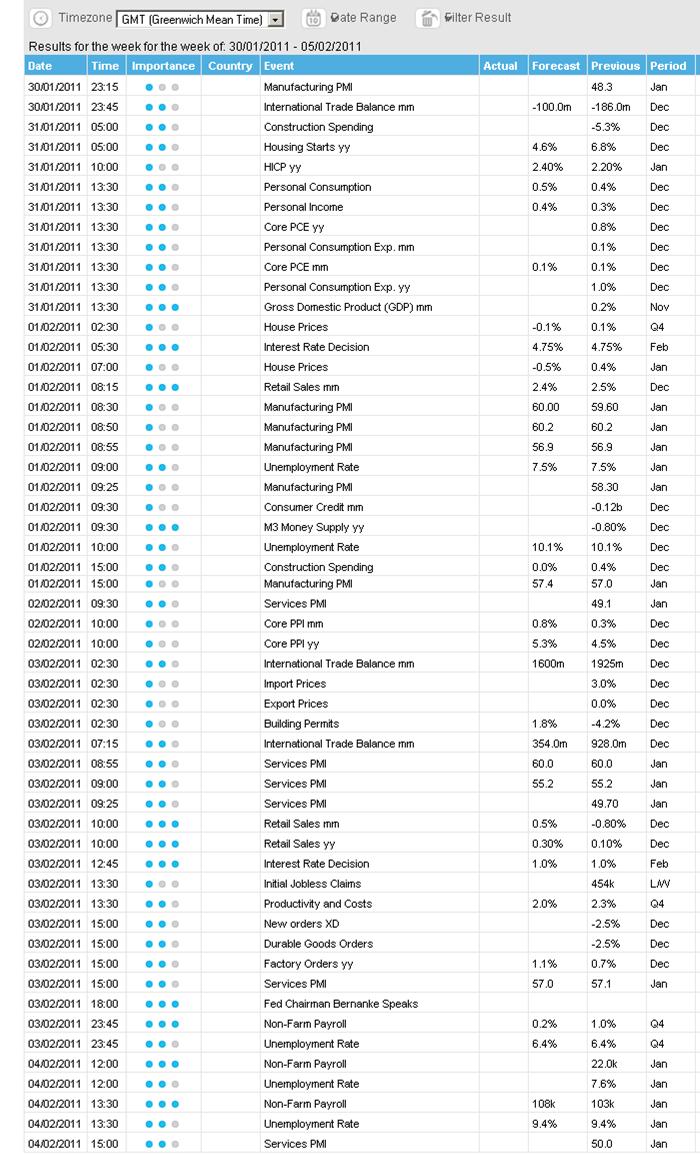
Results for 24 January 2011 - 28 January 2011
* GMT Time

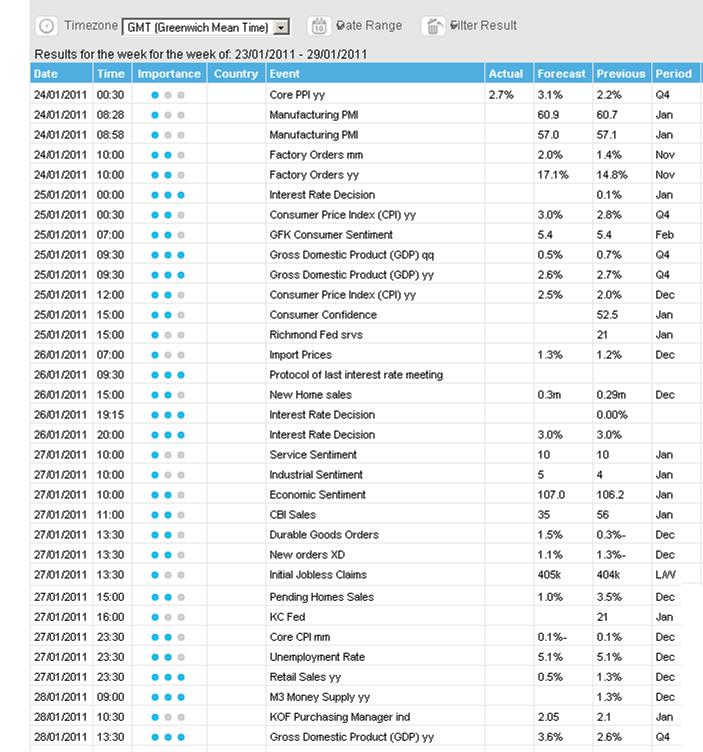
Results for 17 January 2011 - 21 January 2011
* GMT Time

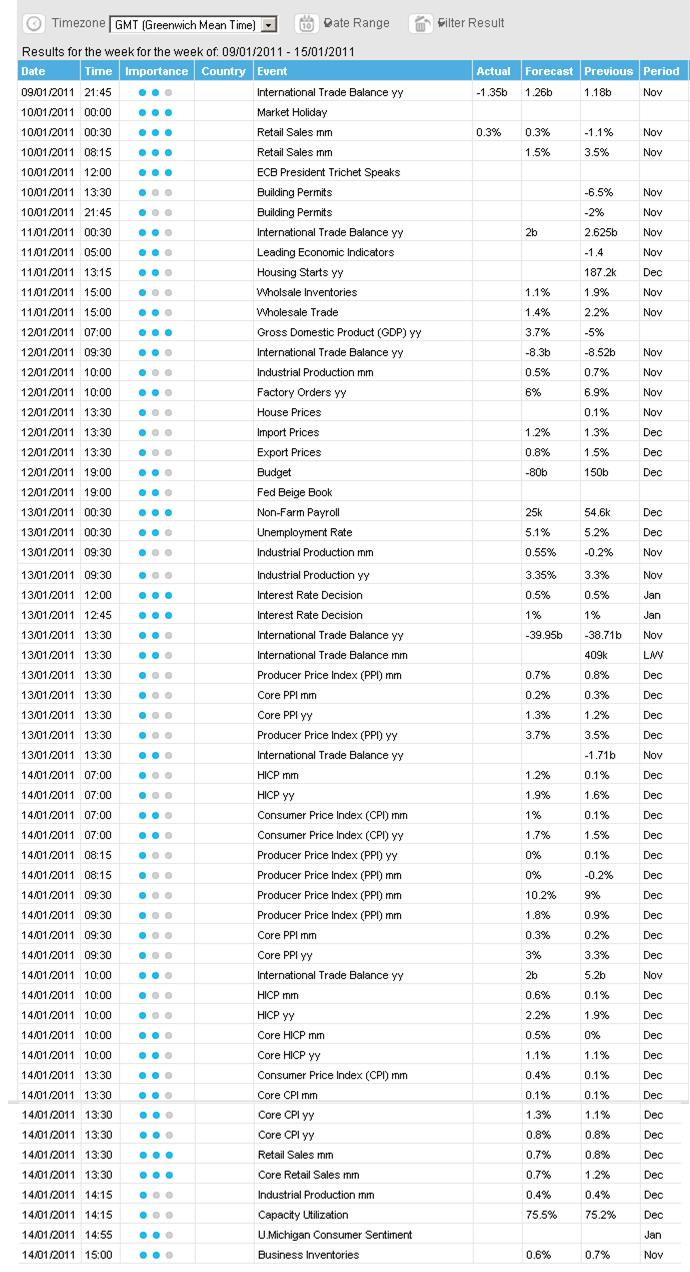
Results for 9 January 2011 - 14 January 2011
* GMT Time

Results for 2 January 2011 - 7 January 2011
* GMT Time

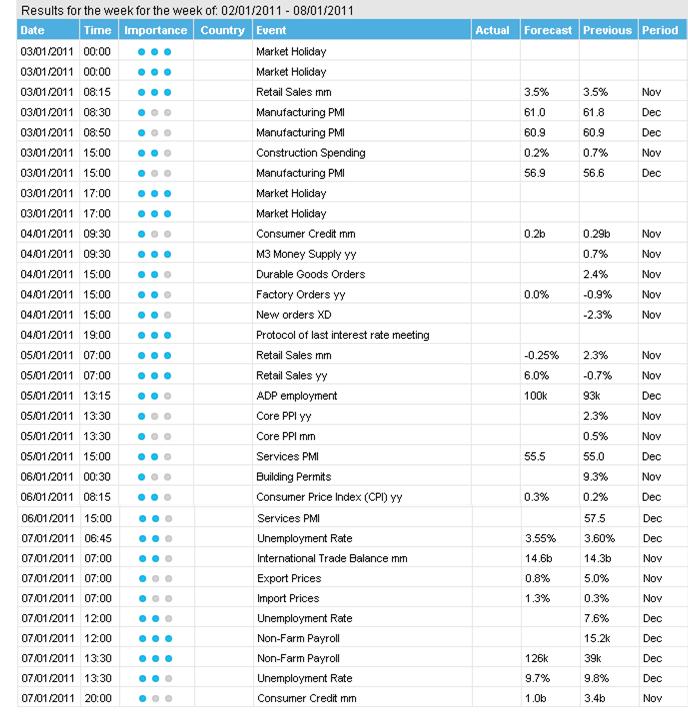
Results for 26 December 2010 - 31 December 2010
* GMT Time

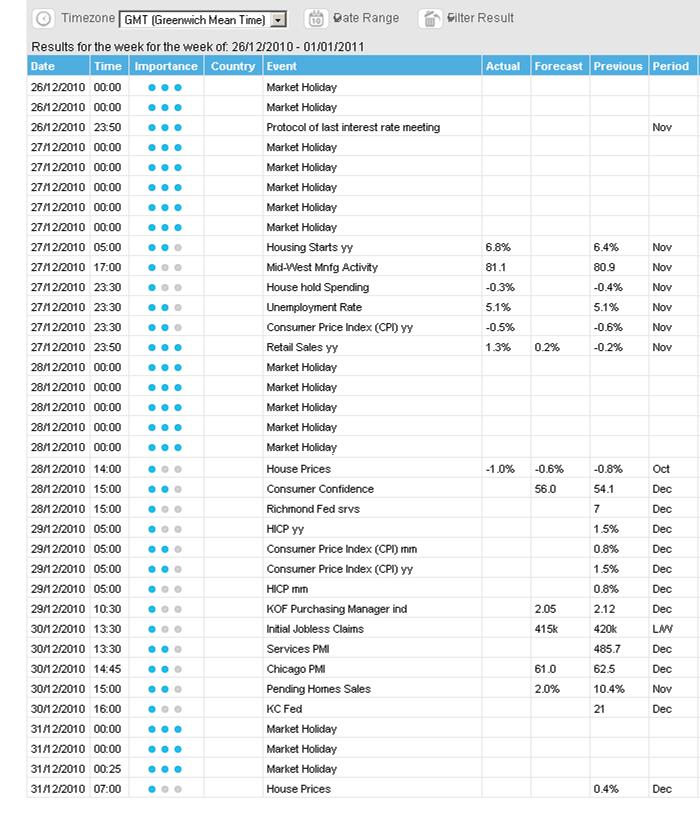
Results for 20 December 2010 - 24 December 2010
* GMT Time

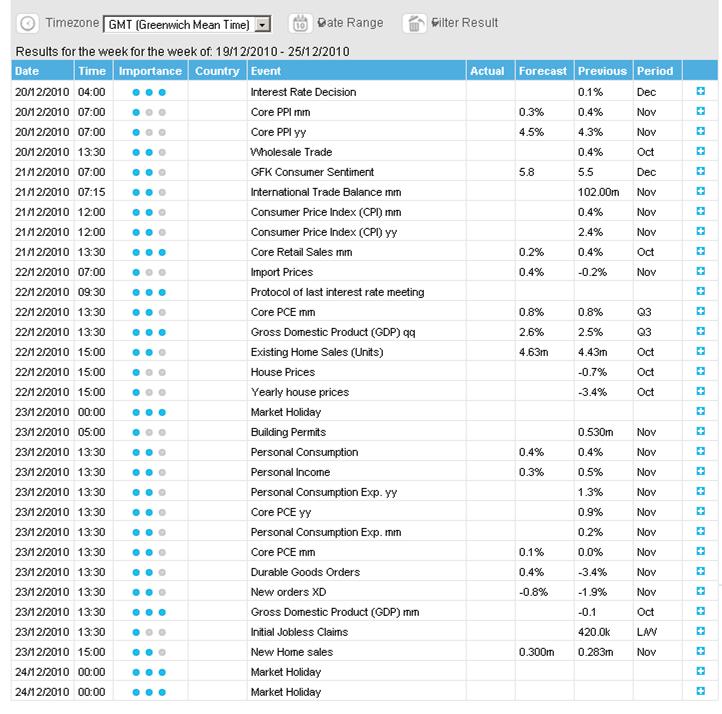
Results for 13 December 2010 - 17 December 2010
* GMT Time

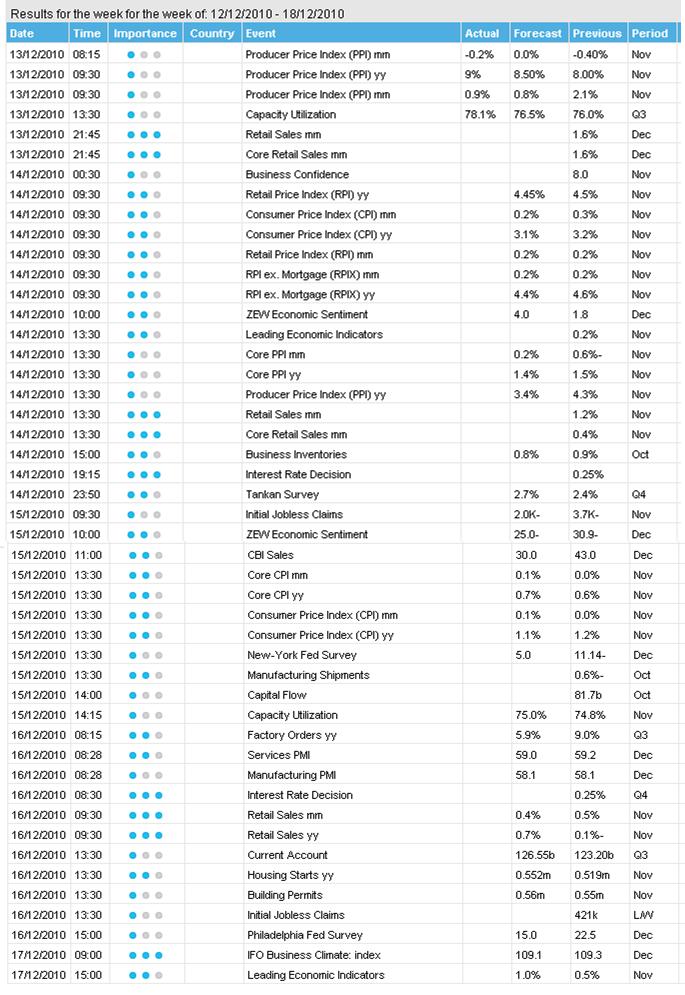
Results for 5 December 2010 - 10 December 2010
* GMT Time

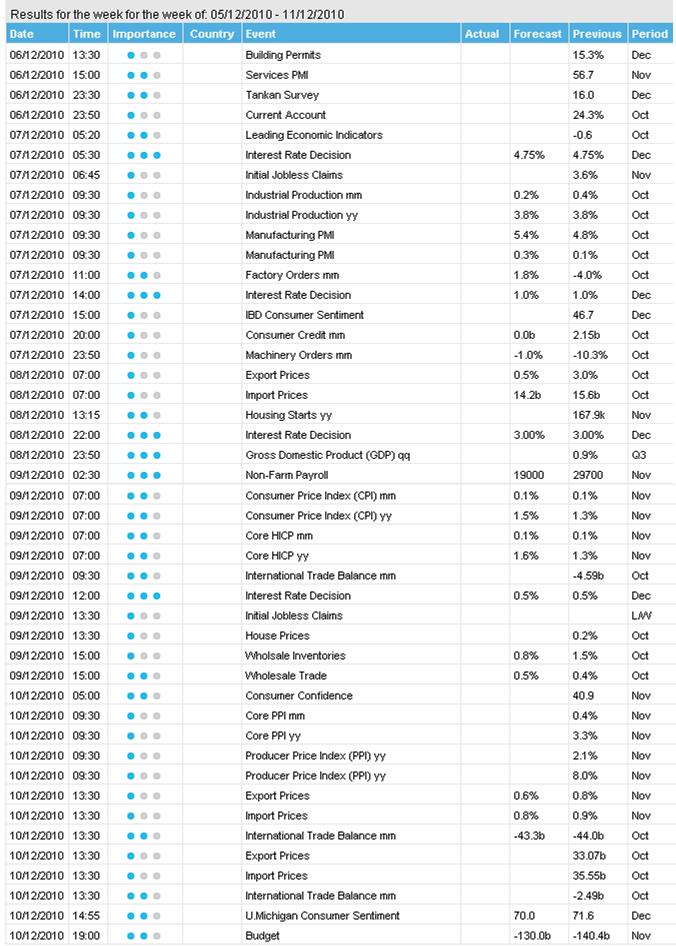
Results for 28 November 2010 - 3 December 2010
* GMT Time

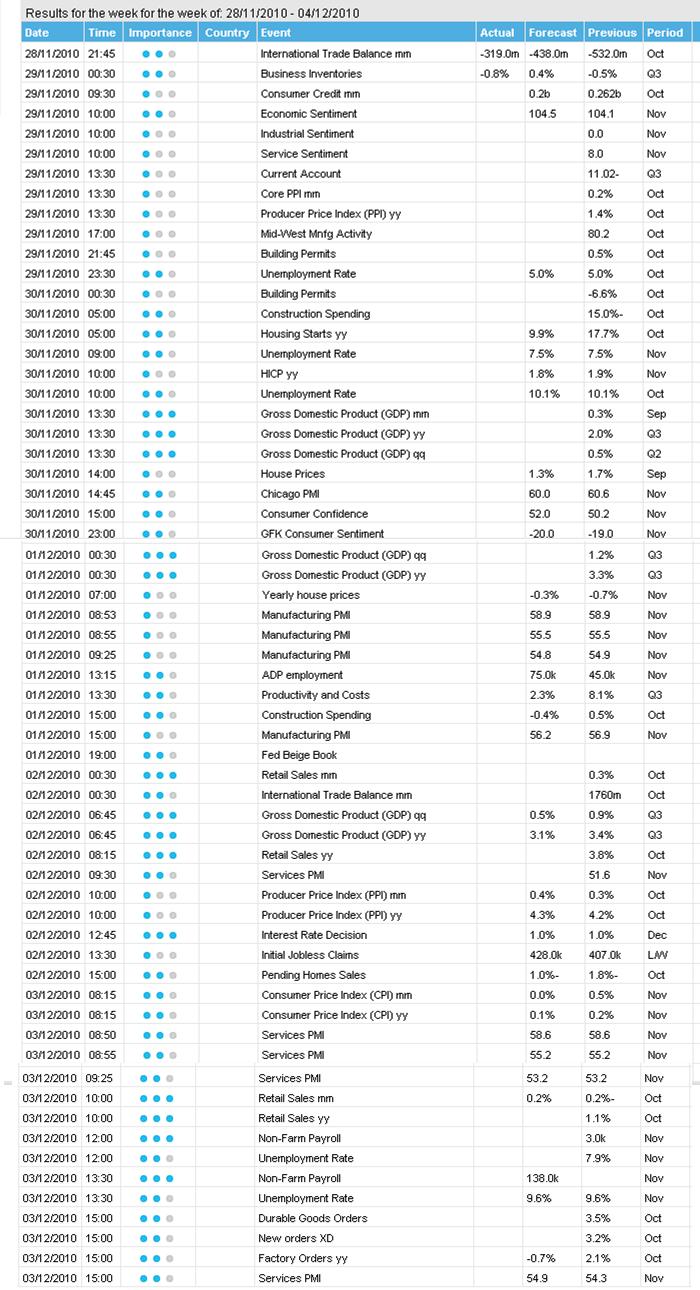
Results for 22 November 2010 -26 November 2010
* GMT Time

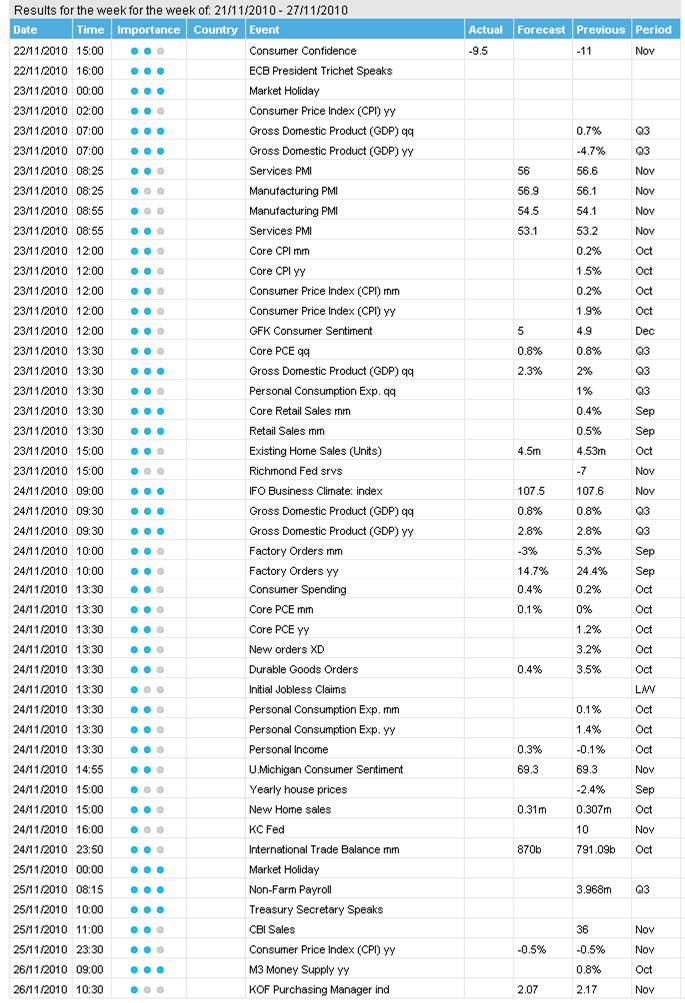
Results for 14 November 2010 - 19 November 2010
* GMT Time

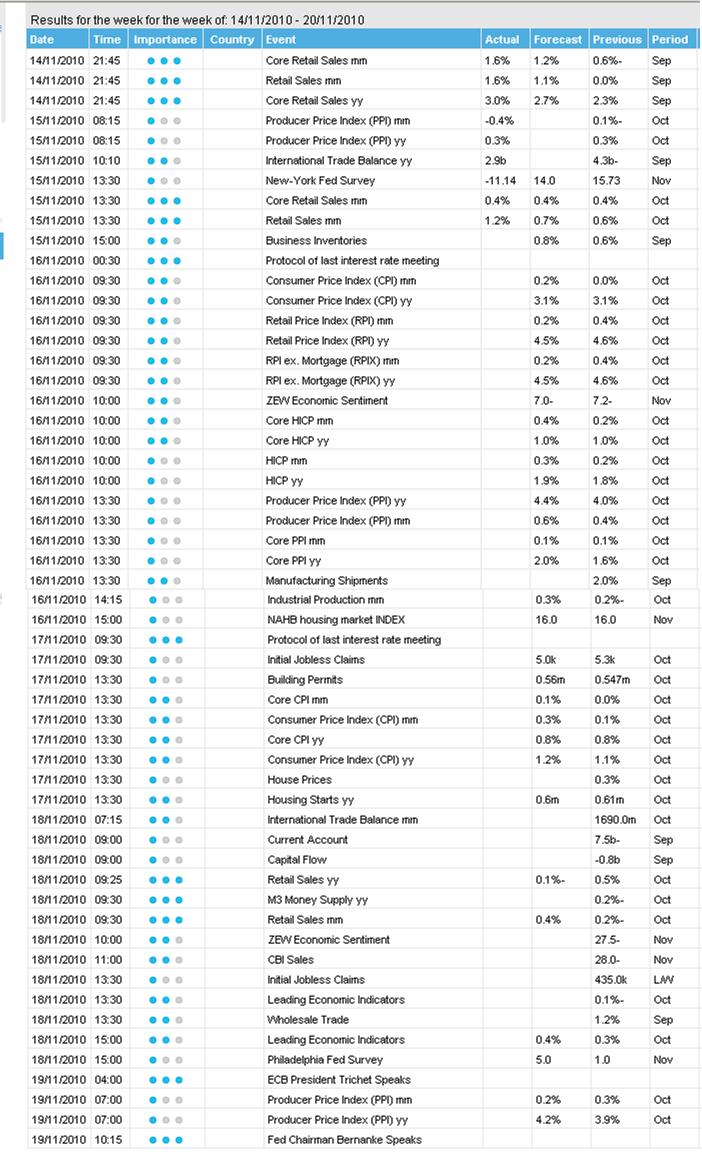
Results for 8 November 2010 - 12 November 2010
*GMT Time

Results for 1 November 2010 - 5 November 2010
*GMT Time

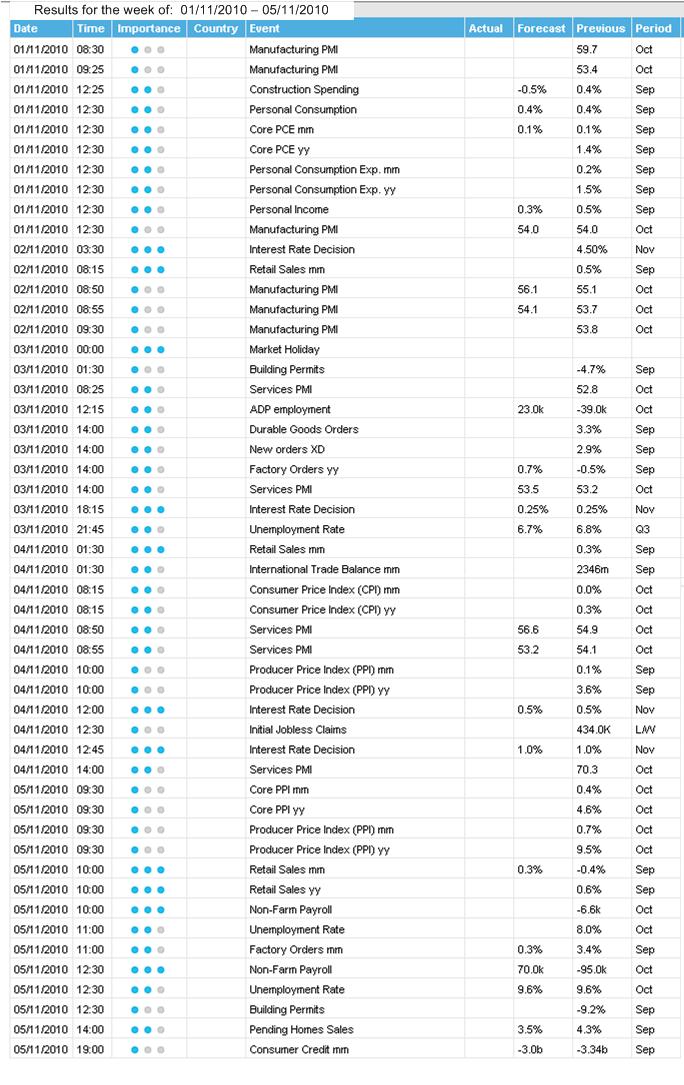
Results for 24 October 2010 - 29 October 2010
*GMT Time

FOREX tools that you can use:

Charts
Economic Calendars

Fundamental and
Technical Analysis

There are two analysis models applied to market movement forecasts: fundamental, and technical (the chart study of past behavior of currencies prices).
Fundamental analysis examines economic, political and social indicators to predict the economic health of a nation. Currencies can be viewed as the international representative of national economies; it follows, therefore, that economic health is an important component in currency valuation. The fundamental analyst constructs forecast models based on a myriad of different indicators to predict future currency movement.
This section outlines a number of theories and indicators?as well as political dimensions and monetary considerations?that are important in constructing Forex forecast models. 

Use your own trading strategies and formulas

Market Analysis
Essential Theories
Purchasing Power Parity
Theory of Elasticities
Modern Fiscal Theories
Theory Synthesis
Essential Indicators
Economic Indicators
Industrial Indicators
Construction Indicators
Inflation Indicators
Employment Indicators
Consumption Indicators
Geo-Political Factors
Financial Factors
Interest Rates
Political Crises
Technical Analysis
Introduction
Dow Theory
Elliott Waves Theory
Charts
Trends and Lines
Patterns
Bollinger Bands
Fibonacci Retracement
Gann Fan
MACD
Momentum
Moving Average
RSI
Stochastics


Free One Hour Training Session
English Italiano Arabic Chinese French - Francais Spanish - Espanol Russian Portuguese Dutch Turkish Romana Japanese
                            
Results for the week of: 17 October 2010 - 22 October 2010 17/10/2010 - 22/10/2010 * GMT Time Date Hour Country Event Result Forecast Previous Period 17/10/2010 21:45 New Zealand Consumer Price Index (CPI) mm 1.0% 0.3% Q3 17/10/2010 23:30 Japan Tankan Survey 17.0b Oct 18/10/2010 08:00 Europe Capital Flow -25.7b Aug 18/10/2010 13:00 USA Capital Flow 63.7b Aug 18/10/2010 13:15 USA Capacity Utilization 74.8% 74.7% Sep 18/10/2010 13:15 USA Industrial Production mm 0.2% 0.2% Sep 19/10/2010 00:30 Australia Protocol of last interest rate meeting 19/10/2010 08:00 Europe Current Account -3.8b Aug 19/10/2010 09:00 Germany ZEW Economic Sentiment -7 -4.3 Oct 19/10/2010 10:00 Israel CBI Sales 17.0- Oct 19/10/2010 12:30 USA Building Permits 0.58m 0.571m Sep 19/10/2010 12:30 USA House Prices 10.5% Sep 19/10/2010 12:30 USA Housing Starts yy 0.58m 0.598m Aug 19/10/2010 13:00 Canada Interest Rate Decision 1.0% 1.0% Oct 20/10/2010 06:00 Germany Producer Price Index (PPI) mm 0.2% 0.0% Sep 20/10/2010 06:00 Germany Producer Price Index (PPI) yy 3.9% 3.2% Sep 20/10/2010 08:30 U.K. Protocol of last interest rate meeting 20/10/2010 12:30 Canada Wholesale Trade 0.1%- Aug 20/10/2010 14:30 Canada monetary policy report 20/10/2010 18:00 USA Fed Beige Book 21/10/2010 06:15 Swiss International Trade Balance mm 568.0m Sep 21/10/2010 07:25 Germany Services PMI 54.7 54.9 Oct 21/10/2010 07:25 Germany Manufacturing PMI 54.6 55.1 Oct 21/10/2010 07:55 Europe Manufacturing PMI 53.2 53.6 Oct 21/10/2010 07:55 Europe Services PMI 53.7 53.6 Oct 21/10/2010 08:30 U.K. Retail Sales mm 0.3% 0.5%- Sep 21/10/2010 08:30 U.K. Retail Sales yy 1.0% 0.4% Sep 21/10/2010 09:00 Swiss ZEW Economic Sentiment 5.1- Oct 21/10/2010 12:30 USA Initial Jobless Claims 462.0k L/W 21/10/2010 12:30 Canada Leading Economic Indicators 0.5% Sep 21/10/2010 14:00 USA Leading Economic Indicators 0.2% 0.3% Sep 21/10/2010 14:00 USA Philadelphia Fed Survey 1.0 0.7- Oct 21/10/2010 14:00 Europe ADP employment 11.2- Oct 22/10/2010 08:00 Germany IFO Business Climate: index 106.5 106.8 Oct 22/10/2010 11:00 Canada Core CPI mm 0.1% Sep 22/10/2010 11:00 Canada Core CPI yy 1.6% Sep 22/10/2010 11:00 Israel Consumer Price Index (CPI) mm 0.1%- Sep 22/10/2010 11:00 Canada Consumer Price Index (CPI) yy 1.7% Sep 22/10/2010 12:30 Canada Core Retail Sales mm 0.4%- Aug 22/10/2010 12:30 Canada Retail Sales mm 0.1%- Aug Results for the week of: 11 October 2010 - 15 October 2010 11/10/2010 - 15/10/2010 * GMT Time Date Hour Country Event Result Forecast Previous Period 11/10/2010 00:00 USA Market Holiday 11/10/2010 00:00 Canada Market Holiday 11/10/2010 00:00 Japan Market Holiday 12/10/2010 01:30 Australia Consumer Confidence -5.0% Oct 12/10/2010 02:30 Australia Business Confidence 11 Sep 12/10/2010 05:00 Japan Consumer Confidence Sep 12/10/2010 06:00 Germany Core CPI yy 1.3% 1.3% Sep 12/10/2010 06:00 Germany Core HICP mm -0.2% -0.2% Sep 12/10/2010 06:00 Germany Core HICP yy 1.3% 1.3% Sep 12/10/2010 08:30 U.K. Core CPI mm 0.5% Sep 12/10/2010 08:30 U.K. Core CPI yy 3.1% Sep 12/10/2010 08:30 U.K. Retail Price Index (RPI) mm 0.4% Sep 12/10/2010 08:30 U.K. Retail Price Index (RPI) yy 4.7% Sep 12/10/2010 08:30 U.K. RPI ex. Mortgage (RPIX) mm 0.4% Sep 12/10/2010 08:30 U.K. RPI ex. Mortgage (RPIX) yy 4.7% Sep 12/10/2010 08:30 U.K. International Trade Balance mm -8.667b Aug 12/10/2010 12:00 Germany Core CPI mm -0.1% -0.1% Sep 12/10/2010 14:00 USA IBD Consumer Sentiment 45.3 Oct 13/10/2010 07:15 Swiss Producer Price Index (PPI) mm 0.1% Sep 13/10/2010 07:15 Swiss Producer Price Index (PPI) yy 0.5% Sep 13/10/2010 08:30 U.K. Unemployment Rate 7.8% Aug 13/10/2010 09:00 Europe Industrial Production mm 0.0% Aug 13/10/2010 09:00 Europe Industrial Production yy 7.1% Aug 13/10/2010 12:30 USA Export Prices 0.2% 0.8% Sep 13/10/2010 12:30 USA Import Prices -0.2% 0.6% Sep 13/10/2010 12:30 Canada House Prices -0.1% Aug 13/10/2010 23:45 New Zealand Core Retail Sales mm 0.3% -0.1% Aug 13/10/2010 23:45 New Zealand Retail Sales mm 0.4% -0.4% Aug 13/10/2010 23:45 New Zealand Core Retail Sales yy 2.4% 2.2% Aug 14/10/2010 12:30 USA Initial Jobless Claims 445.0k L/W 14/10/2010 12:30 USA International Trade Balance mm -43.12b -42.78 Aug 14/10/2010 12:30 USA Producer Price Index (PPI) yy 3.7% 3.1% Sep 14/10/2010 12:30 USA Producer Price Index (PPI) mm 0.1% 0.4% Sep 14/10/2010 12:30 USA Core PPI mm 0.1% 0.1% Sep 14/10/2010 12:30 USA Core PPI yy 1.5% 1.3% Sep 14/10/2010 12:30 Canada Export Prices 32.8b Aug 14/10/2010 12:30 Canada Import Prices 35.54b Aug 14/10/2010 12:30 Canada International Trade Balance mm -2.3b -2.74b Aug 15/10/2010 09:00 Europe International Trade Balance yy 6.7b Aug 15/10/2010 09:00 Europe Core HICP mm 0.3% Sep 15/10/2010 09:00 Europe Core HICP yy 1.1% 1.0% Sep 15/10/2010 09:00 Europe Core HICP mm 0.2% 0.2% Sep 15/10/2010 09:00 Europe Core HICP yy 1.8% 1.6% Sep 15/10/2010 12:30 USA Core CPI mm 0.1% 0.0% Sep 15/10/2010 12:30 USA Consumer Price Index (CPI) mm 0.2% 0.3% Sep 15/10/2010 12:30 USA Core CPI yy 0.9% 0.9% Sep 15/10/2010 12:30 USA Consumer Price Index (CPI) yy 1.2% 1.1% Sep 15/10/2010 12:30 USA Core Retail Sales mm 0.4% 0.6% Sep 15/10/2010 12:30 USA Retail Sales mm 0.3% 0.4% Sep 15/10/2010 12:30 Canada Manufacturing Shipments 0.3% -0.9% Aug 15/10/2010 13:55 USA U.Michigan Consumer Sentiment 68.1 68.2 Oct 15/10/2010 14:00 USA Business Inventories 0.5% 1.0% Aug Results for the week of: 04/10/2010 - 08/10/2010 4 October 2010 - 8 October 2010 * GMT Time Date Hour Country Event Result Forecast Previous Period 04/10/2010 09:00 Europe Producer Price Index (PPI) mm 0.2% Aug 04/10/2010 09:00 Europe Producer Price Index (PPI) yy 4% Aug 04/10/2010 14:00 USA Durable Goods Orders -1.3% Aug 04/10/2010 14:00 USA New orders XD -1.2% Aug 04/10/2010 14:00 USA Factory Orders yy -0.4% 0.1% Aug 04/10/2010 14:00 USA Pending Homes Sales 3.0% 5.2% Aug 05/10/2010 00:00 Japan Interest Rate Decision 0.1% Oct 05/10/2010 02:30 Australia Retail Sales mm 0.7% Aug 05/10/2010 02:30 Australia International Trade Balance mm 1888m Aug 05/10/2010 05:30 Australia Interest Rate Decision 4.5% Oct 05/10/2010 07:15 Swiss Consumer Price Index (CPI) mm 0.0% Sep 05/10/2010 07:15 Swiss Consumer Price Index (CPI) yy 0.3% Sep 05/10/2010 07:50 Germany Services PMI 54.6 Sep 05/10/2010 07:55 Europe Services PMI 55.9 Sep 05/10/2010 08:25 U.K. Services PMI 51.3 Sep 05/10/2010 09:00 Europe Retail Sales mm 0.1% Aug 05/10/2010 09:00 Europe Retail Sales yy 1.1% Aug 05/10/2010 14:00 USA Manufacturing PMI 52.0 51.5 Sep 06/10/2010 09:00 Europe Gross Domestic Product (GDP) qq 1.0% Q2 06/10/2010 09:00 Europe Gross Domestic Product (GDP) yy 1.9% Q2 06/10/2010 10:00 Germany Factory Orders mm -2.2% Aug 06/10/2010 12:15 USA ADP employment 30.0k -10.0k Sep 06/10/2010 14:00 Canada Services PMI 65.9 Sep 07/10/2010 02:30 Australia Non-Farm Payroll 30900 Sep 07/10/2010 05:00 Japan Leading Economic Indicators -0.8 Aug 07/10/2010 05:45 Swiss Unemployment Rate 3.8% Sep 07/10/2010 10:00 Germany Industrial Production mm 0.1% Aug 07/10/2010 11:45 Europe Interest Rate Decision 1.0% 1.0% Oct 07/10/2010 12:30 USA Initial Jobless Claims L/W 07/10/2010 12:30 Canada Building Permits -3.3% Aug 07/10/2010 13:00 U.K. Interest Rate Decision 0.5% 0.5% Oct 07/10/2010 19:00 USA Consumer Credit mm -3.0b -3.63b Aug 07/10/2010 23:50 Japan Current Account 26.1 Aug 08/10/2010 06:00 Germany International Trade Balance mm 12.7b Aug 08/10/2010 11:00 Canada Non-Farm Payroll 35.8k Sep 08/10/2010 11:00 Canada Unemployment Rate 8.1% Sep 08/10/2010 12:15 Canada Housing Starts yy 183.3k Sep 08/10/2010 12:30 USA Non-Farm Payroll 0.0k -54.0k Sep 08/10/2010 12:30 USA Unemployment Rate 9.7% 9.6% Sep 08/10/2010 14:00 USA Wholsale Inventories 0.6% 1.3% Aug 08/10/2010 14:00 USA Wholesale Trade 0.6% 0.4% Aug Results for the week of: 26/09/2010 - 1/10/2010 26 September 2010 - 1 October 2010 * GMT Time Date Hour Country Event Result Forecast Previous Period 26/09/2010 23:50 Japan International Trade Balance mm 103.2b 238.4b 804.2b Aug 27/09/2010 08:00 Europe M3 Money Supply yy 1.1% 0.3% 0.2% Aug 27/09/2010 15:30 Israel Interest Rate Decision 2% 2.00% 1.75% Oct 27/09/2010 16:00 USA Mid-West Mnfg Activity 79.9 81.4 Aug 28/09/2010 06:00 Germany GFK Consumer Sentiment 4.2 4.1 Oct 28/09/2010 08:30 U.K. Current Account -9.75b -9.62b Q2 28/09/2010 08:30 U.K. Gross Domestic Product (GDP) qq 1.2% 1.2% Q2 28/09/2010 08:30 U.K. Gross Domestic Product (GDP) yy 1.7% 1.7% Q2 28/09/2010 10:00 U.K. CBI Sales 25 35 Sep 28/09/2010 13:00 USA House Prices 3.2% 4.2% Jul 28/09/2010 14:00 USA Consumer Confidence 52.5 53.5 Sep 28/09/2010 14:00 USA Richmond Fed srvs -10 Sep 28/09/2010 21:45 New Zealand International Trade Balance mm -500m-186m Sep 28/09/2010 23:50 Japan Tankan Survey 4.2% 2.7% Q3 29/09/2010 08:30 U.K. Consumer Credit mm 0.1b 0.173b Aug 29/09/2010 08:30 U.K. M3 Money Supply yy -0.2% Aug 29/09/2010 09:00 Europe Economic Sentiment 101.2 101.8 Sep 29/09/2010 09:00 Europe Industrial Sentiment -5 -4 Sep 29/09/2010 09:00 Europe Service Sentiment 7 7 Sep 29/09/2010 09:30 Swiss KOF Purchasing Manager ind 2.12 2.18 Sep 29/09/2010 12:30 Canada Producer Price Index (PPI) mm 0.1% Aug 29/09/2010 12:30 Canada Producer Price Index (PPI) yy 1% Aug 29/09/2010 21:45 New Zealand Building Permits 3.1% Aug 29/09/2010 23:15 Japan Manufacturing PMI 50.1 Sep 29/09/2010 23:50 Japan Core Retail Sales yy 4.4% 3.9% Aug 30/09/2010 01:30 Australia Building Permits 0% 2.3% Aug 30/09/2010 05:00 Japan Housing Starts yy 10.4% 4.3% Aug 30/09/2010 06:00 U.K. Yearly house prices 2.5% 3.9% Sep 30/09/2010 08:00 Germany Unemployment Rate 7.6% 7.6% Sep 30/09/2010 09:00 Europe HICP yy 1.8% 1.6% Sep 30/09/2010 12:30 USA Core PCE qq 1.1% 1.1% Q2 30/09/2010 12:30 USA Gross Domestic Product (GDP) qq 1.6% 1.6% Q2 30/09/2010 12:30 USA Initial Jobless Claims 459k 465k L/W 30/09/2010 12:30 USA Personal Consumption Exp. qq 0% 0% Q2 30/09/2010 12:30 Canada Gross Domestic Product (GDP) mm 0.2% Jul 30/09/2010 13:45 USA Chicago PMI 55.8 56.7 Sep 30/09/2010 15:00 USA KC Fed 0% Sep 30/09/2010 23:30 Japan House hold Spending 1.3% 1.1% Aug 30/09/2010 23:30 Japan Consumer Price Index (CPI) yy -1% -1.1% Sep 30/09/2010 23:30 Japan Unemployment Rate 5.2% 5.2% Aug 01/10/2010 06:00 Germany Retail Sales mm 0.4% -0.3% Aug 01/10/2010 06:00 Germany Retail Sales yy 3.5% 0.8% Aug 01/10/2010 07:15 Swiss Retail Sales mm 4.8% Aug 01/10/2010 07:30 Swiss Manufacturing PMI 60.4 61.4 Sep 01/10/2010 07:50 Germany Manufacturing PMI 55.3 55.3 Sep 01/10/2010 07:55 Europe Manufacturing PMI 53.6 55.1 Sep 01/10/2010 08:25 U.K. Manufacturing PMI 53.8 54.3 Sep 01/10/2010 09:00 Europe Unemployment Rate 10% 10% Aug 01/10/2010 12:30 USA Consumer Spending 0.3% 0.4% Aug 01/10/2010 12:30 USA Core PCE mm 0.1% 0.1% Aug 01/10/2010 12:30 USA Core PCE yy 1.4% Aug 01/10/2010 12:30 USA Personal Consumption Exp. mm 0.2% Aug 01/10/2010 12:30 USA Personal Consumption Exp. yy 1.5% Aug 01/10/2010 12:30 USA Personal Income 0.3% 0.2% Aug 01/10/2010 13:55 USA U.Michigan Consumer Sentiment 67 66.6 Sep 01/10/2010 14:00 USA Construction Spending -0.4% -1% Aug 01/10/2010 14:00 USA Manufacturing PMI 54.5 56.3 Sep Results for the week of: 20/09/2010 - 24/09/2010 20 September 2010 - 24 September 2010 * GMT Time Date Hour Country Event Result Forecast Previous Period 20/09/2010 00:00 Japan Market Holiday 20/09/2010 12:30 Canada Wholesale Trade -0.3% Jul 21/09/2010 06:15 Swiss International Trade Balance mm 2886.0m Aug 21/09/2010 11:00 Canada Core CPI mm -0.1% Aug 21/09/2010 11:00 Canada Core CPI yy 1.6% Aug 21/09/2010 11:00 Canada Consumer Price Index (CPI) mm 0.5% Aug 21/09/2010 11:00 Canada Consumer Price Index (CPI) 1.8% Aug 21/09/2010 12:30 USA Building Permits 0.57m 0.559m Aug 21/09/2010 12:30 USA Building Permits -4.1% Aug 21/09/2010 12:30 USA Housing Starts yy 0.55m 0.546m Aug 21/09/2010 18:15 USA Interest Rate Decision 0.25% 0.25% 21/09/2010 22:45 New Zealand Current Account -0.500b 0.180b Q2 22/09/2010 08:30 U.K. Protocol of last interest rate meeting 22/09/2010 09:00 Europe Factory Orders mm -1.0% 2.5% Jul 22/09/2010 09:00 Europe Factory Orders yy 16.2% 22.6% Jul 22/09/2010 12:30 Canada Leading Economic Indicators 0.4% Aug 22/09/2010 12:30 Canada Core Retail Sales mm -0.5% Jul 22/09/2010 12:30 Canada Retail Sales mm 0.1% Jul 22/09/2010 14:00 USA House Prices -0.3% Jul 22/09/2010 14:00 USA Yearly house prices -1.7% Jul 22/09/2010 14:00 Europe Consumer Confidence -11.7 Sep 22/09/2010 22:45 New Zealand Gross Domestic Product (GDP) yy 2.6% 1.9% Q2 22/09/2010 22:45 New Zealand Gross Domestic Product (GDP) qq 0.6% Q2 23/09/2010 00:00 Japan Market Holiday 23/09/2010 07:25 Germany Services PMI 57.0 58.5 Sep 23/09/2010 07:25 Germany Manufacturing PMI 57.7 58.2 Sep 23/09/2010 07:55 Europe Manufacturing PMI 54.6 55.0 Sep 23/09/2010 07:55 Europe Services PMI 55.5 55.6 Sep 23/09/2010 12:30 USA Initial Jobless Claims 450.0k L/W 23/09/2010 14:00 USA Existing Home Sales (Units) 4.1m 3.83m Aug 23/09/2010 14:00 USA Existing Home Sales (Units) 7.1% -27.2% Aug 23/09/2010 14:00 USA Leading Economic Indicators 0.1% 0.1% Aug 24/09/2010 08:00 Germany IFO Business Climate: index 106.2 106.7 Sep 24/09/2010 12:30 USA New orders XD 0.4% Aug 24/09/2010 12:30 USA Durable Goods Orders -0.7% 0.4% Aug 24/09/2010 14:00 USA New Home sales -12.4% Aug 24/09/2010 14:00 USA New Home sales 0.3m 0.276m Aug Results for the week of: 12/09/2010 - 17/09/2010 12 September 2010 - 17 September 2010 Date Hour Country Event Result Forecast Previous Period 12/09/2010 22:45 New Zealand Core Retail Sales mm 1.5%0.2% 1.5% Jul 12/09/2010 22:45 New Zealand Retail Sales mm 0.0% 0.9% Jul 12/09/2010 22:45 New Zealand Retail Sales yy 3.4% 3.4% Jul 13/09/2010 07:15 Swiss Core PPI mm -0.5 Aug 13/09/2010 07:15 Swiss Core PPI yy 0.5% Aug 13/09/2010 09:00 Europe Industrial Production mm 0.3% -0.1% Jul 13/09/2010 09:00 Europe Industrial Production yy 8.2% Jul 13/09/2010 18:00 USA Budget -100.0b -103.6b Aug 14/09/2010 01:30 Australia Business Confidence 5.4% Sep 14/09/2010 08:30 U.K. Consumer Price Index (CPI) mm -0.2% Aug 14/09/2010 08:30 U.K. Consumer Price Index (CPI) yy 3.1% Oct 14/09/2010 08:30 U.K. Retail Price Index (RPI) mm -0.2% Aug 14/09/2010 08:30 U.K. RPI ex. Mortgage (RPIX) yy 4.8% Aug 14/09/2010 08:30 U.K. RPI ex. Mortgage (RPIX) mm -0.3% Aug 14/09/2010 08:30 U.K. Retail Price Index (RPI) yy 4.8% Aug 14/09/2010 09:00 Germany ZEW Economic Sentiment 12.0 14.0 Sep 14/09/2010 12:30 USA Core Retail Sales mm 0.3% 0.2% Aug 14/09/2010 12:30 USA Retail Sales mm 0.3% 0.4% Aug 14/09/2010 12:30 Canada Capacity Utilization 74.2% Q2 14/09/2010 12:30 Canada Productivity and Costs 0.7% Q2 14/09/2010 14:00 USA Business Inventories 0.4% 0.3% Jul 14/09/2010 14:00 USA IBD Consumer Sentiment 43.6 Sep 15/09/2010 07:30 U.K. Unemployment Rate 7.8% Jul 15/09/2010 08:30 U.K. Initial Jobless Claims -3.8k Aug 15/09/2010 09:00 Swiss ZEW Economic Sentiment 9.1 Sep 15/09/2010 09:00 Europe Core HICP mm -0.4% Aug 15/09/2010 09:00 Europe Core HICP yy 1.0% Aug 15/09/2010 09:00 Europe HICP mm 0.2% -0.3% Aug 15/09/2010 09:00 Europe HICP yy 1.6% 1.7% Aug 15/09/2010 12:30 USA Export Prices 0.2% -0.2% Aug 15/09/2010 12:30 USA Import Prices 0.2% 0.2% Aug 15/09/2010 12:30 USA New-York Fed Survey 8.5 7.1 Sep 15/09/2010 12:30 Canada Manufacturing Shipments 0.1% Jul 15/09/2010 13:15 USA Capacity Utilization 74.9% 74.8% Aug 15/09/2010 13:15 USA Industrial Production mm 0.2% 1.0% Aug 15/09/2010 23:30 Japan Tankan Survey 22.0 Sep 16/09/2010 00:00 Swiss Interest Rate Decision 0.25% 0.25% Q3 16/09/2010 07:15 Swiss Factory Orders yy 13.1% Q2 16/09/2010 08:30 U.K. Retail Sales mm 1.1% Aug 16/09/2010 08:30 U.K. Retail Sales yy 1.3% Aug 16/09/2010 09:00 Europe International Trade Balance yy 2.4b Jul 16/09/2010 12:30 USA Current Account -123.9b -109.0b Q2 16/09/2010 12:30 USA Initial Jobless Claims 451.0k L/W 16/09/2010 12:30 USA Producer Price Index (PPI) yy 3.0% 4.2% Aug 16/09/2010 12:30 USA Producer Price Index (PPI) mm 0.2% 0.2% Aug 16/09/2010 12:30 USA Core PPI mm 0.1% 0.3% Aug 16/09/2010 12:30 USA Core PPI yy 1.4% 1.5% Aug 16/09/2010 13:00 USA Capital Flow -6.7b Jul 16/09/2010 14:00 USA Philadelphia Fed Survey 2.5 -7.7 Sep 17/09/2010 06:00 Germany Core PPI mm 0.3% 0.5% Aug 17/09/2010 06:00 Germany Core PPI yy 3.7% Aug 17/09/2010 08:00 Europe Current Account -4.6b Jul 17/09/2010 08:00 Europe Capital Flow -4.0b Jul 17/09/2010 12:30 USA Core CPI mm 0.1% 0.1% Aug 17/09/2010 12:30 USA Core CPI yy 1.0% 0.9% Aug 17/09/2010 12:30 USA Consumer Price Index (CPI) mm 0.3% 0.3% Aug 17/09/2010 12:30 USA Consumer Price Index (CPI) yy 1.0% 0.9% Aug Results for the week of: 05/09/2010 - 10/09/2010 05 September 2010 - 10 September 2010 * GMT Time Date Hour Country Event Result Forecast Previous Period 06/09/2010 00:00 USA Market Holiday 06/09/2010 00:00 Canada Market Holiday 06/09/2010 22:00 U.K. Core Retail Sales yy 0.5% Aug 07/09/2010 00:00 Japan Interest Rate Decision 0.1% Sep 07/09/2010 05:00 Japan Leading Economic Indicators 0.3 Jul 07/09/2010 05:45 Swiss Initial Jobless Claims 3.6% Aug 07/09/2010 05:45 Swiss Unemployment Rate 3.8% Aug 07/09/2010 07:30 Australia Interest Rate Decision 4.5% 4.5% Sep 07/09/2010 10:00 Germany Factory Orders mm 0.5% 3.2% Jul 07/09/2010 23:50 Japan Current Account -18.2% Jul 07/09/2010 23:50 Japan Machinery Orders mm 1.6% Jul 08/09/2010 06:00 Germany Export Prices 3.8% Jul 08/09/2010 06:00 Germany Import Prices 1.9% Jul 08/09/2010 06:00 Germany International Trade Balance mm 12.5b 12.3b Jul 08/09/2010 08:30 U.K. Industrial Production mm -0.5% Jul 08/09/2010 08:30 U.K. Industrial Production yy 1.3% Jul 08/09/2010 12:30 Canada Building Permits 6.5% Jul 08/09/2010 13:00 Canada Interest Rate Decision 1.0% 0.75% Sep 08/09/2010 14:00 Canada Services PMI 54.0 Aug 08/09/2010 19:00 USA Consumer Credit mm -2.5b -1.34b Jul 09/09/2010 04:30 Australia Non-Farm Payroll 23500 Aug 09/09/2010 04:30 Australia Unemployment Rate 5.3% Aug 09/09/2010 05:00 Japan Consumer Confidence 43.3 Aug 09/09/2010 06:00 Germany Core HICP mm 0.0% 0.3% Aug 09/09/2010 06:00 Germany Core HICP yy 0.9% 1.2% Aug 09/09/2010 08:30 U.K. International Trade Balance mm -7.401 Jul 09/09/2010 11:00 U.K. Interest Rate Decision 0.5% 0.5% Sep 09/09/2010 12:15 Canada Housing Starts yy 189.2k Aug 09/09/2010 12:30 USA Initial Jobless Claims 472.0k L/W 09/09/2010 12:30 USA Initial Jobless Claims 485.5h L/W 09/09/2010 12:30 Canada Export Prices 33.5b Jul 09/09/2010 12:30 Canada Import Prices 34.63b Jul 09/09/2010 12:30 Canada House Prices 0.1% Jul 09/09/2010 12:30 Canada International Trade Balance mm -1.13b Jul 09/09/2010 23:50 Japan Gross Domestic Product (GDP) yy 0.1% Q2 10/09/2010 08:30 U.K. Core PPI mm 0.2% Jul 10/09/2010 08:30 U.K. Core PPI yy 4.7% Jul 10/09/2010 08:30 U.K. Producer Price Index (PPI) yy -1.0% Jul 10/09/2010 08:30 U.K. Producer Price Index (PPI) yy 10.8% Jul 10/09/2010 11:00 Canada Non-Farm Payroll -9.3k Aug 10/09/2010 11:00 Canada Unemployment Rate 8.0% Aug 10/09/2010 14:00 USA Wholsale Inventories 0.4% 0.1% Jul 10/09/2010 14:00 USA Wholesale Trade 0.2% -0.7% Jul Results for the week of: 29/08/2010 - 03/09/2010 29 August 2010 - 3 September 2010 * GMT time Date Hour Country Event Result Forecast Previous Period 29/08/2010 01:45 Australia International Trade Balance mm -10.0m 276.0m Jul 29/08/2010 01:45 New Zealand International Trade Balance mm 0.81b 0.64b Jul 29/08/2010 08:25 U.K. Manufacturing PMI 56.5 57.3 Aug 29/08/2010 17:10 Israel ADP employment 30/08/2010 00:00 U.K. Market Holiday 30/08/2010 04:30 Australia Building Permits -0.7% -3.3% Jul 30/08/2010 09:00 Europe Consumer Confidence -12.0 -14.0 Aug 30/08/2010 09:00 Europe Industrial Sentiment -4.0 -4.0 Aug 30/08/2010 09:00 Europe Service Sentiment 6.0 6.0 Aug 30/08/2010 12:30 USA Personal Consumption 0.3% 0.0% Jul 30/08/2010 12:30 USA Core PCE mm 0.1% 0.0% Jul 30/08/2010 12:30 USA Core PCE yy 1.4% Jul 30/08/2010 12:30 USA Personal Consumption Exp. mm -0.1% Jul 30/08/2010 12:30 USA Personal Consumption Exp. yy 1.4% Jul 30/08/2010 12:30 Canada Current Account -0.9b Q2 30/08/2010 12:30 Canada Core PPI mm -0.9% Jul 30/08/2010 12:30 Canada Core PPI yy 0.2% Jul 30/08/2010 23:00 U.K. GFK Consumer Sentiment -24 -22 Jul 30/08/2010 23:15 Japan Manufacturing PMI 52.8 Aug 30/08/2010 23:50 Japan Retail Sales yy 3.5% 3.2% Jul 31/08/2010 04:30 Australia Retail Sales mm 0.4% 0.2% Jul 31/08/2010 05:00 Japan Construction Spending -10.2 Jul 31/08/2010 05:00 Japan Housing Starts yy 2.9% 0.6% Jul 31/08/2010 08:00 Germany Unemployment Rate 7.6% 7.6% Aug 31/08/2010 08:00 Germany Unemployment Rate 3.2m 3.192m Aug 31/08/2010 08:30 U.K. Consumer Credit mm 0.0b -0.098b Jul 31/08/2010 09:00 Europe Unemployment Rate 10.0% 10.0% Jul 31/08/2010 12:30 Canada Gross Domestic Product (GDP) mm 0.1% Jun 31/08/2010 12:30 Canada ADP employment 6.1% Q2 31/08/2010 13:00 USA House Prices 1.3% Jun 31/08/2010 13:00 USA House Prices 0.1% 0.5% Jun 31/08/2010 13:00 USA House Prices 3.9% 4.6% Jun 31/08/2010 13:45 USA Chicago PMI 58.5 62.3 Aug 31/08/2010 13:45 USA Non-Farm Payroll 56.6 Aug 31/08/2010 13:45 USA New orders XD 64.6 Aug 31/08/2010 14:00 USA Consumer Confidence 51.0 50.4 Aug 01/09/2010 04:30 Australia Gross Domestic Product (GDP) qq 1.0% 0.5% Q2 01/09/2010 04:30 Australia Gross Domestic Product (GDP) yy 2.9% 2.7% Q2 01/09/2010 07:30 Swiss Services PMI 66.0 66.9 Aug 01/09/2010 07:50 Germany Manufacturing PMI 58.5 58.2 Aug 01/09/2010 12:15 USA ADP employment 20.0K 42.0K Aug 01/09/2010 14:00 USA Manufacturing PMI 53.5 55.5 Aug 01/09/2010 18:40 USA Consumer Spending -0.4% 0.1% Jul 01/09/2010 18:55 Europe Manufacturing PMI 55.0 55.0 Aug 02/09/2010 04:30 Australia International Trade Balance mm 3100m 3539m Jul 02/09/2010 05:45 Swiss Gross Domestic Product (GDP) qq 0.7% 1% Q2 02/09/2010 05:45 Swiss Gross Domestic Product (GDP) yy 2.3% Q2 02/09/2010 06:00 U.K. House Prices -0.3% -0.5% Aug 02/09/2010 07:15 Swiss Retail Sales mm 0.9% Jul 02/09/2010 07:30 U.K. Manufacturing PMI 58.4 Aug 02/09/2010 09:00 Europe Gross Domestic Product (GDP) qq 1.0% 1.0% Q2 02/09/2010 09:00 Europe Gross Domestic Product (GDP) yy 1.7% 1.7% Q2 02/09/2010 09:00 Europe Core PPI mm 3.0% 0.3% Jul 02/09/2010 09:00 Europe Core PPI yy 4.0% 3.0% Jul 02/09/2010 11:45 Europe Interest Rate Decision 1.0% 1.0% Sep 02/09/2010 11:45 USA Initial Jobless Claims 473.0k L/W 02/09/2010 14:00 USA Durable Goods Orders -3.8% Jul 02/09/2010 14:00 USA Durable Goods Orders 0.3% Jul 02/09/2010 14:00 USA New orders XD 0.3% Jul 02/09/2010 14:00 USA Factory Orders yy 1.4% -1.2% Jul 02/09/2010 14:00 USA Pending Homes Sales 75.7 02/09/2010 14:00 USA Pending Homes Sales 0.4% -2.6% Jul 03/09/2010 07:15 Swiss Consumer Price Index (CPI) mm 0.1% -0.7% Aug 03/09/2010 07:15 Swiss Consumer Price Index (CPI) yy 0.4% 0.4% Aug 03/09/2010 07:50 Germany Services PMI 58.5 58.5 Aug 03/09/2010 07:50 Europe Services PMI 55.6 55.6 Aug 03/09/2010 07:50 U.K. Services PMI 52.9 53.1 Aug 03/09/2010 09:00 Europe Retail Sales mm 0.2% 0.0% Jul 03/09/2010 09:00 Europe Retail Sales yy 0.5% 0.4% Jul 03/09/2010 12:30 USA Unemployment Rate 9.6% 6.5% Aug 03/09/2010 12:30 USA Non-Farm Payroll -108.0k -131.0k Aug 03/09/2010 14:00 USA Services PMI 57.0 57.4 Aug Results for the week of: 22/08/2010 - 27/08/2010 22 August 2010 - 27 August 2010 * GMT Time Date Hour Country Event Result Forecast Previous Period 23/08/2010 07:30 Germany Manufacturing PMI 60.8 61.2 Aug 23/08/2010 07:55 Europe Manufacturing PMI 56.3 56.7 Aug 23/08/2010 14:00 Israel Consumer Confidence -14.1 Aug 23/08/2010 15:10 Europe Services PMI 55.5 55.8 Aug 24/08/2010 06:00 Germany Gross Domestic Product (GDP) yy 2.2% Q2 24/08/2010 06:00 Germany Gross Domestic Product (GDP) qq 2.2% Q2 24/08/2010 09:00 Europe Factory Orders yy 22.7% Jun 24/08/2010 09:00 Europe Factory Orders mm 3.8% Jun 24/08/2010 12:30 Canada Core Retail Sales mm Jun 24/08/2010 12:30 Canada Retail Sales mm -0.2% 24/08/2010 14:00 USA Existing Home Sales (Units) 4.8m 5.37m Jul 24/08/2010 23:50 Japan Export Prices 27.7% Jul 24/08/2010 23:50 Japan Import Prices 26.1% Jul 24/08/2010 23:50 Japan International Trade Balance mm 687.0b 25/08/2010 08:00 Germany IFO Business Climate: index 105.8 106.2 Aug 25/08/2010 12:30 USA New orders XD -0.1% Jul 25/08/2010 12:30 USA Durable Goods Orders 3.0% -1.2% Jul 25/08/2010 14:00 USA House Prices 0.5% Jul 25/08/2010 14:00 USA Yearly house prices -1.2% Jul 25/08/2010 14:00 USA New Home sales 0.3m 0.33m Jul 25/08/2010 14:00 USA Building Permits 0.565m Jul 26/08/2010 01:30 Israel Building Permits 1.0% 6.7% Q2 26/08/2010 06:00 Germany GFK Consumer Sentiment 4.1% 3.9% Sep 26/08/2010 06:00 Germany Import Prices -0.2% 0.9% Jul 26/08/2010 12:30 USA Initial Jobless Claims 500k L/W 26/08/2010 23:30 Japan House hold Spending 0.5% Jul 26/08/2010 23:30 Japan Core CPI yy -0.1% Jul 26/08/2010 23:30 Japan Unemployment Rate 5.3% Jul 27/08/2010 00:00 Germany HICP mm 0.0% 0.3% 27/08/2010 00:00 Germany HICP yy 1.0% 1.2% 27/08/2010 00:00 Germany Consumer Price Index (CPI) mm 0.0% Aug 27/08/2010 00:00 Germany Consumer Price Index (CPI) yy 1.0% 1.2% Aug 27/08/2010 08:30 U.K. Gross Domestic Product (GDP) yy 1.6% Q2 27/08/2010 08:30 U.K. Gross Domestic Product (GDP) qq 1 27/08/2010 08:30 U.K. Gross Domestic Product (GDP) qq 1.1% Q2 27/08/2010 09:30 Swiss KOF Purchasing Manager ind 2.21 2.23 Aug 27/08/2010 12:30 USA Gross Domestic Product (GDP) yy 1.4% 2.4% Q2 27/08/2010 14:10 USA Fed Chairman Bernanke Speaks Results for the week of: 15/08/2010 - 20/08/2010 15 August 2010 - 20 August 2010 * GMT Time Date Hour Country Event Result Forecast Previous Period 15/08/2010 23:50 Japan Gross Domestic Product (GDP) yy 2.3% 5% Q2 15/08/2010 23:50 Japan Gross Domestic Product (GDP) qq 0.6% 1.2% Q2 16/08/2010 09:00 Europe Core HICP mm -0.5% 0.1% Jul 16/08/2010 09:00 Europe Core HICP yy 0.1% 0.9% Jul 16/08/2010 09:00 Israel ADP employment -0.4% 0% Jul 16/08/2010 09:00 Europe HICP yy 1.7% 1.4% Jul 16/08/2010 12:30 USA New-York Fed Survey 8 5.08 Aug 16/08/2010 13:00 USA Capital Flow 17.5b Jun 17/08/2010 01:30 Australia Protocol of last interest rate meeting 17/08/2010 08:00 Europe Current Account -5.8b Jun 17/08/2010 08:00 Europe Capital Flow 46.7b Jun 17/08/2010 08:30 U.K. Consumer Price Index (CPI) mm -0.2% 0.1% Jul 17/08/2010 08:30 U.K. Consumer Price Index (CPI) yy 3.1% 3.2% Jul 17/08/2010 08:30 U.K. Retail Price Index (RPI) mm -0.2% 0.2% Jul 17/08/2010 08:30 U.K. Retail Price Index (RPI) yy 4.9% 5% Jul 17/08/2010 08:30 U.K. RPI ex. Mortgage (RPIX) mm -0.2% 0.2% Jul 17/08/2010 08:30 U.K. RPI ex. Mortgage (RPIX) yy 4.8% 5% Jul 17/08/2010 09:00 Germany ZEW Economic Sentiment 21 21.2 Aug 17/08/2010 12:30 USA Building Permits 0.58m 0.583m Jul 17/08/2010 12:30 USA Housing Starts yy 0.56m 0.549m Jul 17/08/2010 12:30 USA Producer Price Index (PPI) yy 4.2% 2.8% Jul 17/08/2010 12:30 USA Producer Price Index (PPI) mm 0.2% -0.5% Jul 17/08/2010 12:30 USA Core PPI mm 0.1% 0.1% Jul 17/08/2010 12:30 USA Core PPI yy 1.3% 1.1% Jul 17/08/2010 12:30 Canada Manufacturing Shipments 0.4% Jun 17/08/2010 13:15 USA Capacity Utilization 74.5% 74.1% Jul 17/08/2010 13:15 USA Industrial Production mm 0.5% 0.1% Jul 18/08/2010 08:30 U.K. Protocol of last interest rate meeting 18/08/2010 22:45 New Zealand Producer Price Index (PPI) mm 0.6% 1.3% Q2 19/08/2010 06:00 Germany Producer Price Index (PPI) mm 0.1% 0.6% Jul 19/08/2010 06:00 Germany Producer Price Index (PPI) yy 3.3% 1.7% Jul 19/08/2010 06:15 Swiss International Trade Balance mm 1770m Jul 19/08/2010 08:30 U.K. M3 Money Supply yy 0% Jul 19/08/2010 08:30 U.K. Retail Sales mm 0.4% 0.7% Jul 19/08/2010 08:30 U.K. Retail Sales yy 0.6% 1.3% Jul 19/08/2010 09:00 Swiss ZEW Economic Sentiment 2.2 Aug 19/08/2010 10:00 Germany CBI Sales -14 Aug 19/08/2010 12:30 USA Initial Jobless Claims 478k 484k L/W 19/08/2010 12:30 Canada Leading Economic Indicators 1% Jul 19/08/2010 12:30 Canada Wholesale Trade -0.1% Jun 19/08/2010 14:00 USA Leading Economic Indicators 0.2% -0.2% Jul 19/08/2010 14:00 USA Philadelphia Fed Survey 7 5.1 Aug 20/08/2010 11:00 Canada Core CPI mm -0.1% Jul 20/08/2010 11:00 Canada Consumer Price Index (CPI) mm -0.1% Jul 20/08/2010 11:00 Canada Consumer Price Index (CPI) yy 1% Jul 20/08/2010 17:00 Canada Core CPI yy 1.7% Jul Results for the week of: 08/08/2010 - 13/08/2010 8 August 2010 - 13 August 2010 * GMT Time Date Hour Country Event Result Forecast Previous Period 08/08/2010 23:50 Japan Current Account 1.6% -8.1% Jun 09/08/2010 06:00 Germany International Trade Balance mm 12.6b 10.6b Jun 10/08/2010 04:00 Japan Interest Rate Decision 0.1% 0.1% Aug 10/08/2010 05:45 Swiss Consumer Confidence 14.0 Q3 10/08/2010 06:00 Germany Consumer Price Index (CPI) mm 0.2% 0.2% Jul 10/08/2010 06:00 Germany Consumer Price Index (CPI) yy 1.1% 1.1% Jul 10/08/2010 06:00 Germany HICP mm 0.3% 0.3% Jul 10/08/2010 06:00 Germany HICP yy 1.2% 1.2% Jul 10/08/2010 06:00 Germany Wholesale Price Index (WPI) mm -0.2% Jul 10/08/2010 06:00 Germany Wholesale Price Index (WPI) yy 5.1% Jul 10/08/2010 08:30 U.K. International Trade Balance mm -7.83b -8.062b Jul 10/08/2010 12:15 Canada Housing Starts yy 189.3k Jul 10/08/2010 12:30 USA Productivity and Costs 0.6% 2.8% Q2 10/08/2010 12:30 Canada House Prices 0.3% Jun 10/08/2010 14:00 USA IBD Consumer Sentiment 44.7 Aug 10/08/2010 14:00 USA Wholsale Inventories 0.5% 0.5% Jun 10/08/2010 14:00 USA Wholesale Trade 0.5% -0.3% Jun 10/08/2010 23:50 Japan Machinery Orders mm 5.5% -9.1% Jun 11/08/2010 00:30 Australia Consumer Confidence 11.1% Aug 11/08/2010 08:30 U.K. Initial Jobless Claims -18.0k -20.8k Jul 11/08/2010 08:30 U.K. Unemployment Rate 7.8% 7.8% Jun 11/08/2010 09:30 U.K. Bank of England Quarterly Inflation Report 11/08/2010 12:30 USA International Trade Balance mm -42.5b -42.27 Jun 11/08/2010 12:30 USA International Trade Balance mm -0.5b Jun 11/08/2010 18:00 USA Budget -170.0b -180.68b Jul 12/08/2010 01:30 Australia Non-Farm Payroll 20000 45900 Jul 12/08/2010 05:00 Japan Consumer Confidence 43.5 Jul 12/08/2010 09:00 Europe Industrial Production mm 0.6% 0.9% Jun 12/08/2010 09:00 Israel Industrial Production yy 9.3% 9.4% Jun 12/08/2010 12:30 USA Export Prices 0.0% -0.2% Jul 12/08/2010 12:30 USA Import Prices 0.1% -1.3% Jul 12/08/2010 12:30 USA Initial Jobless Claims 479.0k L/W 12/08/2010 22:45 New Zealand Core Retail Sales mm -0.2% Jun 12/08/2010 22:45 New Zealand Retail Sales mm 0.4% Jun 12/08/2010 22:45 New Zealand Retail Sales yy 1.9% Jun 12/08/2010 23:30 Japan Tankan Survey 12.0 Aug 13/08/2010 06:00 Germany Gross Domestic Product (GDP) qq 1.3% 0.2% Q2 13/08/2010 06:00 Germany Gross Domestic Product (GDP) yy 2.4% 1.7% Q2 13/08/2010 07:15 Swiss Producer Price Index (PPI) mm -0.4% Jul 13/08/2010 07:15 Swiss Producer Price Index (PPI) yy 0.9% Jul 13/08/2010 09:00 Europe International Trade Balance yy -3.4b Jun 13/08/2010 09:00 Europe Gross Domestic Product (GDP) qq 0.7% 0.2% Q2 13/08/2010 09:00 Europe Gross Domestic Product (GDP) yy 1.4% 0.6% Q2 13/08/2010 12:30 USA Consumer Price Index (CPI) mm 0.3% -0.1% Jul 13/08/2010 12:30 USA Consumer Price Index (CPI) yy 1.2% 1.1% Jul 13/08/2010 12:30 USA Core CPI mm 0.2% 0.2% Jul 13/08/2010 12:30 USA Core CPI yy 1.0% 0.9% Jul 13/08/2010 12:30 USA Core Retail Sales mm 0.3% -0.1% Jul 13/08/2010 12:30 USA Retail Sales mm 0.4% -0.5% Jul 13/08/2010 13:55 USA U.Michigan Consumer Sentiment 68.0 67.8 Jun 13/08/2010 14:00 USA Business Inventories 0.4% 0.1% Jun Results for the week of: 02/08/2010 - 06/08/2010 2 August 2010 - 6 August 2010 * GMT Time Date Hour Country Event Result Forecast Previous Period 02/08/2010 00:00 Canada Market Holiday Jun 02/08/2010 07:15 Swiss Retail Sales mm 3.8% Jun 02/08/2010 07:30 Swiss Manufacturing PMI 65.1 65.7 Jun 02/08/2010 07:50 Germany Manufacturing PMI 61.2 61.2 Jul 02/08/2010 07:50 Europe Manufacturing PMI 56.5 56.5 Jul 02/08/2010 08:25 U.K. Manufacturing PMI 57.0 57.5 Jul 02/08/2010 14:00 USA Construction Spending -0.5% -0.2% Jun 02/08/2010 14:00 USA Manufacturing PMI 54.0 56.2 Jul 03/08/2010 01:30 Australia Building Permits 2.0% -6.6% Jun 03/08/2010 01:30 Australia Retail Sales mm 0.3% 0.2% Jun 03/08/2010 04:30 Australia Interest Rate Decision 4.5% 4.5% Aug 03/08/2010 07:15 Swiss Consumer Price Index (CPI) mm -0.5% -0.4% Jul 03/08/2010 07:15 Swiss Consumer Price Index (CPI) yy 0.7% 0.5% Jul 03/08/2010 09:00 Europe Producer Price Index (PPI) mm 0.4% 0.3% Jun 03/08/2010 09:00 Europe Producer Price Index (PPI) yy 3.1% 3.1% Jun 03/08/2010 12:30 USA Personal Consumption 0.1% 0.2% Jan 03/08/2010 12:30 USA Core PCE mm 0.1% 0.2% Jun 03/08/2010 12:30 USA Core PCE yy 1.3% Jun 03/08/2010 12:30 USA Personal Consumption Exp. mm 0.0% Jun 03/08/2010 12:30 USA Personal Income 0.1 0.4% Jun 03/08/2010 14:00 USA Durable Goods Orders -0.1% Jun 03/08/2010 14:00 USA New orders XD -0.7% Jun 03/08/2010 14:00 USA Pending Homes Sales 0.6% -30.0% Jun 04/08/2010 01:45 New Zealand Non-Farm Payroll 6.4% 6.0% Q2 04/08/2010 04:30 Australia International Trade Balance mm 1800M 1654M Jun 04/08/2010 07:50 Germany Services PMI 57.3 57.3 Jul 04/08/2010 07:50 Europe Services PMI 56.0 56.0 Jul 04/08/2010 08:25 U.K. Services PMI 54.4 54.4 Jul 04/08/2010 09:00 Europe Retail Sales mm 0.1% 0.3% Jun 04/08/2010 09:00 Europe Retail Sales yy 0.1% 0.3% Jun 04/08/2010 12:15 USA ADP employment 35K 13K Jul 04/08/2010 14:00 USA Manufacturing PMI 53 53.8 Jul 05/08/2010 10:00 Germany Factory Orders mm 1.5% -0.5% Jun 05/08/2010 11:00 U.K. Interest Rate Decision 0.5% 0.5% Aug 05/08/2010 12:30 USA Initial Jobless Claims 454K 457K L/W 05/08/2010 12:30 Canada Building Permits -10.8% Jun 05/08/2010 12:45 Europe Interest Rate Decision 1.0% 1.0% Aug 06/08/2010 05:45 Swiss Unemployment Rate 3.9% 3.9% Jul 06/08/2010 08:30 U.K. Industrial Production mm 0.4 0.3% Jun 06/08/2010 08:30 U.K. Industrial Production yy 4.0% 4.3% Jun 06/08/2010 08:30 U.K. Core PPI mm 0.1 -0.3% Jun 06/08/2010 08:30 U.K. Core PPI yy 4.5% 4.8% Jun 06/08/2010 10:00 Germany Industrial Production mm 0.7% 2.6% Jun 06/08/2010 11:00 Canada Non-Farm Payroll 93.2K Jul 06/08/2010 11:00 Canada Unemployment Rate 7.9% Jul 06/08/2010 12:30 USA Non-Farm Payroll -75K -125K Jul 06/08/2010 12:30 USA Unemployment Rate 9.6? 9.5? Jul 06/08/2010 14:00 Canada Services PMI 58.9 Jul 06/08/2010 19:00 USA Consumer Credit mm -5.0B -9.15B Jul Results for the week of: 26/07/2010 - 30/07/2010 26 July 2010 - 30 July 2010 * GMT Time Date Hour Country Event Result Forecast Previous Period 26/07/2010 01:30 Australia Personal Consumption Exp. mm 0.8% 1.0% Q2 26/07/2010 01:30 Australia Core PPI yy 1.5% -0.1% Q2 26/07/2010 14:00 USA New Home sales 0.32m 0.30m Jun 27/07/2010 06:00 Germany GFK Consumer Sentiment 3.5 3.5 27/07/2010 10:00 U.K. CBI Sales 0.0 -5.0 Jul 27/07/2010 13:00 USA House Prices 3.8% May 27/07/2010 14:00 USA Consumer Confidence 52.8 52.9 28/07/2010 01:30 Australia Consumer Price Index (CPI) mm 1.0% 0.9% Q2 28/07/2010 01:30 Australia Consumer Price Index (CPI) yy 3.4% 2.9% Q2 28/07/2010 12:30 USA New orders XD -0.5% Jun 28/07/2010 12:30 USA Durable Goods Orders 0.7% -0.6% Jun 28/07/2010 21:00 New Zealand Interest Rate Decision 3.0% 2.75% Jul 28/07/2010 23:50 Japan Retail Sales yy 3.2% 2.8% Jun 29/07/2010 08:00 Germany Unemployment Rate 7.6% 7.7% Jul 29/07/2010 08:30 U.K. Consumer Credit mm 0.3b 0.33b Jun 29/07/2010 09:00 Europe Economic Sentiment 98.9 98.7 Jul 29/07/2010 12:30 USA Initial Jobless Claims 464.0k L/W 29/07/2010 12:30 Canada Core PPI mm 0.3% Jun 29/07/2010 12:30 Canada Core PPI yy 1.4% Jun 29/07/2010 23:00 U.K. GFK Consumer Sentiment -20.0 -19.0 Jul 29/07/2010 23:30 Japan House hold Spending -0.6% -0.7% Jun 29/07/2010 23:30 Japan Core CPI yy -1.2% -1.1% Jun 29/07/2010 23:30 Japan Core CPI mm -0.9% Jun 29/07/2010 23:30 Japan Unemployment Rate 5.2% 5.2% Jun 30/07/2010 06:00 Germany Retail Sales mm -0.7% 0.4% Jun 30/07/2010 06:00 Germany Retail Sales yy -2.4% Jun 30/07/2010 09:00 Europe Core HICP yy 1.8% 1.4% Jul 30/07/2010 09:00 Europe Unemployment Rate 10.0% 10.0% Jun 30/07/2010 09:30 Swiss KOF Purchasing Manager ind 2.3% 2.25% Jul 30/07/2010 12:30 USA Core PCE qq 1.0% 0.7% Q2 30/07/2010 12:30 USA Gross Domestic Product (GDP) qq 3.0% 2.7% Q2 30/07/2010 12:30 Canada Gross Domestic Product (GDP) mm 0.0% May 30/07/2010 13:45 USA Chicago PMI 57.5 59.1 Jul 30/07/2010 13:55 USA U.Michigan Consumer Sentiment 66.5 66.5 Jul Results for the week of: 18/07/2010 - 23/07/2010 19 July 2010 - 23 July 2010 * GMT Time Date Hour Country Event Result Forecast Previous Period 19/07/2010 08:00 Europe Current Account -5.1b May 19/07/2010 08:00 Europe Capital Flow 18.5b May 19/07/2010 11:50 Japan Market Holiday 20/07/2010 01:30 Australia Protocol of last interest rate meeting 20/07/2010 06:00 Germany Producer Price Index (PPI) mm 0.2% 0.3% Jun 20/07/2010 06:00 Germany Producer Price Index (PPI) yy 1.1% 0.9% Jun 20/07/2010 06:15 Swiss International Trade Balance mm 818.0 Jun 20/07/2010 12:30 USA Building Permits 0.57m 0.574m Jun 20/07/2010 12:30 USA House Prices -10.0% Jun 20/07/2010 12:30 USA Housing Starts yy 0.57m 0.593m Jun 21/07/2010 08:30 U.K. Retail Sales mm 0.6% Jun 21/07/2010 08:30 U.K. Retail Sales yy 2.2% Jun 21/07/2010 11:00 U.K. Protocol of last interest rate meeting 21/07/2010 12:30 Canada Wholesale Trade -0.3% May 22/07/2010 07:25 Germany Services PMI 54.5 54.8 Jun 22/07/2010 07:25 Germany Manufacturing PMI 58.0 58.4 Jun 22/07/2010 07:55 Europe Manufacturing PMI 55.2 55.6 Jul 22/07/2010 07:55 Europe Services PMI 55.1 55.5 Jul 22/07/2010 09:00 Europe Factory Orders mm 0.0% 0.9% May 22/07/2010 09:00 Europe Factory Orders yy 22.1% May 22/07/2010 12:30 USA Initial Jobless Claims 429.0k L/W 22/07/2010 12:30 Canada Core Retail Sales mm -1.2% May 22/07/2010 12:30 Canada Retail Sales mm -2.0% Mar 22/07/2010 14:00 USA Existing Home Sales (Units) 5.3m 5.66m Jul 22/07/2010 14:00 USA Leading Economic Indicators -0.2% 0.4% Jun 22/07/2010 14:00 USA House Prices 0.8% May 22/07/2010 14:00 USA Yearly house prices -1.5% May 22/07/2010 14:00 Europe Consumer Confidence -17.3 Jul 23/07/2010 01:30 Australia Export Prices 3.8% Q2 23/07/2010 01:30 Australia Import Prices 0.3% Q2 23/07/2010 08:00 Germany IFO Business Climate: index 101.5 101.8 Jul 23/07/2010 08:30 U.K. Gross Domestic Product (GDP) qq -0.8% Q2 23/07/2010 08:30 U.K. Gross Domestic Product (GDP) yy -5.6% Q2 23/07/2010 11:00 Canada Consumer Price Index (CPI) mm 0.3% Jun 23/07/2010 11:00 Canada Core CPI yy 1.8% Jun 23/07/2010 11:00 Canada Consumer Price Index (CPI) mm 0.3% Jun 23/07/2010 11:00 Canada Consumer Price Index (CPI) yy 1.4% Jun Results for the week of: 12/07/2010 - 16/07/2010 12 July 2010 - 16 July 2010 Date Hour Country Event Result Forecast Previous Period 12/07/2010 08:30 U.K. Current Account -4.1b Q1 12/07/2010 08:30 U.K. Gross Domestic Product (GDP) yy -0.2% -0.2% Q1 12/07/2010 08:35 U.K. Gross Domestic Product (GDP) qq 0.3% 0.3% Q1 13/07/2010 01:45 New Zealand Core Retail Sales mm -0.3% May 13/07/2010 01:45 New Zealand Retail Sales yy 2.7% May 13/07/2010 05:00 Japan Consumer Confidence 42.8 Jan 13/07/2010 07:15 Swiss Producer Price Index (PPI) mm 0.3% Jun 13/07/2010 07:15 Swiss Producer Price Index (PPI) yy 1.4% Jun 13/07/2010 08:30 U.K. Unemployment Rate 7.9% May 13/07/2010 09:50 Germany ZEW Economic Sentiment 24.0 28.7 Jul 13/07/2010 12:30 USA International Trade Balance mm -39.5b -40.29b May 13/07/2010 12:30 Canada Export Prices 32.93b May 13/07/2010 12:30 Canada Import Prices 32.76b May 13/07/2010 12:30 Canada International Trade Balance mm 0.05b 0.18b May 13/07/2010 18:00 USA Budget -85.0 -94.33 Jun 13/07/2010 23:00 U.K. Consumer Confidence 65.0 Jun 14/07/2010 03:30 Australia Consumer Confidence -5.7% Jul 14/07/2010 09:00 Europe Industrial Production mm 0.8% May 14/07/2010 09:00 Europe Factory Orders yy 9.5% May 14/07/2010 09:00 Europe Core HICP mm 0.1% Jun 14/07/2010 09:00 Europe Core HICP yy 0.9% Jun 14/07/2010 09:00 Europe HICP mm 0.0% 0.1% Jun 14/07/2010 09:00 Europe HICP yy 1.4% 1.4% Jun 14/07/2010 12:30 USA Export Prices 0.1% 0.7% Jun 14/07/2010 12:30 USA Import Prices 0.1% -0.6% Jun 14/07/2010 12:30 USA Retail Sales mm 0.0% -1.2% Jun 14/07/2010 12:30 USA Core Retail Sales mm 0.0% -1.1 Jun 14/07/2010 12:30 USA Core PPI yy 1.1% 1.3% Jun 14/07/2010 14:00 USA Business Inventories 0.5% 0.4% May 14/07/2010 18:00 USA Protocol of last interest rate meeting 15/07/2010 00:00 Japan Interest Rate Decision 0.1% Jul 15/07/2010 01:45 New Zealand Consumer Price Index (CPI) mm 0.4% Q2 15/07/2010 09:00 Swiss ZEW Economic Sentiment 17.5 Jul 15/07/2010 12:30 USA Initial Jobless Claims 454.0k L/W 15/07/2010 12:30 USA Producer Price Index (PPI) yy 1.1% 1.3% Jun 15/07/2010 12:30 USA Producer Price Index (PPI) mm -0.1% -0.3% Jun 15/07/2010 12:30 USA Core PPI mm 0.1% 0.2% Jun 15/07/2010 12:30 Canada Manufacturing Shipments 0.2% May 15/07/2010 13:15 USA Capacity Utilization 74.2% 74.1% Jun 15/07/2010 13:15 USA Industrial Production mm 0.1% 1.3% Jun 15/07/2010 14:00 USA Philadelphia Fed Survey 11.5% 8.0% Jul 16/07/2010 09:00 Europe International Trade Balance yy 1.8b May 16/07/2010 12:30 USA Consumer Price Index (CPI) mm 0.0% -0.2% Jun 16/07/2010 12:30 USA Consumer Price Index (CPI) yy 1.2% 2.0% Jun 16/07/2010 12:30 USA Core CPI mm 0.1% 0.1% Jun 16/07/2010 12:30 USA Core CPI yy 0.9% 0.9% Jun 16/07/2010 12:30 Canada Leading Economic Indicators 0.9% Jun 16/07/2010 13:55 USA U.Michigan Consumer Sentiment 74.0 76.0 Jul Results for the week of: 05/07/2010 - 9/07/2010 5 July 2010 - 9 July 2010 * GMT Time Date Hour Country Event Result Forecast Previous Period 05/07/2010 00:00 USA Market Holiday 05/07/2010 07:15 Swiss Retail Sales mm 3.8% 1.3% May 05/07/2010 07:50 Germany Services PMI 54.8 54.6 54.6 Jun 05/07/2010 07:55 Europe Services PMI 55.5 55.4 55.4 Jun 05/07/2010 08:25 U.K. Services PMI 54.4 55.0 55.4 Jun 05/07/2010 09:00 Europe Retail Sales mm 0.2% 0.4% -1.2% May 05/07/2010 09:00 Europe Retail Sales yy 0.3% -0.3% -1.5% May 06/07/2010 04:30 Australia International Trade Balance mm 1645m 500m 134m May 06/07/2010 04:30 Australia Interest Rate Decision 4.5% 4.5% 4.5% Jul 06/07/2010 07:15 Swiss Consumer Price Index (CPI) mm -0.4% 0.0% -0.1% Jun 06/07/2010 07:15 Swiss Consumer Price Index (CPI) yy 0.5% 1.0% 1.1% Jun 06/07/2010 12:30 Canada Building Permits -10.8% -2.0% 5.4% May 07/07/2010 09:00 Europe Gross Domestic Product (GDP) qq 0.2% 0.2% 0.2% Q1 07/07/2010 09:00 Europe Gross Domestic Product (GDP) yy 0.6% 0.6% 0.5% Q1 07/07/2010 10:00 Germany Factory Orders mm -0.5% 0.5% 2.8% May 07/07/2010 14:00 Canada Services PMI 58.9 62.7 Jun 07/07/2010 23:50 Japan Current Account -8.1% 1.3% 88.0% May 07/07/2010 23:50 Japan Machinery Orders mm -9.1% -3.1% 4.0% May 08/07/2010 01:30 Australia Non-Farm Payroll 45900 17500 26900 Jun 08/07/2010 01:30 Australia Unemployment Rate 5.1% 5.2% 5.2% Jun 08/07/2010 05:45 Swiss Unemployment Rate 3.9% 3.9% 4.0% Jun 08/07/2010 06:00 Germany International Trade Balance mm 10.6b 13.5b 13.1b May 08/07/2010 08:00 U.K. House Prices -0.6% 0.2% -0.4% Jun 08/07/2010 08:30 U.K. Industrial Production mm 0.7% 0.4% -0.4% May 08/07/2010 08:30 U.K. Industrial Production yy 2.6% 3.10% 2.10% May 08/07/2010 10:00 Germany Industrial Production mm 2.6% 0.9% 0.9% May 08/07/2010 11:00 U.K. Interest Rate Decision 0.5% 0.5% 0.5% Jul 08/07/2010 11:45 Europe Interest Rate Decision 1.0% 1.0% 1.0% Jul 08/07/2010 12:30 USA Initial Jobless Claims 454.0k 460.0k 472.0k L/W 08/07/2010 12:30 Canada House Prices 0.3% 0.3% 0.3% May 08/07/2010 19:00 USA Consumer Credit mm -9.15b -2.0b 1.0b May 09/07/2010 06:00 Germany Consumer Price Index (CPI) mm 0.1% 0.1% 0.1% Jun 09/07/2010 06:00 Germany Consumer Price Index (CPI) yy 0.9% 0.9% 0.9% Jun 09/07/2010 06:00 Germany HICP mm 0.0% 0.0% 0.0% Jun 09/07/2010 06:00 Germany HICP yy 0.8% 0.8% 0.8% Jun 09/07/2010 08:30 U.K. Core PPI mm -0.3% 0.1% 0.1% Jun 09/07/2010 08:30 U.K. Core PPI yy 4.8% 5.1% 4.4% Jun 09/07/2010 08:30 U.K. Producer Price Index (PPI) mm -0.2% 0.0% -0.6% Jun 09/07/2010 08:30 U.K. Producer Price Index (PPI) yy 10.7% 10.4% 11.2% Jun 09/07/2010 08:30 U.K. International Trade Balance mm -8.062b -7.0b -7.2b May 09/07/2010 11:00 Canada Non-Farm Payroll 93.2k 15.0k 24.7k Jun 09/07/2010 11:00 Canada Unemployment Rate 7.9% 8.1% 8.1% Jun 09/07/2010 12:15 Canada Housing Starts yy 189.3 190.5k 189.1k Jun 09/07/2010 14:00 USA Wholsale Inventories 0.5% 0.4% 0.4% May 09/07/2010 14:00 USA Wholesale Trade -0.3% 0.5% 0.7% May Results for the week of: 27/06/2010 - 02/07/2010 27 June 2010 - 2 July 2010 * GMT Time 27/06/2010 23:50 Japan Retail Sales yy 2.8% 4.6% 4.9% May 28/06/2010 08:00 Europe M3 Money Supply yy 0.1% -0.1% May 28/06/2010 12:30 USA Personal Consumption 0.2% 0% May 28/06/2010 12:30 USA Core PCE mm 0.1% 0.1% May 28/06/2010 12:30 USA Core PCE yy 1.2% May 28/06/2010 12:30 USA Personal Consumption Exp. mm 0% May 28/06/2010 12:30 USA Personal Consumption Exp. yy 2% May 28/06/2010 12:30 USA Personal Income 0.4% 0.4% May 28/06/2010 16:00 USA Mid-West Mnfg Activity 85.2 May 28/06/2010 22:45 New Zealand Building Permits 8.5% May 28/06/2010 23:30 Japan House hold Spending 0.5% -0.7% May 28/06/2010 23:30 Japan Unemployment Rate 5% 5.1% May 29/06/2010 08:30 U.K. Consumer Credit mm 0 -0.136b May 29/06/2010 09:00 Europe Economic Sentiment 98.2 98.4 Jun 29/06/2010 09:00 Europe Industrial Sentiment -7 -6 Jun 29/06/2010 09:00 Europe Service Sentiment 3 3 Jun 29/06/2010 12:30 Canada Producer Price Index (PPI) mm 0.3% May 29/06/2010 12:30 Canada Producer Price Index (PPI) yy -0.4% May 29/06/2010 13:00 USA House Prices 3.4% 2.3% Apr 29/06/2010 14:00 USA Consumer Confidence 62.9 63.3 Jun 29/06/2010 23:00 U.K. GFK Consumer Sentiment -19 -18 Jun 29/06/2010 23:15 Japan Manufacturing PMI 54.7 Jun 30/06/2010 05:00 Japan Construction Spending -25% May 30/06/2010 05:00 Japan Housing Starts yy 5% 0.6% May 30/06/2010 06:00 U.K. House Prices 9% 9.8% Jun 30/06/2010 08:00 Germany Unemployment Rate 7.7% 7.7% Jun 30/06/2010 08:30 U.K. Current Account -5.5B Q1 30/06/2010 08:30 U.K. Gross Domestic Product (GDP) qq 0.3% 0.3% Q1 30/06/2010 08:30 U.K. Gross Domestic Product (GDP) yy -0.2% -0.2% Q1 30/06/2010 09:00 Europe HICP yy 1.5% 1.6% Jun 30/06/2010 09:30 Swiss KOF Purchasing Manager ind 2.2 2.16 Jun 30/06/2010 12:15 USA ADP employment 59k 55k Jun 30/06/2010 12:30 Canada Gross Domestic Product (GDP) mm 0.6% Apr 30/06/2010 13:45 USA Chicago PMI 59.5 59.7 Jun 30/06/2010 23:50 Japan Tankan Survey 4.9 -0.4 Q2 01/07/2010 00:00 Canada Market Holiday 01/07/2010 01:30 Australia Building Permits 0% -14.8% May 01/07/2010 01:30 Australia Retail Sales mm 0.2% 0.6% May 01/07/2010 06:00 Germany Retail Sales mm 0.6% 1% May 01/07/2010 06:00 Germany Retail Sales yy -3.1% May 01/07/2010 07:30 Swiss Manufacturing PMI 64.5 66.4 Jun 01/07/2010 07:50 Germany Manufacturing PMI 58.1 Jun 01/07/2010 07:55 Europe Manufacturing PMI 55.6 55.6 Jun 01/07/2010 08:25 U.K. Manufacturing PMI 57.5 58 Jun 01/07/2010 12:30 USA Initial Jobless Claims 457k L/W 01/07/2010 14:00 USA Construction Spending -0.5% 2.7% May 01/07/2010 14:00 USA Services PMI 59 59.7 Jun 01/07/2010 14:00 USA Pending Homes Sales -10% 6% May 02/07/2010 09:00 Europe Producer Price Index (PPI) mm 0.3% 0.9% May 02/07/2010 09:00 Europe Producer Price Index (PPI) mm 3.1% 2.8% May 02/07/2010 09:00 Europe Unemployment Rate 10.1% 10.1% May 02/07/2010 12:30 USA Non-Farm Payroll -100k 431k Jun 02/07/2010 14:00 USA New orders XD -0.5% May 02/07/2010 14:00 USA Durable Goods Orders -1.1% May 02/07/2010 14:00 USA Factory Orders yy -0.4% 1.2% May Results for the week of: 21/06/2010 - 25/06/2010 21 June 2010 - 25 June 2010 * GMT Time Date Hour Country Event Result Forecast Previous Period 21/06/2010 EUR Italian Current Account (euros) (APR) -5284 21/06/2010 04:30 JPY All Industry Activity Index (MoM) (APR) 1.8% 2.0% -0.7% (R+) 21/06/2010 05:30 JPY Tokyo Department Store Sales (YoY) (MAY) -1.8% -4.9% 21/06/2010 05:30 JPY Nationwide Department Store Sales (YoY) (MAY) -2.1% -3.7% 21/06/2010 07:00 CHF Money Supply M3 (YoY) (MAY) 7.1% 5.4% 22/06/2010 06:15 Swiss International Trade Balance mm 2.022b May 22/06/2010 08:00 Germany IFO Business Climate: index 101.1 101.5 Jun 22/06/2010 08:00 Europe Current Account 1.7b Apr 22/06/2010 08:00 Europe Capital Flow -37.8b Apr 22/06/2010 11:00 Canada Core CPI mm 0.3% May 22/06/2010 11:00 Canada Core CPI yy 1.8% May 22/06/2010 14:00 USA Existing Home Sales (Units) 6.07m 5.77m May 22/06/2010 14:00 Europe Consumer Confidence -17.5 Jun 22/06/2010 14:00 USA Richmond Fed srvs 8.0 Jun 23/06/2010 01:45 New Zealand Gross Domestic Product (GDP) yy 1.8% 0.4% Q1 23/06/2010 01:45 New Zealand Gross Domestic Product (GDP) qq 0.6% 0.8% Q1 23/06/2010 06:00 Germany GFK Consumer Sentiment 3.3 3.5 Jul 23/06/2010 07:25 Germany Services PMI 54.5 54.8 Jun 23/06/2010 07:25 Germany Manufacturing PMI 58.0 58.4 Jun 23/06/2010 07:25 Europe Manufacturing PMI 55.4 55.8 Jun 23/06/2010 07:25 Europe Services PMI 56.0 56.2 Jun 23/06/2010 11:00 USA RPI ex. Mortgage (RPIX) yy 21.1% 23/06/2010 12:30 Canada Core Retail Sales mm 1.7% Apr 23/06/2010 12:30 Canada Retail Sales mm 2.1% Apr 23/06/2010 14:00 USA New Home sales 0.47m 0.50m May 23/06/2010 18:15 USA Interest Rate Decision 0.25% 0.25% 23/06/2010 23:50 Japan Export Prices 40.4% May 23/06/2010 23:50 Japan Import Prices 24.2% May 23/06/2010 23:50 Japan International Trade Balance mm 742.3b May 24/06/2010 01:45 New Zealand International Trade Balance mm 870.0m 656.0m May 24/06/2010 06:00 Germany Import Prices 0.2% 2.0% May 24/06/2010 09:00 Europe Factory Orders mm 5.2% Apr 24/06/2010 09:00 Europe Factory Orders yy 19.8% Apr 24/06/2010 12:30 USA New orders XD 3.4% May 24/06/2010 12:30 USA Durable Goods Orders -0.9% 2.8% May 24/06/2010 12:30 USA Initial Jobless Claims 472.0k L/W 24/06/2010 15:00 USA KC Fed 5.0 24/06/2010 23:30 Japan Core CPI yy -1.5% May 24/06/2010 23:30 Japan Core CPI mm -1.2% May 25/06/2010 12:30 USA Core PCE qq 0.6% 0.6% Q1 25/06/2010 12:30 USA Gross Domestic Product (GDP) qq 1.1% 1.1% Q1 25/06/2010 13:55 USA U.Michigan Consumer Sentiment 75.0 75.5 Jun 25/06/2010 15:30 USA Building Permits 0.574m May Results for the week of:13/06/2010 - 18/06/2010 13 June 2010 - 18 June 2010 Date Hour Country Event Result Forecast Previous Period 13/06/2010 22:45 New Zealand Retail Sales mm 0.0% 0.5% Apr 13/06/2010 22:45 New Zealand Core Retail Sales mm --0.2% 1.1% Apr 13/06/2010 22:45 New Zealand Retail Sales yy 2.5% 4.4% Apr 14/06/2010 00:00 Australia Market Holiday 14/06/2010 07:15 Swiss Producer Price Index (PPI) mm 0.6% May 14/06/2010 07:15 Swiss Producer Price Index (PPI) yy 0.8% May 14/06/2010 09:00 Europe Industrial Production mm 0.6% 1.3% Apr 14/06/2010 09:00 Europe Industrial Production yy 6.9% Apr 15/06/2010 01:30 Australia Protocol of last interest rate meeting 15/06/2010 08:30 U.K. Industrial Production mm 0.4% 2.0% Apr 15/06/2010 08:30 U.K. Industrial Production yy 2.2% 2.0% Apr 15/06/2010 08:30 U.K. Manufacturing PMI 0.5% 2.3% Apr 15/06/2010 09:00 Germany ZEW Economic Sentiment 45.1 45.8 Q1 15/06/2010 09:00 Europe International Trade Balance yy 0.1% 1.2% Apr 15/06/2010 12:30 USA Export Prices 0.1% 1.2% May 15/06/2010 12:30 USA Import Prices -0.8% 0.9% May 15/06/2010 12:30 Canada Manufacturing Shipments 1.2% Apr 15/06/2010 12:30 USA New-York Fed Survey 20 19.11 Jun 15/06/2010 13:00 USA Capital Flow 10.5b Apr 16/06/2010 08:30 U.K. Initial Jobless Claims -27.1k May 16/06/2010 08:30 U.K. Unemployment Rate 8.0% Apr 16/06/2010 09:00 Swiss ZEW Economic Sentiment 40.5 Jun 16/06/2010 09:00 Europe Core HICP mm 0.2% May 16/06/2010 09:00 Europe Core HICP yy 0.7% May 16/06/2010 12:30 USA Building Permits 0.62m 0.61m May 16/06/2010 12:30 USA Housing Starts yy 0.65m 0.672m May 16/06/2010 12:30 USA Producer Price Index (PPI) yy 4.8% 5.5% May 16/06/2010 12:30 USA Producer Price Index (PPI) mm -0.4% -0.1% May 16/06/2010 12:30 USA Core PPI mm 0.1% 0.2% May 16/06/2010 12:30 USA Core PPI yy 1.2% 1.0% May 16/06/2010 13:15 USA Capacity Utilization 74.3% 73.7% May 16/06/2010 13:15 USA Industrial Production mm 0.7% 0.8% May 16/06/2010 21:45 USA Fed Chairman Bernanke Speaks 16/06/2010 23:30 Japan Tankan Survey 4.0 Jun 17/06/2010 06:00 Germany Producer Price Index (PPI) yy 0.8% 0.6% May 17/06/2010 07:15 Swiss Factory Orders yy 1.4% Q1 17/06/2010 07:30 Swiss Interest Rate Decision 0.25% Q2 17/06/2010 08:30 U.K. Retail Sales mm 0.3% May 17/06/2010 08:30 U.K. Retail Sales yy 1.8% May 17/06/2010 12:30 USA Core CPI mm 0.1% 0.0% May 17/06/2010 12:30 USA Core CPI yy -0.1% -0.1% May 17/06/2010 12:30 USA Consumer Price Index (CPI) mm -0.1% -0.1% May 17/06/2010 12:30 USA Consumer Price Index (CPI) yy 2.0% 2.2% May 17/06/2010 12:30 USA Current Account -121.8 -115.5b Q1 17/06/2010 12:30 USA Initial Jobless Claims 456.0k L/W 17/06/2010 12:30 Canada Wholesale Trade 1.4% Apr 17/06/2010 14:00 USA Leading Economic Indicators 0.2% -0.1% May 17/06/2010 14:00 USA Philadelphia Fed Survey 22.0 21.4 Jun 18/06/2010 06:00 Germany Producer Price Index (PPI) mm 0.2% 0.8% May 18/06/2010 06:00 Germany Producer Price Index (PPI) yy 0.8% 0.6% May 18/06/2010 08:30 U.K. M3 Money Supply yy 8.847b May 18/06/2010 12:30 Canada Leading Economic Indicators 0.9% May Results for the week of: 06/06/2010 - 11/06/2010 6 June 2010 - 11 June 2010 * GMT Time Date Hour Country Event Result Forecast Previous Period 06/06/2010 13:55 Israel ADP employment 07/06/2010 00:00 New Zealand Market Holiday 07/06/2010 10:00 Germany Factory Orders mm 0.4% 5.0% Apr 07/06/2010 19:00 USA Consumer Credit mm 2.0b 1.95b Apr 07/06/2010 23:50 Japan Current Account 65.1% Apr 08/06/2010 05:00 Japan Leading Economic Indicators 4.4 Apr 08/06/2010 05:45 Swiss Initial Jobless Claims 4.0% May 08/06/2010 06:00 Germany Export Prices -2.0% 10.7% Apr 08/06/2010 06:00 Germany Import Prices 11.0% Apr 08/06/2010 06:00 Germany International Trade Balance mm 15.0b 13.3b Apr 08/06/2010 07:15 Swiss Consumer Price Index (CPI) mm 0.9% May 08/06/2010 07:15 Swiss Consumer Price Index (CPI) yy 1.4% May 08/06/2010 10:00 Germany Industrial Production mm 0.9% 4.0% Apr 08/06/2010 12:15 Canada Housing Starts yy 201.7k May 08/06/2010 14:00 USA IBD Consumer Sentiment 48.7 Jun 08/06/2010 23:50 Japan Machinery Orders mm 5.4% Apr 09/06/2010 00:30 Australia Consumer Confidence -7.0% Jun 09/06/2010 08:30 U.K. International Trade Balance mm -7.522b Apr 09/06/2010 14:00 USA Wholsale Inventories 0.6% 0.4% Apr 09/06/2010 14:00 USA Wholesale Trade 0.5% 2.4% Apr 09/06/2010 21:00 New Zealand Interest Rate Decision 2.75% 2.5% Jun 09/06/2010 23:50 Japan Gross Domestic Product (GDP) qq 4.9% Q1 10/06/2010 01:30 Australia Non-Farm Payroll 17.5k 33.7k May 10/06/2010 01:30 Australia Unemployment Rate 5.4% 5.4% May 10/06/2010 05:00 Japan Consumer Confidence 42.0 May 10/06/2010 06:00 Germany Consumer Price Index (CPI) mm 0.1% 0.1% May 10/06/2010 06:00 Germany Consumer Price Index (CPI) yy 1.2% 1.2% May 10/06/2010 06:00 Germany HICP mm 0.1% May 10/06/2010 06:00 Germany HICP yy 1.2% May 10/06/2010 11:00 U.K. Interest Rate Decision 0.5% 0.5% Jun 10/06/2010 11:45 Europe Interest Rate Decision 1.0% 1.0% Jun 10/06/2010 12:30 USA Initial Jobless Claims 453.0k L/W 10/06/2010 12:30 USA International Trade Balance mm -41.0b -40.42b Apr 10/06/2010 12:30 Canada Export Prices 33.53b Apr 10/06/2010 12:30 Canada Import Prices 33.28b Apr 10/06/2010 12:30 Canada House Prices 0.3% Apr 10/06/2010 12:30 Canada International Trade Balance mm 0.25b Apr 10/06/2010 18:00 USA Budget -140.0b -189.65b May 11/06/2010 08:30 U.K. Core PPI mm 1.1% May 11/06/2010 08:30 U.K. Core PPI yy 4.4% May 11/06/2010 08:30 U.K. Producer Price Index (PPI) yy 13.1% May 11/06/2010 08:30 U.K. Producer Price Index (PPI) mm 0.6% May 11/06/2010 12:30 USA Core Retail Sales mm 0.2% 0.4% May 11/06/2010 12:30 USA Retail Sales mm 0.2% 0.4% May 11/06/2010 13:55 USA U.Michigan Consumer Sentiment 74.0 73.6 11/06/2010 14:00 USA Business Inventories 0.4% 0.4% Apr Results for the week of: 30/05/2010 - 04/06/2010 30 May 2010 - 4 June 2010 * GMT Time Date Hour Country Event Result Forecast Previous Period 30/05/2010 23:05 Japan Manufacturing PMI 54.7 53.5 May 31/05/2010 00:00 USA Market Holiday 31/05/2010 00:00 U.K. Market Holiday 31/05/2010 05:00 Japan Housing Starts yy 0.6% 6.6% -2.4% Apr 31/05/2010 08:00 Europe M3 Money Supply yy -0.2% -0.1% Apr 31/05/2010 09:00 Europe Economic Sentiment 98.4 100.8 100.6 May 31/05/2010 09:00 Europe Industrial Sentiment -6.0 -6.0 -7.0 May 31/05/2010 09:00 Europe Core HICP yy 1.4% 1.6% 1.5% May 31/05/2010 09:00 Europe Service Sentiment 3.0 6.0 5.0 May 31/05/2010 12:30 Canada Gross Domestic Product (GDP) mm 0.6% 0.5% 0.3% Mar 31/05/2010 12:30 Canada Gross Domestic Product (GDP) yy 6.1% 5.9% -5.4% Q1 31/05/2010 12:30 Canada Gross Domestic Product (GDP) qq 1.5% 1.2% Q1 31/05/2010 12:30 Canada Core PPI mm -0.3% -0.1% -0.4% Apr 31/05/2010 12:30 Canada Core PPI yy -0.4% -1.3% Apr 01/06/2010 01:30 Australia Building Permits -14.8% 15.3% Apr 01/06/2010 01:30 Australia Retail Sales mm 0.6% 0.3% Apr 01/06/2010 04:30 Australia Interest Rate Decision 4.5% 4.5% 4.5% Jun 01/06/2010 05:45 Swiss Gross Domestic Product (GDP) qq 0.4% 0.6% 0.7% Q1 01/06/2010 05:45 Swiss Gross Domestic Product (GDP) yy 2.2% 1.7% 0.6% Q1 01/06/2010 06:00 Germany Retail Sales mm 1.0% 0.9% -2.4% Apr 01/06/2010 06:00 Germany Retail Sales yy -3.1% -1.4% 2.7% Apr 01/06/2010 07:30 Swiss Manufacturing PMI 66.4 64.2 65.9 May 01/06/2010 07:50 Germany Manufacturing PMI 58.4 58.3 58.3 May 01/06/2010 08:00 Europe Manufacturing PMI 55.8 55.9 55.9 May 01/06/2010 08:00 Germany Unemployment Rate 7.7% 7.8% 7.8% May 01/06/2010 08:30 U.K. Manufacturing PMI 58.0 57.8 58.0 May 01/06/2010 09:00 Europe Unemployment Rate 10.1% 10.1% 10.0% Apr 01/06/2010 13:00 Canada Interest Rate Decision 0.5% 0.5% 0.25% Jun 01/06/2010 14:00 USA Construction Spending 0.0% 0.2% Apr 01/06/2010 14:00 USA Manufacturing PMI 59.0 60.4 May 02/06/2010 01:30 Australia Gross Domestic Product (GDP) qq 0.9% Q1 02/06/2010 01:30 Australia Gross Domestic Product (GDP) yy 2.7% Q1 02/06/2010 07:15 Swiss Retail Sales mm 4.5% Apr 02/06/2010 08:30 U.K. Consumer Credit mm 0.4b 0.35b Apr 02/06/2010 09:00 Europe Core PPI mm 0.7% 0.6% Apr 02/06/2010 09:00 Europe Core PPI yy 2.6% 0.9% Apr 02/06/2010 14:00 USA Pending Homes Sales 3.3% 5.3% Apr 02/06/2010 23:50 Japan Business Confidence -17.3% Q1 03/06/2010 07:50 Germany Services PMI 53.7 55.2 May 03/06/2010 08:00 Europe Services PMI 56.0 55.6 May 03/06/2010 08:30 U.K. Services PMI 55.7 55.3 May 03/06/2010 09:00 Europe Retail Sales mm 0.1% 0.0% Apr 03/06/2010 09:00 Europe Retail Sales yy 0.1% -0.1% Apr 03/06/2010 12:15 USA ADP employment 51.0k 32.0k May 03/06/2010 12:30 USA Initial Jobless Claims 460.0k 03/06/2010 14:00 USA Durable Goods Orders 2.9% Apr 03/06/2010 14:00 USA New orders XD 3.4% Apr 03/06/2010 14:00 USA Factory Orders yy 1.0% 1.1% Apr 03/06/2010 14:00 USA Services PMI 55.6 55.4 May 04/06/2010 09:00 Europe Gross Domestic Product (GDP) qq 0.2% Q1 04/06/2010 09:00 Europe Gross Domestic Product (GDP) yy 0.5% Q1 04/06/2010 11:00 Canada Non-Farm Payroll 108.7k May 04/06/2010 11:00 Canada Unemployment Rate 8.1% May 04/06/2010 12:30 USA Non-Farm Payroll 425.0k 290.0k May 04/06/2010 12:30 USA Unemployment Rate 9.8% 9.9% May 04/06/2010 12:30 Canada Building Permits 12.2% Apr 04/06/2010 14:00 Canada Services PMI 58.7 May Results for the week of: 24/05/2010 - 28/05/2010 24 May 2010 - 28 May 2010 * GMT Time Date Hour Country Event Result Forecast Previous Period 24/05/2010 00:00 Canada Market Holiday 24/05/2010 00:00 Swiss Market Holiday 24/05/2010 14:00 USA Existing Home Sales (Units) 5.59m 5.35m Apr 25/05/2010 08:30 U.K. Gross Domestic Product (GDP) qq Q1 25/05/2010 08:30 U.K. Gross Domestic Product (GDP) yy Q1 25/05/2010 09:00 Europe Factory Orders mm 1.5% Mar 25/05/2010 09:00 Europe Factory Orders yy 12.2% 25/05/2010 13:00 USA House Prices 1.9% 0.6% Mar 25/05/2010 14:00 USA Consumer Confidence 59.1 57.9 May 25/05/2010 14:00 USA House Prices -3.4% Mar 25/05/2010 14:00 USA Richmond Fed srvs 9.0 Mar 25/05/2010 23:50 Japan Protocol of last interest rate meeting 26/05/2010 00:00 USA Building Permits 0.606m Apr 26/05/2010 00:30 Australia Leading Economic Indicators 0.5% Mar 26/05/2010 00:30 USA Fed Chairman Bernanke Speaks 26/05/2010 06:00 Germany GFK Consumer Sentiment 3.8 3.8 Jan 26/05/2010 12:30 USA New orders XD -0.7% Apr 26/05/2010 12:30 USA Durable Goods Orders 0.9% -1.2% Apr 26/05/2010 14:00 USA New Home sales 0.42m 0.411m Apr 26/05/2010 22:45 New Zealand International Trade Balance mm 455.0m 567.0m Apr 26/05/2010 23:50 Japan International Trade Balance mm 948.9b Apr 27/05/2010 07:15 Swiss Non-Farm Payroll 3.96m Q1 27/05/2010 12:30 USA Core PCE qq 0.6% 0.6% Q1 27/05/2010 12:30 USA Gross Domestic Product (GDP) qq 3.2% 3.2% Q1 27/05/2010 12:30 USA Initial Jobless Claims 471.0k L/W 27/05/2010 15:00 USA KC Fed 24 May 27/05/2010 22:45 New Zealand Building Permits -0.4% Apr 27/05/2010 23:30 Japan House hold Spending 4.4% Apr 27/05/2010 23:30 Japan Consumer Price Index (CPI) yy -1.9% May 27/05/2010 23:30 Japan Unemployment Rate 5.0% Apr 27/05/2010 23:50 Japan Retail Sales yy 4.7% Apr 28/05/2010 06:15 Swiss International Trade Balance mm 2007.0m Apr 28/05/2010 09:30 Swiss KOF Purchasing Manager ind 1.99 May 28/05/2010 12:30 USA Personal Consumption 0.3% 0.6% Apr 28/05/2010 12:30 USA Core PCE mm 0.1% 0.1% Apr 28/05/2010 12:30 USA Core PCE yy 1.3% Apr 28/05/2010 12:30 USA Personal Income 0.4% 0.3% Apr 28/05/2010 12:30 Canada Current Account -9.77b Q1 28/05/2010 13:45 USA Chicago PMI 63.0 63.8 Mar 28/05/2010 13:55 USA U.Michigan Consumer Sentiment 73.5 72.2 May Results for the week of: 16/05/2010 - 21/05/2010 16 May 2010 - 21 May 2010 * GMT Time Date Hour Country Event Result Forecast Previous Period 16/05/2010 23:50 Japan Machinery Orders mm -5.4% Mar 17/05/2010 12:30 USA New-York Fed Survey 30.0 31.86 May 17/05/2010 13:00 USA Capital Flow 9.0b Mar 17/05/2010 17:00 USA NAHB housing market INDEX 20.0 19.0 May 17/05/2010 22:45 New Zealand Producer Price Index (PPI) mm -0.4% Q1 17/05/2010 23:30 Japan Tankan Survey 0.0 May 18/05/2010 01:30 Australia Protocol of last interest rate meeting 18/05/2010 05:00 Japan Consumer Confidence 40.9 Apr 18/05/2010 08:30 U.K. Consumer Price Index (CPI) mm 0.6% Apr 18/05/2010 08:30 U.K. Consumer Price Index (CPI) yy 3.4% Apr 18/05/2010 08:30 U.K. Retail Price Index (RPI) mm 0.7% Apr 18/05/2010 08:30 U.K. Retail Price Index (RPI) yy 4.4% Apr 18/05/2010 08:30 U.K. RPI ex. Mortgage (RPIX) mm 0.7% Apr 18/05/2010 08:30 U.K. RPI ex. Mortgage (RPIX) yy 4.8% Apr 18/05/2010 09:00 Germany ZEW Economic Sentiment 50.5 53.0 May 18/05/2010 09:00 Europe International Trade Balance yy 2.6b Mar 18/05/2010 09:00 Europe Core HICP mm 0.3% 0.7% Apr 18/05/2010 09:00 Europe Core HICP yy 0.8% 0.9% Apr 18/05/2010 10:00 U.K. CBI Sales -36.0 May 18/05/2010 12:30 USA Building Permits 0.68m 0.68m Apr 18/05/2010 12:30 USA Housing Starts yy 0.643m 0.626m Apr 18/05/2010 12:30 USA Producer Price Index (PPI) mm 0.2% 0.7% Apr 18/05/2010 12:30 USA Core PPI mm 0.1% 0.1% Apr 18/05/2010 12:30 USA Core PPI yy 0.9% Apr 19/05/2010 00:30 Australia Consumer Confidence -1.0% May 19/05/2010 08:30 U.K. Protocol of last interest rate meeting 19/05/2010 12:30 USA Core CPI mm 0.1% 0.0% Apr 19/05/2010 12:30 USA Consumer Price Index (CPI) mm 0.1% 0.1% Apr 19/05/2010 12:30 USA Core CPI yy 1.0% 1.1% Apr 19/05/2010 12:30 USA Consumer Price Index (CPI) yy 2.4% 2.3% Apr 19/05/2010 12:30 Canada Wholesale Trade -1.2% Mar 19/05/2010 18:00 USA Protocol of last interest rate meeting 19/05/2010 23:50 Japan Gross Domestic Product (GDP) yy 3.8% Q1 19/05/2010 23:50 Japan Gross Domestic Product (GDP) qq 0.9% Q1 20/05/2010 03:00 New Zealand Consumer Confidence 0.0% 20/05/2010 04:00 Japan Protocol of last interest rate meeting 20/05/2010 06:00 Germany Producer Price Index (PPI) mm 0.5% 0.7% Apr 20/05/2010 06:00 Germany Producer Price Index (PPI) yy 0.3% -1.5% Apr 20/05/2010 08:30 U.K. Retail Sales mm 0.4% Apr 20/05/2010 08:30 U.K. Retail Sales yy 2.2% Apr 20/05/2010 09:00 Swiss ZEW Economic Sentiment 53.4 May 20/05/2010 12:30 USA Initial Jobless Claims 444.0k L/W 20/05/2010 12:30 Canada Leading Economic Indicators 1.0% Apr 20/05/2010 14:00 USA Leading Economic Indicators 0.2% 1.4% Apr 20/05/2010 14:00 USA Philadelphia Fed Survey 22.0 20.2 May 20/05/2010 14:00 Europe Consumer Confidence -15.2 May 21/05/2010 07:25 Germany Manufacturing PMI 61.5 61.5 May 21/05/2010 07:55 Europe Manufacturing PMI 57.3 57.6 May 21/05/2010 08:00 Germany IFO Business Climate: index 102 101.6 May 21/05/2010 08:00 Europe Current Account -3.9b Mar 21/05/2010 08:00 Europe Capital Flow 10.9b Mar 21/05/2010 08:30 U.K. M3 Money Supply yy 0.2% Apr 21/05/2010 08:30 U.K. Consumer Credit mm 23.498b Apr 21/05/2010 11:00 Canada Consumer Price Index (CPI) mm 0.0% Apr 21/05/2010 11:00 Canada Consumer Price Index (CPI) yy 1.4% Apr 21/05/2010 12:30 Canada Core Retail Sales mm -0.1% Mar 21/05/2010 12:30 Canada Retail Sales mm 0.5% Mar Results for the week of: 10/05/2010 - 14/05/2010 10 May 2010 - 14 May 2010 * GMT Time Date Hour Country Event Result Forecast Previous Period 10/05/2010 06:00 Germany Export Prices 2.3% 5.1% Mar 10/05/2010 06:00 Germany Import Prices 0.1% 0.2% Mar 10/05/2010 06:00 Germany International Trade Balance mm 14.5b 12.1b Mar 10/05/2010 11:00 U.K. Interest Rate Decision 0.5% 0.5% May 11/05/2010 05:45 Swiss Consumer Confidence -7.0 Q2 11/05/2010 06:00 Germany Consumer Price Index (CPI) mm -0.1% 0.5% Apr 11/05/2010 06:00 Germany Consumer Price Index (CPI) yy 1.0% 1.1% Apr 11/05/2010 06:00 Germany HICP mm -0.1% 0.6% Apr 11/05/2010 06:00 Germany HICP yy 1.0% 1.2% Apr 11/05/2010 08:30 U.K. Industrial Production mm 0.3% 1.0% Mar 11/05/2010 08:30 U.K. Industrial Production yy 0.5% -0.1% Mar 11/05/2010 14:00 USA IBD Consumer Sentiment 48.4 May 11/05/2010 14:00 USA Wholsale Inventories 0.5% 0.6% Mar 11/05/2010 14:00 USA Wholesale Trade 0.7% 0.8% Mar 12/05/2010 05:00 Japan Leading Economic Indicators 1.0 Mar 12/05/2010 07:15 Swiss Producer Price Index (PPI) mm 0.5% Apr 12/05/2010 07:15 Swiss Producer Price Index (PPI) yy 0.0% Apr 12/05/2010 09:00 Europe Gross Domestic Product (GDP) qq 0.2% Q1 12/05/2010 09:00 Europe Gross Domestic Product (GDP) yy 0.5% Q1 12/05/2010 09:00 Europe Industrial Production mm 1.0% 0.9% Mar 12/05/2010 09:00 Europe Industrial Production yy 6.1% 4.1% Mar 12/05/2010 12:30 USA International Trade Balance mm -40.0b -39.7b Mar 12/05/2010 12:30 Canada Export Prices 34.02b Mar 12/05/2010 12:30 Canada Import Prices 32.62b Mar 12/05/2010 12:30 Canada International Trade Balance mm 1.4b Mar 12/05/2010 18:00 USA Budget -20.91b Apr 12/05/2010 23:00 U.K. Consumer Confidence 72.0 Apr 12/05/2010 23:50 Japan Current Account 35.3% 29.6% Mar 13/05/2010 00:00 Swiss Market Holiday 13/05/2010 01:30 Australia Non-Farm Payroll 20k 19.6k Apr 13/05/2010 01:30 Australia Unemployment Rate 5.3% 5.3% Apr 13/05/2010 08:30 U.K. International Trade Balance mm -6.179b Mar 13/05/2010 12:30 USA Export Prices 0.5% 0.7% Apr 13/05/2010 12:30 USA Import Prices 0.8% 0.7% Apr 13/05/2010 12:30 USA Initial Jobless Claims 444.0k L/W 13/05/2010 22:45 New Zealand Core Retail Sales mm -0.9% Mar 13/05/2010 22:45 New Zealand Retail Sales mm -0.6% Mar 13/05/2010 22:45 New Zealand Retail Sales yy 2.4% Mar 14/05/2010 12:30 USA Core Retail Sales mm 0.5% 0.9% Apr 14/05/2010 12:30 USA Retail Sales mm 0.3% 1.9% Apr 14/05/2010 12:30 Canada Manufacturing Shipments 0.1% Mar 14/05/2010 13:15 USA Industrial Production mm 0.5% 0.1% Apr 14/05/2010 13:55 USA U.Michigan Consumer Sentiment 73.2 72.2 May Results for the week of: 03/05/2010 - 07/05/2010 3 May 2010 - 7 May 2010 Date Hour Country Event Result Forecast Previous Period 03/05/2010 00:00 U.K. Market Holiday 03/05/2010 00:00 Japan Market Holiday 03/05/2010 07:30 Swiss Manufacturing PMI 65.9 64.0 65.5 Apr 03/05/2010 07:50 Germany Manufacturing PMI 61.5 61.3 60.2 Apr 03/05/2010 08:00 Europe Manufacturing PMI 57.6 57.5 56.6 Apr 03/05/2010 12:30 USA Core PCE mm 0.1% 0.1% 0.0% Mar 03/05/2010 12:30 USA Core PCE yy 1.3% 1.3% Mar 03/05/2010 12:30 USA Personal Consumption Exp. mm 0.1% 0.0% Mar 03/05/2010 12:30 USA Personal Consumption Exp. yy 2.0% 1.8% Mar 03/05/2010 12:30 USA Personal Consumption 0.5% 0.3% Mar 03/05/2010 12:30 USA Personal Income 0.1% 0.1% 0.0% Mar 03/05/2010 14:00 USA Construction Spending 0.2% -0.3% -1.3% Mar 03/05/2010 14:00 USA Manufacturing PMI 60.4 60.0 59.6 Apr 04/05/2010 04:30 Australia Interest Rate Decision 4.25% May 04/05/2010 08:30 U.K. Consumer Credit mm 0.528b Mar 04/05/2010 09:00 Europe Producer Price Index (PPI) mm 0.1% Mar 04/05/2010 09:00 Europe Producer Price Index (PPI) yy -0.5% Mar 04/05/2010 14:00 USA Durable Goods Orders -1.3% Mar 04/05/2010 14:00 USA New orders XD -1.2% Mar 04/05/2010 14:00 USA Factory Orders yy 0.3% 0.6% Mar 04/05/2010 14:00 USA Pending Homes Sales 3.3% 8.2% Mar 05/05/2010 00:00 Japan Market Holiday 05/05/2010 01:30 Australia Building Permits -3.3% Mar 05/05/2010 07:50 Germany Manufacturing PMI 55.0 54.9 Apr 05/05/2010 08:00 Europe Manufacturing PMI 55.5 54.1 Apr 05/05/2010 09:00 Europe Retail Sales mm -0.6% Mar 05/05/2010 09:00 Europe Retail Sales yy -1.1% Mar 05/05/2010 12:15 USA ADP employment 25.0k -23.0k Apr 05/05/2010 14:00 USA Services PMI 56.0 55.4 Apr 05/05/2010 22:45 New Zealand Unemployment Rate 7.3% 7.3% Q1 06/05/2010 01:30 Australia Retail Sales mm -1.4% Mar 06/05/2010 01:30 Australia International Trade Balance mm -1924m Mar 06/05/2010 07:15 Swiss Consumer Price Index (CPI) mm 0.1% Apr 06/05/2010 07:15 Swiss Consumer Price Index (CPI) yy 1.4% Apr 06/05/2010 08:30 U.K. Services PMI 56.5 Apr 06/05/2010 10:00 Germany Factory Orders mm 1.0% 0.0% Mar 06/05/2010 11:45 Europe Interest Rate Decision 1.0% 1.0% May 06/05/2010 12:30 USA Initial Jobless Claims 448.0k L/W 06/05/2010 12:30 USA Productivity and Costs 2.7% 6.9% Q1 06/05/2010 12:30 Canada Building Permits -0.5% Mar 06/05/2010 13:30 USA Fed Chairman Bernanke Speaks 06/05/2010 14:00 Canada Services PMI 57.8 Apr 07/05/2010 01:30 Australia monetary policy report 07/05/2010 05:45 Swiss Unemployment Rate 4.1% Apr 07/05/2010 07:15 Swiss Retail Sales mm 3.1% Mar 07/05/2010 11:00 Canada Non-Farm Payroll 17.9k Apr 07/05/2010 11:00 Canada Unemployment Rate 8.2% Apr 07/05/2010 12:30 USA Non-Farm Payroll 175.0k 162.0k Apr 07/05/2010 12:30 USA Unemployment Rate 9.7% 9.7% Apr 07/05/2010 19:00 USA Consumer Credit mm -2.35b -11.51b Mar Results for the week of: 25/04/2010 - 30/04/2010 25 April 2010 - 30 April 2010 Date Hour Country Event Result Forecast Previous Period 25/04/2010 00:00 New Zealand Market Holiday 26/04/2010 06:00 Germany Import Prices 1.0% 1.0% Mar 27/04/2010 04:30 Australia Producer Price Index (PPI) mm -0.4? Q1 27/04/2010 04:30 Australia Producer Price Index (PPI) yy -1.5? Q1 27/04/2010 09:00 U.K. CBI Sales 15.0 13.0 Apr 27/04/2010 13:00 USA House Prices 0.5% -0.7% Feb 27/04/2010 14:00 USA Consumer Confidence 54.2% 52.5% Apr 27/04/2010 23:50 Japan Retail Sales yy 3.6% 4.2% Mar 28/04/2010 01:45 New Zealand International Trade Balance mm 321.0M Mar 28/04/2010 04:30 Australia Consumer Price Index (CPI) mm 169.5 Q1 28/04/2010 04:30 Australia Consumer Price Index (CPI) mm 0.8? 0.5? Q1 28/04/2010 04:30 Australia Consumer Price Index (CPI) yy 2.8% 2.1% Q1 28/04/2010 18:15 USA Interest Rate Decision 0.0% 0.25 29/04/2010 00:00 Japan Core CPI mm -1.1% Mar 29/04/2010 08:00 Germany Unemployment Rate 8.0% 8.0% Apr 29/04/2010 09:00 Europe Consumer Confidence -17.0 -17.0 Apr 29/04/2010 09:00 Europe Industrial Sentiment -8.0 -10.0 Apr 29/04/2010 12:30 USA Initial Jobless Claims 456K L/W 29/04/2010 23:00 U.K. GFK Consumer Sentiment -15.0 -15.0 Apr 29/04/2010 23:15 Japan Manufacturing PMI 52.4 Apr 29/04/2010 23:30 Japan House hold Spending 0.6% -0.5% Mar 29/04/2010 23:30 Japan Consumer Price Index (CPI) yy -1.2% -1.2% Mar 29/04/2010 23:30 Japan Consumer Price Index (CPI) yy -2.1% -1.8% Apr 29/04/2010 23:30 Japan Initial Jobless Claims 0.48% 0.47% Mar 30/04/2010 00:00 Japan Interest Rate Decision 0.1% 0.1% Apr 30/04/2010 05:00 Japan Factory Orders yy -20.3% Mar 30/04/2010 09:00 Europe HICP yy 1.5% 1.4% Apr 30/04/2010 09:00 Europe Unemployment Rate 10.0% 10.0% Mar 30/04/2010 09:30 Swiss KOF Purchasing Manager ind 1.96 1.93 Apr 30/04/2010 12:30 USA Gross Domestic Product (GDP) qq 3.5% 5.6% Q1 30/04/2010 12:30 USA Gross Domestic Product (GDP) qq 1.0% 0.5% Q1 30/04/2010 12:30 USA Gross Domestic Product (GDP) qq 1.7% 1.7% Q1 30/04/2010 12:30 USA Personal Consumption Exp. yy 1.6% 2.5% Q1 30/04/2010 12:30 Canada Gross Domestic Product (GDP) mm 0.6% Feb 30/04/2010 12:30 Canada Core PPI mm 0.0% Apr 30/04/2010 12:30 Canada Core PPI yy -0.6% Mar 30/04/2010 13:45 USA Chicago PMI 60.0 58.8 Apr 30/04/2010 13:55 USA U.Michigan Consumer Sentiment 73.6 Apr Results for the week of: 19/04/2010 - 23/04/2010 19 April 2010 - 23 April 2010 * GMT Time Date Hour Country Event Result Forecast Previous Period 19/04/2010 22:45 New Zealand Consumer Price Index (CPI) mm 0.6% -0.2% Q1 19/04/2010 22:45 New Zealand Consumer Price Index (CPI) yy 2.2% 2% Q1 20/04/2010 01:30 Australia Protocol of last interest rate meeting 20/04/2010 06:00 Germany Producer Price Index (PPI) mm 0.4% 0% Mar 20/04/2010 06:00 Germany Producer Price Index (PPI) mm -1.8% -2.9% Mar 20/04/2010 08:00 Europe Current Account -8.1b Feb 20/04/2010 08:00 Europe Capital Flow -11.2b Feb 20/04/2010 08:30 U.K. Consumer Price Index (CPI) mm 0.3% 0.4% Mar 20/04/2010 08:30 U.K. Consumer Price Index (CPI) yy 3.1% 3% Mar 20/04/2010 08:30 U.K. Retail Price Index (RPI) mm 0.4% 0.6% Mar 20/04/2010 08:30 U.K. Retail Price Index (RPI) yy 4.1% 3.7% Mar 20/04/2010 08:30 U.K. RPI ex. Mortgage (RPIX) mm 0.6% Mar 20/04/2010 08:30 U.K. RPI ex. Mortgage (RPIX) yy 4.4% 4.2% Mar 20/04/2010 09:00 Germany ZEW Economic Sentiment 45.2 44.5 Apr 20/04/2010 13:00 Canada Interest Rate Decision 0.25% May 21/04/2010 08:30 U.K. Initial Jobless Claims -5k -32.3k Mar 21/04/2010 08:30 U.K. Unemployment Rate 7.8% 7.8% Feb 21/04/2010 08:30 U.K. Protocol of last interest rate meeting 21/04/2010 12:30 Canada Wholesale Trade 3% Feb 21/04/2010 23:50 Japan International Trade Balance mm 651b Mar 22/04/2010 06:15 Swiss International Trade Balance mm 1291m Mar 22/04/2010 07:25 Germany Services PMI 55.1 54.7 Apr 22/04/2010 07:25 Germany Manufacturing PMI 60.1 59.6 Apr 22/04/2010 07:55 Europe Manufacturing PMI 56.7 56.3 Apr 22/04/2010 07:55 Europe Services PMI 54.3 53.7 Apr 22/04/2010 08:30 U.K. M3 Money Supply yy 0.2% Mar 22/04/2010 09:00 Swiss ZEW Economic Sentiment 53.8 Apr 22/04/2010 10:00 U.K. CBI Sales -37 Apr 22/04/2010 12:30 USA Initial Jobless Claims 484k L/W 22/04/2010 12:30 USA Producer Price Index (PPI) yy 5.8% 4.4% Mar 22/04/2010 12:30 USA Producer Price Index (PPI) mm 0.3% -0.6% Mar 22/04/2010 12:30 USA Core PPI mm 0.1% 0.1% Mar 22/04/2010 12:30 USA Core PPI yy 0.9% 1% Mar 22/04/2010 12:30 USA Leading Economic Indicators 0.8% Mar 22/04/2010 14:00 USA Existing Home Sales (Units) 5.21m 5.02m Mar 22/04/2010 14:00 USA House Prices -0.6% Feb 23/04/2010 08:00 Germany IFO Business Climate: index 98.1 98.1 Apr 23/04/2010 08:30 U.K. Gross Domestic Product (GDP) qq 0.4% Q1 23/04/2010 08:30 U.K. Gross Domestic Product (GDP) yy -0.1% Q1 23/04/2010 09:00 Europe Factory Orders yy 0.8% -2% Feb 23/04/2010 11:00 Canada Consumer Price Index (CPI) mm 0.4% Mar 23/04/2010 11:00 Canada Consumer Price Index (CPI) yy 1.6% Mar 23/04/2010 12:30 USA New orders XD 0.5% 2% Mar 23/04/2010 12:30 USA Durable Goods Orders 0.4% 0.9% Mar 23/04/2010 12:30 Canada Core Retail Sales mm 1.8% Feb 23/04/2010 12:30 Canada Retail Sales mm 0.7% Feb 23/04/2010 14:00 USA Existing Home Sales (Units) 0.32m 0.308m Mar Results for the week of: 12/04/2010 - 16/04/2010 12 April 2010 - 16 April 2010 * GMT Time Date Hour Country Event Result Forecast Previous Period 12/04/2010 12:15 Canada Housing Starts yy 196.7k Mar 12/04/2010 18:00 USA Budget -193.3b -191.59 Mar 13/04/2010 06:00 Germany Consumer Price Index (CPI) mm 0.5% 0.4% Mar 13/04/2010 06:00 Germany Consumer Price Index (CPI) yy 1.1% 0.6% Mar 13/04/2010 06:00 Germany HICP mm 0.6% 0.4% Mar 13/04/2010 06:00 Germany HICP yy 1.3% 0.5% Mar 13/04/2010 08:30 U.K. International Trade Balance mm -7.987 Feb 13/04/2010 12:30 USA Export Prices 0.2% -0.5% Apr 13/04/2010 12:30 USA Import Prices 0.9% -0.3% Mar 13/04/2010 12:30 USA International Trade Balance mm -38.6b -37.29b Feb 13/04/2010 12:30 Canada International Trade Balance mm 0.8b Feb 13/04/2010 12:30 Canada House Prices 0.4% Feb 13/04/2010 22:45 New Zealand Core Retail Sales mm 0.3% Feb 13/04/2010 22:45 New Zealand Retail Sales mm 0.8% Feb 13/04/2010 22:45 New Zealand Retail Sales yy 2.3% Feb 14/04/2010 00:30 Australia Consumer Confidence 0.2% Apr 14/04/2010 09:00 Europe Industrial Production mm 0.3% 1.7% Feb 14/04/2010 09:00 Europe Industrial Production yy 1.4% Feb 14/04/2010 12:25 USA Business Inventories 0.3% 0.0% Feb 14/04/2010 12:30 USA Core CPI mm 0.1% 0.1% Mar 14/04/2010 12:30 USA Consumer Price Index (CPI) mm 0.1% 0.0% Mar 14/04/2010 12:30 USA Core CPI yy 1.2% 1.3% Mar 14/04/2010 12:30 USA Consumer Price Index (CPI) yy 2.4% 2.1% Mar 14/04/2010 12:30 USA Core Retail Sales mm 0.4% 0.8% Mar 14/04/2010 12:30 USA Retail Sales mm 0.8% 0.3% Mar 14/04/2010 14:00 USA Business Inventories 0.3% 0% Feb 14/04/2010 14:00 USA Fed Chairman Bernanke Speaks 14/04/2010 18:00 USA Fed Beige Book 14/04/2010 23:30 Japan Tankan Survey -8.0 Apr 15/04/2010 09:00 Europe International Trade Balance yy -8.9b Feb 15/04/2010 12:30 USA Initial Jobless Claims 460.0 L/W 15/04/2010 13:00 USA Capital Flow -33.4b Feb 15/04/2010 13:15 USA Capacity Utilization 73.1% 72.7% Mar 15/04/2010 13:15 USA Industrial Production mm 0.4% 0.1% Mar 16/04/2010 07:15 Swiss Producer Price Index (PPI) mm -0.3% Apr 16/04/2010 07:15 Swiss Producer Price Index (PPI) yy -1.0% Mar 16/04/2010 09:00 Europe Core HICP mm 0.3% Mar 16/04/2010 09:00 Europe Core HICP yy 0.9% 0.8% Mar 16/04/2010 09:00 Europe HICP mm 0.9% 0.3% Mar 16/04/2010 09:00 Europe HICP yy 1.5% 0.9% Mar 16/04/2010 12:30 USA Building Permits 0.62m 0.637m Mar 16/04/2010 12:30 USA House Prices -5.9% Mar 16/04/2010 12:30 USA Housing Starts yy 0.59m 0.575m Mar Results for the week of: 05/04/2010 - 09/04/2010 5 April 2010 - 9 April 2010 * GMT time Date Hour Country Event Result Forecast Previous Period 05/04/2010 00:00 Swiss Market Holiday 05/04/2010 00:00 Germany Market Holiday 05/04/2010 00:00 U.K. Market Holiday 05/04/2010 00:00 New Zealand Market Holiday 05/04/2010 00:00 Australia Market Holiday 05/04/2010 14:00 USA Services PMI 55.2 54.8 Mar 05/04/2010 14:00 USA Pending Homes Sales -0.1% -7.6% Feb 06/04/2010 04:30 Australia Interest Rate Decision 4.25% 4.00% Apr 06/04/2010 05:00 Japan Leading Economic Indicators 2.4 Feb 06/04/2010 07:15 Swiss Consumer Price Index (CPI) mm 0.1% 0.1% Mar 06/04/2010 07:15 Swiss Consumer Price Index (CPI) yy 1.4% 0.9% Mar 07/04/2010 00:00 Japan Interest Rate Decision 0.1% 0.1% Apr 07/04/2010 07:15 Swiss Retail Sales mm 4.4% Feb 07/04/2010 08:25 U.K. Services PMI 58.0 58.4 Mar 07/04/2010 09:00 Europe Gross Domestic Product (GDP) qq 0.1% 0.4% Q4 07/04/2010 09:00 Europe Gross Domestic Product (GDP) yy -2.1% -4.1% Q4 07/04/2010 09:00 Europe Producer Price Index (PPI) mm 0.1% 0.7% Feb 07/04/2010 09:00 Europe Producer Price Index (PPI) yy -0.4% -1.0% Feb 07/04/2010 10:00 Germany Factory Orders mm -1.0% 4.3% Feb 07/04/2010 12:30 Canada Building Permits 2.0% -4.9% Feb 07/04/2010 14:00 Canada Services PMI 55.0 51.9 Mar 07/04/2010 17:30 USA Fed Chairman Bernanke Speaks 07/04/2010 19:00 USA Consumer Credit mm 1.3b 4.96b Feb 07/04/2010 23:50 Japan Current Account 42.8% Feb 07/04/2010 23:50 Japan Machinery Orders mm 3.7 -3.7% Feb 08/04/2010 01:30 Australia Non-Farm Payroll 20000 400 Mar 08/04/2010 05:45 Swiss Unemployment Rate 4.1% 4.1% Mar 08/04/2010 08:30 U.K. Industrial Production mm 0.5% -0.4% Feb 08/04/2010 08:30 U.K. Industrial Production yy -0.6% -1.5% Feb 08/04/2010 09:00 Europe Retail Sales mm 0.0% -0.3% Feb 08/04/2010 09:00 Europe Retail Sales yy -0.4% -1.3% Feb 08/04/2010 11:00 U.K. Interest Rate Decision 0.5% 0.5% Apr 08/04/2010 11:45 Europe Interest Rate Decision 1.0% 1.0% Apr 08/04/2010 12:30 USA Initial Jobless Claims 434.0k 439.0k L/W 09/04/2010 06:00 Germany Export Prices 3.8% -6.3% Feb 09/04/2010 06:00 Germany Import Prices 0.3% 6.0% Feb 09/04/2010 06:00 Germany International Trade Balance mm 11.0b 8.7b Feb 09/04/2010 08:30 U.K. Core PPI mm 0.3% 0.3% Mar 09/04/2010 08:30 U.K. Core PPI yy 3.1% 2.9% Mar 09/04/2010 08:30 U.K. Producer Price Index (PPI) yy 7.1% 6.9% Mar 09/04/2010 08:30 U.K. Producer Price Index (PPI) mm 1.3% 0.1% Mar 09/04/2010 11:00 Canada Non-Farm Payroll 25.0k 20.9k Mar 09/04/2010 11:00 Canada Unemployment Rate 8.2% 8.2% Mar 09/04/2010 14:00 USA Wholsale Inventories 0.4% -0.1% Feb 09/04/2010 14:00 USA Wholesale Trade 0.5% 1.2% Feb Results for the week of: 28/3/2010 - 04/4/2010 28 March 2010 - 4 April 2010 * GMT time Date Hour Country Event Result Forecast Previous Period 28/03/2010 23:50 Japan Retail Sales yy 4.2% 1.8% 2.6% Feb 29/03/2010 00:00 Germany Consumer Price Index (CPI) mm 0.2% 0.4% Mar 29/03/2010 00:00 Germany Consumer Price Index (CPI) yy 0.8% 0.6% Mar 29/03/2010 00:00 Germany HICP mm 0.4% Mar 29/03/2010 00:00 Germany HICP yy 0.5% Mar 29/03/2010 08:30 U.K. Consumer Credit mm 0.528b 0.4b 0.5b Feb 29/03/2010 09:00 Europe Consumer Confidence -17.0 -17.0 -17.0 Mar 29/03/2010 09:00 Europe Economic Sentiment 97.7 97.2 95.9 Mar 29/03/2010 09:00 Europe Industrial Sentiment -10 -11.0 -13.0 Mar 29/03/2010 12:30 USA Personal Consumption 0.3% 0.3% 0.5% Feb 29/03/2010 12:30 USA Core PCE mm 0.0% 0.1% 0.0% Feb 29/03/2010 12:30 USA Core PCE yy 1.3% 1.4% Feb 29/03/2010 12:30 USA Personal Consumption Exp. mm 0.0% 0.2% Feb 29/03/2010 12:30 USA Personal Consumption Exp. yy 1.8% 2.1% Feb 29/03/2010 12:30 USA Personal Income 0.0% 0.1% 0.1% Feb 29/03/2010 23:30 Japan Unemployment Rate 4.9% 4.9% Feb 30/03/2010 08:30 U.K. Gross Domestic Product (GDP) qq 0.4% 0.3% Q4 30/03/2010 08:30 U.K. Gross Domestic Product (GDP) yy 3.1% 3.3%- Q4 30/03/2010 12:30 Canada Producer Price Index (PPI) mm 0.0% 0.3% Feb 30/03/2010 12:30 Canada Producer Price Index (PPI) yy -0.6% 0.3%- Feb 30/03/2010 13:00 USA House Prices -0.4% 0.0% 0.2%- Jan 30/03/2010 14:00 USA Consumer Confidence 52.5 49.5 46.0 Mar 30/03/2010 23:15 Japan Manufacturing PMI 52.5 Mar 31/03/2010 08:00 Germany Unemployment Rate 8.2% Mar 31/03/2010 09:00 Europe Core HICP yy 1.0% 0.9% Mar 31/03/2010 09:00 Europe Unemployment Rate 9.9% Feb 31/03/2010 09:30 Swiss KOF Purchasing Manager ind 1.87 Mar 31/03/2010 12:15 USA ADP employment 20.0k 20.0k- Mar 31/03/2010 12:30 Canada Gross Domestic Product (GDP) mm 0.6% Jan 31/03/2010 13:45 USA Chicago PMI 61.6 62.6 Mar 31/03/2010 14:00 USA Durable Goods Orders 0.5% Feb 31/03/2010 14:00 USA New orders XD 1.6% Feb 31/03/2010 23:50 Japan Tankan Survey 13.8%- Q1 01/04/2010 00:30 Australia International Trade Balance mm -1176.0m Feb 01/04/2010 07:30 Swiss Manufacturing PMI 57.4 Mar 01/04/2010 07:55 Germany Manufacturing PMI 57.2 Mar 01/04/2010 08:00 Europe Manufacturing PMI 54.2 Mar 01/04/2010 08:30 U.K. Manufacturing PMI 56.6 Mar 01/04/2010 12:30 USA Initial Jobless Claims 442.0k L/W 01/04/2010 14:00 USA Construction Spending -1.1% -0.6% Feb 02/04/2010 00:00 USA Market Holiday 02/04/2010 00:00 Canada Market Holiday 02/04/2010 00:00 Swiss Market Holiday 02/04/2010 00:00 Germany Market Holiday 02/04/2010 00:00 U.K. Market Holiday 02/04/2010 00:00 Australia Market Holiday 02/04/2010 00:00 New Zealand Market Holiday 02/04/2010 12:30 USA Non-Farm Payroll 168.0k -36.0k Mar 02/04/2010 12:30 USA Unemployment Rate 9.7% 9.7% Mar Results for the week of: 22/03/2010 - 26/03/2010 22 March 2010 - 26 March 2010 * GMT time Date Hour Country Event Result Forecast Previous Period 22/03/2010 00:00 Japan Market Holiday 22/03/2010 15:00 Europe Consumer Confidence -17.4 Mar 22/03/2010 23:50 Japan Protocol of last interest rate meeting 23/03/2010 09:30 U.K. Consumer Price Index (CPI) mm 0.5% -0.2% Feb 23/03/2010 09:30 U.K. Consumer Price Index (CPI) yy 3.0% 3.5% Feb 23/03/2010 09:30 U.K. Retail Price Index (RPI) mm 0.6% 0.0% Feb 23/03/2010 09:30 U.K. Retail Price Index (RPI) yy 3.7% 3.7% Feb 23/03/2010 09:30 U.K. Core PPI mm 0.5% 0.0% Feb 23/03/2010 09:30 U.K. Core PPI yy 4.2% 4.6% Feb 23/03/2010 12:30 Canada Leading Economic Indicators 0.9% Feb 23/03/2010 14:00 USA Existing Home Sales (Units) 5.0m 5.05m Feb 23/03/2010 14:00 USA House Prices -1.5% Jan 23/03/2010 23:50 Japan International Trade Balance mm 85.2b Feb 24/03/2010 00:00 USA Building Permits -1.6% Feb 24/03/2010 08:25 Germany Services PMI 52.1 51.7 Mar 24/03/2010 08:25 Germany Manufacturing PMI 56.8 57.1 Mar 24/03/2010 08:55 Europe Manufacturing PMI 54.2 54.2 Mar 24/03/2010 08:55 Europe Services PMI 52.0 51.8 Mar 24/03/2010 09:00 Germany IFO Business Climate: index 95.8 95.2 Mar 24/03/2010 10:00 Europe Factory Orders mm 2.9% 0.8% Jan 24/03/2010 10:00 Europe Factory Orders yy 15.2% 9.5% Jan 24/03/2010 12:30 USA New orders XD 1.1% Feb 24/03/2010 12:30 USA Durable Goods Orders 0.0% 2.6% Feb 24/03/2010 14:00 USA New Home sales 0.32m 0.309m Feb 24/03/2010 21:45 New Zealand Gross Domestic Product (GDP) yy 0.3% -1.3% Q4 25/03/2010 07:00 Germany GFK Consumer Sentiment 3.1 3.2 Apr 25/03/2010 09:30 U.K. Retail Sales mm 0.6% -1.8% Feb 25/03/2010 09:30 U.K. Retail Sales yy 3.0% 0.9% Feb 25/03/2010 12:30 USA Initial Jobless Claims 457.0k L/W 25/03/2010 21:45 New Zealand International Trade Balance mm 480.0m 269.0m Feb 25/03/2010 23:30 Japan Core CPI mm -1.3% Feb 26/03/2010 07:45 USA Consumer Confidence -32.0 -33.0 Mar Results for the week of: 15/03/2010 - 19/03/2010 15 March 2010 - 19 March 2010 Date Hour Country Event Result Forecast Previous Period 15/03/2010 05:00 Japan Consumer Confidence 39.0 Feb 15/03/2010 08:15 Swiss Producer Price Index (PPI) mm 0.3% Feb 15/03/2010 08:15 Swiss Producer Price Index (PPI) yy -1.3% Feb 15/03/2010 12:30 USA New-York Fed Survey 22.0 24.91 Mar 15/03/2010 13:00 USA Capital Flow 60.9b Jan 15/03/2010 13:15 USA Capacity Utilization 72.6% 72.6% Feb 15/03/2010 13:15 USA Industrial Production mm 0.1% 0.9% Feb 16/03/2010 00:30 Australia Protocol of last interest rate meeting 16/03/2010 10:00 Germany ZEW Economic Sentiment 43.1 45.1 Mar 16/03/2010 10:00 Europe Core HICP mm 0.4% -1.3% Feb 16/03/2010 10:00 Europe Core HICP yy 0.8% 0.9% Feb 16/03/2010 10:00 Europe HICP mm 0.3% -0.8% Feb 16/03/2010 10:00 Europe HICP yy 0.9% 1.0% Feb 16/03/2010 12:30 USA Building Permits 0.61m 0.622m Feb 16/03/2010 12:30 USA Export Prices 0.3% 0.8% Feb 16/03/2010 12:30 USA House Prices 2.8% Feb 16/03/2010 12:30 USA Housing Starts yy 0.58m 0.591m Feb 16/03/2010 12:30 USA Import Prices 0.0% 1.4% Feb 16/03/2010 12:30 Canada Manufacturing Shipments 1.6% Jan 16/03/2010 18:15 USA Interest Rate Decision 0.25% Mar 17/03/2010 00:00 Japan Interest Rate Decision 0.1% 0.1% Mar 17/03/2010 09:30 U.K. Initial Jobless Claims 9.0k 23.5k Feb 17/03/2010 09:30 U.K. Unemployment Rate 7.8% 7.8% Jan 17/03/2010 10:30 U.K. Protocol of last interest rate meeting 17/03/2010 12:30 USA Producer Price Index (PPI) yy 5.2% 4.6% Feb 17/03/2010 12:30 USA Producer Price Index (PPI) mm -0.2% 1.4% Feb 17/03/2010 12:30 USA Core PPI mm 0.1% 0.3% Feb 17/03/2010 12:30 USA Core PPI yy 1.0% 1.0% Feb 17/03/2010 12:30 Canada Wholesale Trade 0.7% Jan 17/03/2010 23:30 Japan Tankan Survey -13.0 Mar 18/03/2010 07:15 Swiss International Trade Balance mm 2419.0m Feb 18/03/2010 08:15 Swiss Factory Orders yy -9.0% Q4 18/03/2010 09:00 Europe Current Account 1.9b Jan 18/03/2010 09:00 Europe Capital Flow 43.5b Jan 18/03/2010 10:00 Swiss ZEW Economic Sentiment 52.5 Mar 18/03/2010 10:00 Europe International Trade Balance yy 4.4b Jan 18/03/2010 11:00 U.K. CBI Sales -34.0 -36.0 Mar 18/03/2010 12:30 USA Core CPI mm 0.1% -0.1% Feb 18/03/2010 12:30 USA Consumer Price Index (CPI) mm 0.1% 0.2% Feb 18/03/2010 12:30 USA Core CPI yy 1.5% 1.6% Feb 18/03/2010 12:30 USA Consumer Price Index (CPI) yy 2.3% 2.6% Feb 18/03/2010 12:30 USA Current Account -120.0b -108.03b Q4 18/03/2010 12:30 USA Initial Jobless Claims 462.0k L/W 18/03/2010 14:00 USA Leading Economic Indicators 0.2% 0.3% Feb 19/03/2010 07:00 Germany Producer Price Index (PPI) mm 0.2% 0.8% Feb 19/03/2010 07:00 Germany Producer Price Index (PPI) yy -2.8% -3.4% Feb 19/03/2010 11:00 Canada Core CPI mm 0.1% Feb 19/03/2010 11:00 Canada Core CPI yy 2.0% Feb 19/03/2010 11:00 Canada Consumer Price Index (CPI) mm 0.3% Feb 19/03/2010 11:00 Canada Consumer Price Index (CPI) mm 0.3% Feb 19/03/2010 11:00 Canada Consumer Price Index (CPI) yy 1.9% Feb 19/03/2010 12:30 Canada Retail Sales mm 0.4% Jan Results for the week of: 07/03/2010 - 12/03/2010 7 March 2010 - 12 March 2010 * GMT time Date Hour Country Event Result Forecast Previous Period 07/03/2010 23:50 Japan Current Account 452.8% Jan 08/03/2010 06:45 Swiss Unemployment Rate 4.1% Feb 08/03/2010 08:15 Swiss Retail Sales mm 4.7% Jan 08/03/2010 11:00 Germany Industrial Production mm 1.2% 2.6%- Jan 08/03/2010 13:15 Canada Housing Starts yy 186.3k Feb 09/03/2010 01:30 Australia Consumer Confidence 2.6%- Mar 09/03/2010 02:30 Australia Business Confidence 15 Feb 09/03/2010 08:15 Swiss Consumer Price Index (CPI) mm 0.1%- Feb 09/03/2010 08:15 Swiss Consumer Price Index (CPI) yy 1.0% Feb 09/03/2010 09:30 U.K. Retail Sales mm 1.8%- Feb 09/03/2010 09:30 U.K. Retail Sales yy 0.9% Feb 09/03/2010 09:30 U.K. International Trade Balance mm 7.278b- Jan 09/03/2010 23:50 Japan Machinery Orders mm 4.1%- 20.1% Jan 10/03/2010 07:00 Germany Consumer Price Index (CPI) yy 0.4% 0.8% Feb 10/03/2010 07:00 Germany HICP mm 0.6%- Feb 10/03/2010 07:00 Germany HICP yy 0.8% Feb 10/03/2010 09:30 U.K. Manufacturing PMI 0.9% Jan 10/03/2010 09:30 U.K. Industrial Production yy 1.9%- Jan 10/03/2010 15:00 USA Wholsale Inventories 0.3% 0.8%- Jan 10/03/2010 15:00 USA Wholesale Trade 0.8% 0.8% Jan 10/03/2010 19:00 USA Budget -200b 193.86b- Feb 10/03/2010 22:00 New Zealand Interest Rate Decision 2.5% 2.5% 10/03/2010 23:50 Japan Gross Domestic Product (GDP) yy 4.1% 4.6% Q4 10/03/2010 23:50 Japan Gross Domestic Product (GDP) qq 1.0% 1.1% Q4 11/03/2010 02:30 Australia Non-Farm Payroll 15000 52700 Feb 11/03/2010 02:30 Australia Unemployment Rate 5.3% 5.3% Feb 11/03/2010 13:00 Swiss Interest Rate Decision 0.25% 0.25% Q1 11/03/2010 13:30 USA Initial Jobless Claims 469k L/W 11/03/2010 13:30 USA International Trade Balance mm 40.3b- 40.18b- Jan 11/03/2010 13:30 Canada Capacity Utilization 67.5% Q4 11/03/2010 13:30 Canada House Prices 0.4% Jan 11/03/2010 13:30 Canada International Trade Balance mm 0.25%- Jan 11/03/2010 23:45 New Zealand Core Retail Sales yy 1.8%- Jan 11/03/2010 23:45 New Zealand Retail Sales mm 0.0% Jan 11/03/2010 23:45 New Zealand Retail Sales yy 2.3% Jan 12/03/2010 04:30 Japan Capacity Utilization 1.4% Jan 12/03/2010 10:00 Europe Industrial Production mm 0.8% 1.7%- Jan 12/03/2010 10:00 Europe Industrial Production yy 5.0%- Jan 12/03/2010 12:00 Canada Non-Farm Payroll 43.0k Feb 12/03/2010 12:00 Canada Unemployment Rate 8.3% Feb 12/03/2010 13:30 USA Retail Sales mm 0.2% 0.6% Feb 12/03/2010 13:30 USA Retail Sales mm 0.0% 0.5% Feb 12/03/2010 14:55 Italy U.Michigan Consumer Sentiment 73.5 73.6 Mar 12/03/2010 15:00 USA Business Inventories 0.2% 0.2%- Jan Results for the week of: 01/03/2010 - 05/03/2010 1 March 2010 - 5 March 2010 * GMT time Date Hour Country Event Result Forecast Previous Period 01/03/2010 00:30 Australia Business Inventories 0.7% 0.8% Q4 01/03/2010 08:30 Swiss Manufacturing PMI 56.4 56.0 Feb 01/03/2010 08:50 Germany Manufacturing PMI 57.1 53.7 Feb 01/03/2010 09:00 Europe Manufacturing PMI 54.1 52.4 Feb 01/03/2010 09:30 U.K. Manufacturing PMI 56.0 56.7 Feb 01/03/2010 09:30 U.K. Consumer Credit mm -0.25b 0.052b Jan 01/03/2010 10:00 Europe Unemployment Rate 10.1% 10.0% Jan 01/03/2010 13:30 USA Personal Consumption 0.4% 0.2% Jan 01/03/2010 13:30 USA Core PCE mm 0.1% 0.1% Jan 01/03/2010 13:30 USA Core PCE yy 1.5% Jan 01/03/2010 13:30 USA Personal Consumption Exp. mm 0.1% Jan 01/03/2010 13:30 USA Personal Consumption Exp. yy 2.1% Jan 01/03/2010 13:30 USA Personal Consumption 0.1% Jan 01/03/2010 13:30 USA Personal Income 0.4% 0.4% Jan 01/03/2010 13:30 Canada Gross Domestic Product (GDP) mm 0.4% Dec 01/03/2010 13:30 Canada Gross Domestic Product (GDP) yy 0.4% Q4 01/03/2010 13:30 Canada Gross Domestic Product (GDP) qq 0.1% Q4 01/03/2010 13:30 Canada Producer Price Index (PPI) mm -0.1% Jan 01/03/2010 13:30 Canada Producer Price Index (PPI) yy -0.8% Jan 01/03/2010 15:00 USA Construction Spending -0.7% -1.2% Jan 01/03/2010 15:00 USA Manufacturing PMI 58.0 58.4 Feb 01/03/2010 23:30 Japan House hold Spending 2.5% 2.1% Jan 01/03/2010 23:30 Japan Unemployment Rate 5.2% 5.1% Jan 02/03/2010 00:30 Australia Building Permits 0.8% 2.2% Jan 02/03/2010 00:30 Australia Retail Sales mm 0.5% -0.7% Jan 02/03/2010 03:30 Australia Interest Rate Decision 4.0% 3.75% Mar 02/03/2010 06:45 Swiss Gross Domestic Product (GDP) qq 0.4% 0.3% Q4 02/03/2010 06:45 Swiss Gross Domestic Product (GDP) yy -0.3% -1.3% Q1 02/03/2010 10:00 Europe HICP yy 1.0% 1.0% Feb 02/03/2010 10:00 Europe Producer Price Index (PPI) mm 0.6% 0.1% Jan 02/03/2010 10:00 Europe Producer Price Index (PPI) yy -1.1% -2.9% Jan 02/03/2010 14:00 Canada Interest Rate Decision 0.25% 0.25% Mar 03/03/2010 00:30 Australia Gross Domestic Product (GDP) qq 0.9% 0.2% Q4 03/03/2010 00:30 Australia Gross Domestic Product (GDP) yy 2.4% 0.5% Q4 03/03/2010 08:50 Germany Manufacturing PMI 51.7 52.2 Feb 03/03/2010 08:50 Europe Manufacturing PMI 52.0 52.5 Feb 03/03/2010 09:30 U.K. Services PMI 54.1 54.5 Feb 03/03/2010 10:00 Europe Retail Sales mm -0.4% 0.0% Jan 03/03/2010 10:00 Europe Retail Sales yy -1.5% -1.6% Jan 03/03/2010 13:15 USA ADP employment 10.0k -22.0k Feb 03/03/2010 15:00 USA Services PMI 51.0 50.5 Feb 04/03/2010 00:30 Australia International Trade Balance mm -17m -2252m Jan 04/03/2010 10:00 Europe Gross Domestic Product (GDP) qq 0.1% 0.4% Q4 04/03/2010 10:00 Europe Gross Domestic Product (GDP) yy -2.1% -4.1% Q4 04/03/2010 12:00 U.K. Interest Rate Decision 0.5% 0.5% Mar 04/03/2010 12:45 Europe Interest Rate Decision 1.0% 1.0% Mar 04/03/2010 13:30 USA Initial Jobless Claims 496.0 L/W 04/03/2010 13:30 USA Productivity and Costs 6.2% 6.2% Q4 04/03/2010 13:30 Canada Building Permits 2.4% Jan 04/03/2010 13:35 USA Productivity and Costs 6.2% 6.2% Q4 04/03/2010 15:00 USA Durable Goods Orders 3.0% Jan 04/03/2010 15:00 USA New orders XD 1.6% Jan 04/03/2010 15:00 USA Factory Orders yy 1.0% 1.0% Jan 04/03/2010 15:00 USA Pending Homes Sales 1.9% 1.0% Jan 04/03/2010 15:00 Canada Services PMI 50.8 Feb 05/03/2010 09:30 U.K. Core PPI mm 0.3% Feb 05/03/2010 09:30 U.K. Core PPI mm 0.3% Feb 05/03/2010 09:30 U.K. Core PPI yy 2.5% Feb 05/03/2010 09:30 U.K. Producer Price Index (PPI) yy 2.0% Feb 05/03/2010 09:30 U.K. Producer Price Index (PPI) yy 8.4% Feb 05/03/2010 11:00 Germany Factory Orders mm 1.5% -2.3% Jan 05/03/2010 11:00 Germany Factory Orders mm 1.5% -2.3% Jan 05/03/2010 13:30 USA Non-Farm Payroll -20.0k -20.0k Feb 05/03/2010 13:30 USA Unemployment Rate 9.8% 9.7% Feb 05/03/2010 20:00 USA Consumer Credit mm -3.1b -1.73b Jan Results for the week of: 22/02/2010 - 26/02/2010 22 Feb 2010 - 26 Feb 2010 * GMT time Date Hour Country Event Result Forecast Previous Period 22/02/2010 00:30 Australia New Motor Vehicle Sales (MoM) (Jan) 3.3% 22/02/2010 23:50 Japan BoJ Monetary Policy Meeting 23/02/2010 09:00 Germany IFO Business Climate: index 96.1 95.8 Feb 23/02/2010 14:00 USA House Prices 0.0% -0.2% Dec 23/02/2010 15:00 USA Consumer Confidence 56.0 55.9 Feb 23/02/2010 15:00 USA Richmond Fed srvs -9.0 Feb 23/02/2010 23:50 Japan International Trade Balance mm -108.5b 545.3b Jan 24/02/2010 07:00 Germany Gross Domestic Product (GDP) qq -2.1% Q4 24/02/2010 07:00 Germany Gross Domestic Product (GDP) yy -1.7% Q4 24/02/2010 07:00 Germany GFK Consumer Sentiment 3.0 3.2 Mar 24/02/2010 10:00 Europe Factory Orders mm -1.5% 2.7% Dec 24/02/2010 10:00 Europe Factory Orders yy -0.5% Dec 24/02/2010 15:00 USA New Home sales 0.36m 0.342m Jan 25/02/2010 00:00 USA Building Permits 0.621m Jan 25/02/2010 08:15 Swiss Non-Farm Payroll 3.963m Q4 25/02/2010 09:00 Germany Unemployment Rate 8.2% 8.2% Feb 25/02/2010 09:00 Europe M3 Money Supply yy 0.0% -0.2% Jan 25/02/2010 09:30 U.K. CBI Sales -8.0 Feb 25/02/2010 10:00 Europe Consumer Confidence -16.0 -16.0 Feb 25/02/2010 10:00 Europe Economic Sentiment 96.5 95.7 Feb 25/02/2010 10:00 Europe Industrial Sentiment -13.0 -14.0 Feb 25/02/2010 10:00 Europe Service Sentiment 0.0 -1.0 Feb 25/02/2010 12:35 Japan Core CPI mm -1.7% Jan 25/02/2010 13:30 USA New orders XD 0.8% Jan 25/02/2010 13:30 USA Durable Goods Orders 1.5% 1.0% Jan 25/02/2010 13:30 USA Initial Jobless Claims 473.0k L/W 25/02/2010 15:00 USA House Prices 0.7% Dec 25/02/2010 16:00 USA KC Fed 13.0 Feb 25/02/2010 21:45 New Zealand International Trade Balance mm 2.0m Jan 25/02/2010 21:45 New Zealand Export Prices 3.41b Jan 25/02/2010 21:45 New Zealand Import Prices 3.40b Jan 25/02/2010 21:45 New Zealand Building Permits 2.41% Jan 25/02/2010 23:15 Japan Manufacturing PMI 52.5 Feb 25/02/2010 23:30 Japan Core CPI yy -1.4% -1.3% Jan 25/02/2010 23:50 Japan Retail Sales yy -0.2% -0.3% Jan 26/02/2010 00:00 Germany Consumer Price Index (CPI) mm 0.5% -0.6% Feb 26/02/2010 00:00 Germany Consumer Price Index (CPI) yy 0.7% 0.8% Feb 26/02/2010 00:00 Germany HICP mm 0.5% -0.6% Feb 26/02/2010 00:00 Germany HICP yy 0.6% 0.8% Feb 26/02/2010 05:00 Japan Housing Starts yy -11.6% -15.7% Jan 26/02/2010 09:30 U.K. Gross Domestic Product (GDP) qq 0.2% 0.1% Q4 26/02/2010 09:30 U.K. Gross Domestic Product (GDP) yy -3.1% -3.2% Q4 26/02/2010 10:00 Europe Core HICP mm 1.1% 1.0% Jan 26/02/2010 10:00 Europe Core HICP yy 1.1% 1.0% Jan 26/02/2010 10:00 Europe HICP mm -0.7% 0.3% Jan 26/02/2010 10:00 Europe HICP yy 1.0% 0.9% Jan 26/02/2010 10:30 Swiss KOF Purchasing Manager ind 1.8 1.77 Feb 26/02/2010 13:30 USA Core PCE qq 1.4% 1.4% Q4 26/02/2010 13:30 USA Gross Domestic Product (GDP) qq 5.5% 5.7% Q4 26/02/2010 13:30 Canada Current Account -13.12b Q4 26/02/2010 14:45 USA Chicago PMI 60.0 61.5 Feb 26/02/2010 14:55 USA U.Michigan Consumer Sentiment 74.3 74.4 Feb 26/02/2010 15:00 USA Existing Home Sales (Units) 5.5m 5.45m Jan Results for the week of: 14/02/2010 - 19/02/2010 14 February 2010 - 19 February 2010 * GMT Time Date Hour Country Event Result Forecast Previous Period 14/02/2010 23:50 Japan Gross Domestic Product (GDP) yy -15.2% Q1 14/02/2010 23:50 Japan Gross Domestic Product (GDP) qq 3.3% Q4 15/02/2010 00:00 USA Market Holiday 15/02/2010 00:00 Canada Market Holiday 15/02/2010 08:15 Swiss Producer Price Index (PPI) mm 0.1% Jan 15/02/2010 08:15 Swiss Producer Price Index (PPI) yy -2.5% Jan 15/02/2010 21:45 New Zealand Producer Price Index (PPI) mm 0.1% -1.1% Q4 16/02/2010 00:30 Australia Protocol of last interest rate meeting 16/02/2010 09:30 U.K. Consumer Price Index (CPI) mm 0.6% Jan 16/02/2010 09:30 U.K. Consumer Price Index (CPI) yy 2.9% Jan 16/02/2010 09:30 U.K. Retail Price Index (RPI) mm 0.6% Jan 16/02/2010 09:30 U.K. Retail Price Index (RPI) yy 2.4% Jan 16/02/2010 09:30 U.K. RPI ex. Mortgage (RPIX) mm 0.6% Jan 16/02/2010 09:30 U.K. Retail Price Index (RPI) yy 3.8% Jan 16/02/2010 10:00 Germany ZEW Economic Sentiment 44.5 47.2 Feb 16/02/2010 13:30 USA New-York Fed Survey 16 15.92 Feb 16/02/2010 14:00 USA Capital Flow 26.6 Dec 16/02/2010 18:00 USA NAHB housing market INDEX 15 15 Feb 17/02/2010 09:30 U.K. Initial Jobless Claims -15.2k Jan 17/02/2010 09:30 U.K. Unemployment Rate 7.8% Dec 17/02/2010 10:00 Europe International Trade Balance yy 4.8b Dec 17/02/2010 13:30 USA Building Permits 0.65m 0.653m Jan 17/02/2010 13:30 USA Export Prices 0.4% 0.6% Jan 17/02/2010 13:30 USA Housing Starts yy 0.58m 0.557m Jan 17/02/2010 13:30 USA Import Prices 0.8% 0% Jan 17/02/2010 13:30 Canada Wholesale Trade 2.5% Dec 17/02/2010 14:15 USA Capacity Utilization 72.5 72 Jan 17/02/2010 14:15 USA Industrial Production mm 0.6% 0.6% Jan 17/02/2010 19:00 USA Protocol of last interest rate meeting 18/02/2010 00:00 Japan Interest Rate Decision 0.1% 0.1% Feb 18/02/2010 07:15 Swiss International Trade Balance yy 1360m Jan 18/02/2010 09:30 U.K. M3 Money Supply yy -1.1% Jan 18/02/2010 10:00 Swiss ZEW Economic Sentiment 56.2 Feb 18/02/2010 11:00 U.K. CBI Sales -39 Jan 18/02/2010 12:00 Canada Core CPI mm -0.3% Jan 18/02/2010 12:00 Canada Core CPI yy 1.5% Jan 18/02/2010 12:00 Canada Consumer Price Index (CPI) mm -0.3 Jan 18/02/2010 12:00 Canada Consumer Price Index (CPI) yy 1.3% Jan 18/02/2010 13:30 USA Initial Jobless Claims 440k L/W 18/02/2010 13:30 USA Producer Price Index (PPI) yy 4.5% 4.4% Jan 18/02/2010 13:30 USA Producer Price Index (PPI) mm 0.7% 0.2% Jan 18/02/2010 13:30 USA Core PPI mm 0.1% 0% Jan 18/02/2010 13:30 USA Core PPI yy 0.8% 0.9% Jan 18/02/2010 15:00 USA Leading Economic Indicators 0.6% 1.1% Jan 18/02/2010 15:00 USA Philadelphia Fed Survey 17 15.2 Feb 18/02/2010 22:30 Australia Reserve Bank of Australia Governor Speech 19/02/2010 07:00 Germany Producer Price Index (PPI) mm 0.3% -0.1% Jan 19/02/2010 07:00 Germany Producer Price Index (PPI) yy -3.9% -5.2% Jan 19/02/2010 08:25 Germany Services PMI 52.5 51.2 Feb 19/02/2010 08:25 Germany Manufacturing PMI 54 53.4 Feb 19/02/2010 08:55 Europe Manufacturing PMI 52.5 52.4 Feb 19/02/2010 08:55 Europe Services PMI 52.7 52.5 Feb 19/02/2010 09:00 Europe Current Account 0.1% Dec 19/02/2010 09:00 Europe Capital Flow -15.3b Dec 19/02/2010 09:30 U.K. Retail Sales mm 0.3% Jan 19/02/2010 09:30 U.K. Retail Sales yy 2.1% Jan 19/02/2010 13:30 USA Core CPI mm 0.1% 0.1% Jan 19/02/2010 13:30 USA Consumer Price Index (CPI) mm 0.3% 0.1% Jan 19/02/2010 13:30 USA Core CPI yy 1.8% 1.8% Jan 19/02/2010 13:30 USA Consumer Price Index (CPI) yy 2.8% 2.7% Jan 19/02/2010 13:30 Israel Leading Economic Indicators 1.5% Jan 19/02/2010 13:30 Canada Core Retail Sales mm 0% Dec 19/02/2010 13:30 Canada Retail Sales mm -0.3% Dec Results for the week of: 07/02/2010 - 12/02/2010 7 February 2010 - 12 February 2010 Date Hour Country Event Result Forecast Previous Period 07/02/2010 23:50 Japan Current Account 520.1 76.9% Dec 08/02/2010 06:45 Swiss Unemployment Rate 4.3% 4.2% Jan 08/02/2010 08:15 Swiss Retail Sales mm 0.6% Dec 08/02/2010 13:15 Canada Housing Starts yy 174.5k Jan 09/02/2010 07:00 Germany Consumer Price Index (CPI) mm -0.6% 0.8% Jan 09/02/2010 07:00 Germany Consumer Price Index (CPI) yy 0.8% 0.9% Jan 09/02/2010 07:00 Germany Core HICP mm -0.7% 0.9% Jan 09/02/2010 07:00 Germany Core HICP yy 0.7% 0.8% Jan 09/02/2010 07:00 Germany International Trade Balance mm 14.6b 17.2b Dec 09/02/2010 09:30 U.K. International Trade Balance mm -6.6b -6.784b Dec 09/02/2010 15:00 USA Wholsale Inventories 0.5% 1.5% Dec 09/02/2010 15:00 USA Wholesale Trade 1.0% 3.3% Dec 09/02/2010 23:50 Japan Machinery Orders mm 8.0% -11.3% Dec 10/02/2010 09:30 U.K. Industrial Production mm 0.3% 0.4% Dec 10/02/2010 09:30 U.K. Industrial Production yy -4.1% -6.0% Dec 10/02/2010 10:30 U.K. Bank of England Quarterly Inflation Report 10/02/2010 13:30 USA International Trade Balance mm -36.5b -36.4b Dec 10/02/2010 13:30 Canada International Trade Balance mm -0.34b Dec 10/02/2010 19:00 USA Budget -60.5b Jan 11/02/2010 00:00 Japan Market Holiday 11/02/2010 00:30 Australia Non-Farm Payroll 15000 35200 Jan 11/02/2010 00:30 Australia Unemployment Rate 5.6% 5.5% Jan 11/02/2010 08:15 Swiss Consumer Price Index (CPI) mm -0.5% -0.2% Jan 11/02/2010 08:15 Swiss Core CPI yy 0.6% 0.3% Jan 11/02/2010 13:30 USA Initial Jobless Claims 480k L/W 11/02/2010 13:30 USA Core Retail Sales mm 0.5% -0.2% Jan 11/02/2010 13:30 USA Core Retail Sales yy 0.5% -0.3% Jan 11/02/2010 13:30 Canada House Prices 0.4% Dec 11/02/2010 21:45 New Zealand Core Retail Sales mm 0.8% Dec 11/02/2010 21:45 New Zealand Retail Sales mm 0.5% 0.8% Dec 11/02/2010 21:45 New Zealand Retail Sales yy 2.6% 2.4% Dec 12/02/2010 05:00 Japan Consumer Confidence 37.6b Jan 12/02/2010 07:00 Germany Gross Domestic Product (GDP) mm 0.3% 0.7% Q4 12/02/2010 07:00 Germany Gross Domestic Product (GDP) yy -2.2% -4.7% Q4 12/02/2010 10:00 Europe Gross Domestic Product (GDP) qq 0.3% 0.4% Q4 12/02/2010 10:00 Europe Gross Domestic Product (GDP) yy -1.9% -4.0% Q4 12/02/2010 10:00 Europe Industrial Production mm 0.2% 1.0% Dec 12/02/2010 10:00 Europe Industrial Production yy -1.1% -7.1% Dec 12/02/2010 14:55 USA U.Michigan Consumer Sentiment 74.0 74.4 Feb Results for the week of: 1/02/2010 - 05/02/2010 1 February 2010 - 5 February 2010 * GMT time Date Hour Country Event Result Forecast Previous Period 01/02/2010 00:30 Australia House Prices 3.3% 4.2% Q4 01/02/2010 08:30 Swiss Manufacturing PMI 55.2 54.6 Jan 01/02/2010 08:53 Germany Manufacturing PMI 53.4 52.7 Jan 01/02/2010 08:58 Europe Manufacturing PMI 52.0 51.6 Jan 01/02/2010 09:28 U.K. Manufacturing PMI 54.0 54.1 Jan 01/02/2010 09:30 U.K. Consumer Credit mm -0.5b -0.376b Dec 01/02/2010 13:30 USA Core PCE mm 0.1% 0.0% Dec 01/02/2010 13:30 USA Core PCE yy 1.4% Dec 01/02/2010 13:30 USA Personal Consumption Exp. mm 0.2% Dec 01/02/2010 13:30 USA Personal Consumption Exp. yy 1.5% Dec 01/02/2010 13:30 USA Personal Consumption 0.2% Dec 01/02/2010 13:30 USA Personal Income 0.3% 0.4% Dec 01/02/2010 15:00 USA Construction Spending -0.5% -0.6% Dec 01/02/2010 15:00 USA Manufacturing PMI 55.5 54.9 Jan 02/02/2010 03:30 Australia Interest Rate Decision 4.00% 3.75% Feb 02/02/2010 06:45 Swiss Consumer Confidence -30.0 Q1 02/02/2010 07:00 Europe Retail Sales mm 0.8% -1.7% Dec 02/02/2010 07:00 Europe Retail Sales yy -2.6% -2.5% Dec 02/02/2010 10:00 Europe Producer Price Index (PPI) mm 0.0% 0.1% Dec 02/02/2010 10:00 Europe Producer Price Index (PPI) yy -3.1% -4.4% Dec 02/02/2010 15:00 USA Pending Homes Sales 1.1% -16.0% Dec 03/02/2010 00:30 Australia International Trade Balance mm -2400m -1700m Dec 03/02/2010 08:53 Germany Services PMI 51.2 52.7 Jan 03/02/2010 08:58 Europe Services PMI 52.3 53.6 Jan 03/02/2010 09:28 U.K. Services PMI 56.3 56.8 Jan 03/02/2010 10:00 Europe Retail Sales mm 0.4% -1.2% Dec 03/02/2010 10:00 Europe Retail Sales yy -2.6% -4.0% Dec 03/02/2010 13:15 USA ADP employment -54.0k -84.0k Jan 03/02/2010 21:45 New Zealand Unemployment Rate 6.8% 6.5% Q4 04/02/2010 00:30 Australia Retail Sales mm -0.2% 1.4% 04/02/2010 00:30 Australia monetary policy report 04/02/2010 00:30 Australia Building Permits -0.9% 5.9% Dec 04/02/2010 07:15 Swiss International Trade Balance mm 2144.0m Dec 04/02/2010 11:00 Germany Factory Orders mm 0.3% 2.8% Dec 04/02/2010 12:00 U.K. Interest Rate Decision 0.5% 0.5% Feb 04/02/2010 12:45 Europe Interest Rate Decision 1.0% 1.0% Feb 04/02/2010 13:30 USA Initial Jobless Claims 470.0k L/W 04/02/2010 13:30 Canada Building Permits -4.6% Dec 04/02/2010 15:00 USA Durable Goods Orders 0.3% Dec 04/02/2010 15:00 USA New orders XD 0.3% Dec 04/02/2010 15:00 USA Factory Orders yy 0.9% 0.6% Dec 04/02/2010 15:00 Canada Services PMI 48.4 Jan 05/02/2010 05:00 Japan Leading Economic Indicators 1.8 Dec 05/02/2010 12:00 Canada Non-Farm Payroll -2.6k Jan 05/02/2010 12:00 Canada Unemployment Rate 8.5% Jan 05/02/2010 13:30 USA Non-Farm Payroll -10.0k -85.0k Jan 05/02/2010 13:30 USA Unemployment Rate 10.1% 10.0% Jan 05/02/2010 20:00 USA Consumer Credit mm -7.7b -17.5b Dec Results for the week of: 25/01/2010 - 29/01/2010 25 January 2010 - 29 January 2010 * GMT Time Date Hour Country Event Result Forecast Previous Period 25/01/2010 00:30 Australia Producer Price Index (PPI) mm -0.4% 0.2% 0.1% Q4 25/01/2010 00:30 Australia Producer Price Index (PPI) yy -1.5% -0.9% 0.2% Q4 25/01/2010 15:00 USA Existing Home Sales (Units) 6.03m 6.54m Dec 25/01/2010 23:30 Japan Tankan Survey -27.0 Jan 26/01/2010 00:00 Japan Interest Rate Decision 0.1% 0.1% Jan 26/01/2010 00:00 Australia Market Holiday 26/01/2010 07:00 Germany Import Prices 0.1% 0.4% Dec 26/01/2010 09:00 Germany IFO Business Climate: index 95.1 94.7 Jan 26/01/2010 09:00 Europe Current Account -4.6b Nov 26/01/2010 09:00 Europe Capital Flow 17.7b Nov 26/01/2010 09:30 U.K. Gross Domestic Product (GDP) qq 0.4% Q4 26/01/2010 09:30 U.K. Gross Domestic Product (GDP) yy -3.0% Q4 26/01/2010 14:00 USA House Prices -0.1% 0.0% Nov 26/01/2010 15:00 USA House Prices 0.6% Nov 26/01/2010 23:50 Japan International Trade Balance mm 590.0b 373.9b Dec 27/01/2010 00:00 Germany Consumer Price Index (CPI) mm -0.3% 0.8% Jan 27/01/2010 00:00 Germany Consumer Price Index (CPI) yy 1.0% 0.9% Jan 27/01/2010 00:00 Germany HICP mm -0.4% 0.9% Jan 27/01/2010 00:00 Germany HICP yy 1.0% 0.8% Jan 27/01/2010 00:30 Australia Consumer Price Index (CPI) mm 0.4% 1.0% Q4 27/01/2010 00:30 Australia Consumer Price Index (CPI) yy 2.0% 1.3% Q4 27/01/2010 15:00 USA New Home sales 0.37m 0.355m Dec 27/01/2010 19:15 USA Interest Rate Decision 0.25% 0.25% Jan 27/01/2010 20:00 New Zealand Interest Rate Decision 2.5% 2.5% Jan 27/01/2010 23:50 Japan Retail Sales yy 0.2% -1.0% Dec 28/01/2010 00:00 USA Building Permits 0.653m Dec 28/01/2010 09:00 Germany Unemployment Rate 8.2% 8.1% Jan 28/01/2010 10:00 Europe Industrial Sentiment -14.0 -16.0 Jan 28/01/2010 13:30 USA New orders XD 0.1% Dec 28/01/2010 13:30 USA Durable Goods Orders 1.5% 0.2% Dec 28/01/2010 13:30 USA Initial Jobless Claims 482.0k L/W 28/01/2010 21:45 New Zealand International Trade Balance mm -139.0m -269.0m Dec 28/01/2010 23:15 Japan Manufacturing PMI 53.8 Jan 28/01/2010 23:30 Japan House hold Spending 1.5% 2.2% Dec 28/01/2010 23:30 Japan Core CPI yy -1.3% -1.7% Dec 28/01/2010 23:30 Japan Core CPI mm -1.9% Dec 28/01/2010 23:30 Japan Unemployment Rate 5.3% 5.2% Dec 29/01/2010 05:00 Japan Housing Starts yy -18.7% -19.1% Dec 29/01/2010 09:00 Europe M3 Money Supply yy -0.5% -0.2% Dec 29/01/2010 10:00 Europe HICP yy 1.2% 0.9% Jan 29/01/2010 10:00 Europe Unemployment Rate 10.1% 10.0% Dec 29/01/2010 10:30 Swiss KOF Purchasing Manager ind 1.71 1.68 Jan 29/01/2010 13:30 USA Core PCE qq 1.3% 1.2% Q4 29/01/2010 13:30 USA Gross Domestic Product (GDP) qq 4.6% 2.2% Q4 29/01/2010 13:30 Canada Gross Domestic Product (GDP) mm 0.2% Nov 29/01/2010 13:30 Canada Producer Price Index (PPI) mm 1.0% Dec 29/01/2010 13:30 Canada Producer Price Index (PPI) yy -2.8% Dec 29/01/2010 14:45 USA Chicago PMI 58.7 Jan 29/01/2010 14:55 USA U.Michigan Consumer Sentiment 73.0 72.5 Jan Results for the week of: 18/01/2010 - 22/01/2010 18 January 2010 - 22 January 2010 * GMT Time Date Hour Country Event Result Forecast Previous Period 18/01/2010 00:00 USA Market Holiday 19/01/2010 05:00 Japan Consumer Confidence 39.5 Dec 19/01/2010 09:30 U.K. Consumer Price Index (CPI) mm 0.3% Dec 19/01/2010 09:30 U.K. Consumer Price Index (CPI) yy 1.9% Dec 19/01/2010 09:30 U.K. Retail Price Index (RPI) mm 0.3% Dec 19/01/2010 09:30 U.K. Retail Price Index (RPI) yy 0.3% Dec 19/01/2010 09:30 U.K. RPI ex. Mortgage (RPIX) mm 0.3% Dec 19/01/2010 09:30 U.K. RPI ex. Mortgage (RPIX) yy 2.7% Dec 19/01/2010 10:00 Germany ZEW Economic Sentiment 49.5 50.4 Jan 19/01/2010 13:30 Canada Leading Economic Indicators 1.3% Dec 19/01/2010 14:00 USA Capital Flow -13.9b Nov 19/01/2010 14:00 Canada Interest Rate Decision 0.25% Jan 19/01/2010 18:00 USA NAHB housing market INDEX 17.0 16.0 Jan 19/01/2010 21:45 New Zealand Consumer Price Index (CPI) mm 0.0% 1.3% Q4 19/01/2010 21:45 New Zealand Consumer Price Index (CPI) yy 2.1% 1.7% Q4 19/01/2010 23:30 Australia Consumer Confidence -3.8% Jan 20/01/2010 07:00 Germany Producer Price Index (PPI) mm 0.2% 0.1% Dec 20/01/2010 07:00 Germany Producer Price Index (PPI) yy -5.1% -5.9% Dec 20/01/2010 09:30 U.K. Initial Jobless Claims -6.3k Dec 20/01/2010 09:30 U.K. Unemployment Rate 7.9% Nov 20/01/2010 09:30 U.K. Protocol of last interest rate meeting 20/01/2010 12:00 Canada Consumer Price Index (CPI) mm 0.5% Dec 20/01/2010 12:00 Canada Consumer Price Index (CPI) yy 1.0% Dec 20/01/2010 12:00 Canada Core CPI mm 0.4% Dec 20/01/2010 12:00 Canada Core CPI yy 1.5% Dec 20/01/2010 13:30 USA Building Permits 0.59m 0.589m Dec 20/01/2010 13:30 USA House Prices 0.58m 0.574m Dec 20/01/2010 13:30 USA Producer Price Index (PPI) yy 4.7% 2.4% Dec 20/01/2010 13:30 USA Producer Price Index (PPI) mm 0.1% 1.8% Dec 20/01/2010 13:30 USA Core PPI mm 0.2% 0.5% Dec 20/01/2010 13:30 USA Core PPI yy 1.1% 1.2% Dec 20/01/2010 13:30 Canada Manufacturing Shipments 2.0% Nov 20/01/2010 21:45 New Zealand Core Retail Sales mm 0.2% 0.5% Nov 20/01/2010 21:45 New Zealand Retail Sales mm 0.5% 0.0% Nov 20/01/2010 21:45 New Zealand Retail Sales yy 1.5% -0.2% Nov 21/01/2010 08:25 Germany Manufacturing PMI 52.7 53.1 Jan 21/01/2010 08:25 Germany Services PMI 52.8 53.1 Jan 21/01/2010 08:55 Europe Manufacturing PMI 51.8 51.6 Jan 21/01/2010 09:30 U.K. M3 Money Supply yy 0.1% Dec 21/01/2010 09:30 U.K. Consumer Credit mm 20.315b Dec 21/01/2010 10:00 Swiss ZEW Economic Sentiment 54.0 Jan 21/01/2010 11:00 U.K. CBI Sales -42.0 Jan 21/01/2010 13:30 USA Initial Jobless Claims 444.0k L/W 21/01/2010 15:00 USA Leading Economic Indicators 0.7% 0.9% Dec 21/01/2010 15:00 USA Philadelphia Fed Survey 22.5 Jan 22/01/2010 00:30 Australia Export Prices -9.6% Q4 22/01/2010 00:30 Australia Import Prices -3.0% Q4 22/01/2010 09:30 U.K. Retail Sales mm -0.3% Dec 22/01/2010 09:30 U.K. Retail Sales yy 3.1% Dec 22/01/2010 10:00 Europe Factory Orders mm -2.2% Nov 22/01/2010 10:00 Europe Factory Orders yy -14.5% Nov 22/01/2010 13:30 Canada Core Retail Sales mm 0.2% Nov 22/01/2010 13:30 Canada Retail Sales mm 0.8% Nov Results for the week of: 11/01/2010 - 15/01/2010 11 January 2010 - 15 January 2010 * GMT Time Date Hour Country Event Result Forecast Previous Period 11/01/2010 00:00 Japan Market Holiday 11/01/2010 08:15 Swiss Retail Sales mm 3.1% Nov 11/01/2010 13:15 Canada Housing Starts yy 158.5k Dec 11/01/2010 13:30 Canada Building Permits 18.0% Nov 11/01/2010 23:30 Australia Consumer Confidence -3.8% Jan 11/01/2010 23:50 Japan Current Account 62.8% 42.7% Nov 12/01/2010 09:30 U.K. International Trade Balance mm -7.0b -7.108b Nov 12/01/2010 13:30 USA International Trade Balance mm -34.3b -32.94b Nov 12/01/2010 13:30 Canada Export Prices 31.13b Nov 12/01/2010 13:30 Canada Import Prices 30.71b Nov 12/01/2010 13:30 Canada New Home sales 0.3% Nov 12/01/2010 13:30 Canada International Trade Balance mm 0.43b Nov 13/01/2010 08:00 Germany Gross Domestic Product (GDP) yy -4.8% 1.3% 13/01/2010 09:30 U.K. Industrial Production mm 0.2% 0.0% Nov 13/01/2010 09:30 U.K. Industrial Production yy -6.1% -8.4% Nov 13/01/2010 09:30 U.K. Manufacturing PMI 0.2% 0.0% Nov 13/01/2010 10:00 Europe Industrial Production yy 0.5% -0.6% Nov 13/01/2010 10:00 Europe Industrial Production yy -8.5% -11.1% Nov 13/01/2010 19:00 USA Budget -105.0b -51.75b Dec 13/01/2010 21:45 New Zealand Building Permits 11.7% Q1 14/01/2010 00:30 Australia Non-Farm Payroll 10000 31200 Dec 14/01/2010 02:30 Australia Unemployment Rate 5.7% 5.7% Dec 14/01/2010 07:00 Germany HICP mm 0.9% -0.2% Dec 14/01/2010 07:00 Germany HICP yy 0.8% 0.3% Dec 14/01/2010 12:45 Europe Interest Rate Decision 1.0% 1.0% Jan 14/01/2010 13:30 USA Export Prices 0.4% 0.8% Dec 14/01/2010 13:30 USA Import Prices 0.1% 1.7% Dec 14/01/2010 13:30 USA Initial Jobless Claims 434.0k L/W 14/01/2010 13:30 USA Core Retail Sales mm 0.3% 1.2% Dec 14/01/2010 13:30 USA Retail Sales mm 0.2% 1.3% Dec 15/01/2010 07:15 Swiss Producer Price Index (PPI) mm 0.0% Dec 15/01/2010 08:15 Swiss Producer Price Index (PPI) yy -3.3% Dec 15/01/2010 10:00 Europe International Trade Balance yy 8.8b Nov 15/01/2010 10:00 Europe Core HICP mm 0.3% 0.0% Dec 15/01/2010 12:00 Europe Core HICP yy 0.9% 1.0% Dec 15/01/2010 13:30 USA Core CPI mm 0.1% 0.0% Dec 15/01/2010 13:30 USA Core CPI yy 1.8% 1.7% Dec 15/01/2010 14:10 USA Capacity Utilization 71.6% %71.3 Dec 15/01/2010 14:15 USA Industrial Production mm 0.4% 0.8% Dec 15/01/2010 14:55 USA U.Michigan Consumer Sentiment 73.4 Jan Results for the week of: 04/01/2010 - 08/01/2010 4 January 2010 - 8 January 2010 * GMT Time Date Hour Country Event Result Forecast Previous Period 04/01/2010 07:50 Germany Manufacturing PMI 53.1 52.4 Dec 04/01/2010 08:30 Swiss Manufacturing PMI 57.0 56.9 Dec 04/01/2010 08:55 Europe Manufacturing PMI 51.6 51.2 Dec 04/01/2010 09:25 U.K. Manufacturing PMI 52.0 51.8 Dec 04/01/2010 09:30 U.K. Consumer Credit mm -0.4b -0.579 Nov 04/01/2010 09:30 U.K. M3 Money Supply yy 0.0% Nov 04/01/2010 09:30 USA Construction Spending -0.4% 0.0% Nov 04/01/2010 15:00 USA Manufacturing PMI 54.0 53.6 Dec 04/01/2010 15:00 Germany Unemployment Rate 8.1% 8.1% Dec 05/01/2010 10:00 Europe HICP yy 1.0% 0.5% Dec 05/01/2010 13:30 Canada Producer Price Index (PPI) mm -0.3% Nov 05/01/2010 13:30 Canada Producer Price Index (PPI) yy -6.3% Nov 05/01/2010 15:00 USA Durable Goods Orders 0.2% Nov 05/01/2010 15:00 USA New orders XD 0.0% Nov 05/01/2010 15:00 USA Factory Orders yy 0.5% 0.6% Nov 05/01/2010 15:00 USA Pending Homes Sales -2.1% 3.7% Nov 06/01/2010 00:30 Australia Building Permits 0.3% -0.6% Nov 06/01/2010 09:25 U.K. Services PMI 56.6 56.6 Dec 06/01/2010 10:00 Europe Factory Orders mm 1.5% Oct 06/01/2010 10:00 Europe Factory Orders yy -16.5% Oct 06/01/2010 10:00 Europe Producer Price Index (PPI) mm 0.2% 0.2% Nov 06/01/2010 10:00 Europe Producer Price Index (PPI) yy -4.5% -6.7% Nov 06/01/2010 13:15 USA ADP employment -73.0k -169.0k Dec 06/01/2010 15:00 USA Services PMI 50.5 49.6 Dec 06/01/2010 15:00 USA Manufacturing PMI 50.0 48.7 Dec 06/01/2010 21:45 New Zealand International Trade Balance mm -400.0m -487.0m Nov 07/01/2010 00:30 Australia International Trade Balance mm -1800m -2379m Nov 07/01/2010 00:30 Australia Retail Sales mm 0.3% 0.3% Nov 07/01/2010 08:15 Swiss Consumer Price Index (CPI) mm 0.1% 0.2% Dec 07/01/2010 08:15 Swiss Consumer Price Index (CPI) yy 0.5% 0.0% Dec 07/01/2010 10:00 Europe Consumer Confidence -16.0 -17.0 Dec 07/01/2010 10:00 Europe Economic Sentiment 90.0 88.8 Dec 07/01/2010 10:00 Europe Industrial Sentiment -18.0 -19.0 Dec 07/01/2010 10:00 Europe Retail Sales mm 0.1% 0.0% Nov 07/01/2010 10:00 Europe Retail Sales yy -1.8% -1.9% Nov 07/01/2010 10:00 Europe Service Sentiment -3.0 -4.0 Dec 07/01/2010 11:00 Germany Factory Orders mm 1.5% -2.1% Nov 07/01/2010 12:00 U.K. Interest Rate Decision 0.5% 0.5% Jan 07/01/2010 13:30 USA Initial Jobless Claims 455.0k 432.0k L/W 07/01/2010 15:00 Canada Services PMI 55.9 Dec 08/01/2010 05:00 Japan Leading Economic Indicators 2.2 Nov 08/01/2010 06:45 Swiss Unemployment Rate 4.1% Dec 08/01/2010 07:00 Germany Export Prices 0.5% 2.5% Nov 08/01/2010 07:00 Germany Import Prices -2.4% Nov 08/01/2010 07:00 Germany International Trade Balance mm 12.4b 12.9b Nov 08/01/2010 09:30 U.K. Core PPI mm 0.1% Dec 08/01/2010 09:30 U.K. Core PPI yy 1.9% 2.0% Dec 08/01/2010 09:30 U.K. Producer Price Index (PPI) yy -0.3% 0.1% Dec 08/01/2010 09:30 U.K. Producer Price Index (PPI) yy 6.4% 4.0% Dec 08/01/2010 10:00 Europe Gross Domestic Product (GDP) qq 0.4% -0.2% Q3 08/01/2010 10:00 Europe Gross Domestic Product (GDP) yy -4.1% -4.8% Q3 08/01/2010 10:00 Europe Unemployment Rate 9.9% 9.8% Nov 08/01/2010 11:00 Germany Industrial Production mm 1.0% 1.8% Nov 08/01/2010 12:00 Canada Non-Farm Payroll 79.0k Dec 08/01/2010 12:00 Canada Unemployment Rate 8.5% Dec 08/01/2010 13:30 USA Non-Farm Payroll -20.0k -11.0k Dec 08/01/2010 13:30 USA Unemployment Rate 10.1% 10.0% Dec 08/01/2010 15:00 USA Wholsale Inventories -0.3% 0.3% Nov 08/01/2010 15:00 USA Wholesale Trade 0.9% 1.2% Nov 08/01/2010 20:00 USA Consumer Credit mm -0.5b -3.51b Nov Results for the week of: 27/12/2009 - 01/01/2010 27 December 2009 - 1 January 2010 * GMT Time Date Hour Country Event Result Forecast Previous Period 27/12/2009 23:50 Japan Retail Sales yy -0.9% Nov 27/12/2009 23:50 Japan Industrial Production mm 0.5% Nov 28/12/2009 00:00 Canada Market Holiday 28/12/2009 00:00 U.K. Market Holiday 28/12/2009 00:00 Australia Market Holiday 28/12/2009 00:00 New Zealand Market Holiday 28/12/2009 17:00 USA Mid-West Mnfg Activity 82.9 Nov 29/12/2009 14:00 USA House Prices 0.2% 0.3% Oct 29/12/2009 15:00 USA Consumer Confidence 52.3 49.5 Dec 29/12/2009 23:15 Japan Manufacturing PMI 52.3 Dec 30/12/2009 09:00 Germany M3 Money Supply yy 0.3% 0.3% Nov 30/12/2009 10:30 Swiss KOF Purchasing Manager ind 1.7 1.62 Dec 30/12/2009 14:45 USA Chicago PMI 55.0 56.1 Dec 30/12/2009 16:00 USA KC Fed 17.0 Dec 31/12/2009 00:00 Japan Market Holiday 31/12/2009 07:00 U.K. House Prices 0.3% 0.5% Dec 31/12/2009 09:30 U.K. Consumer Credit mm -0.4b -0.579b Dec 31/12/2009 13:30 USA Initial Jobless Claims 465k L/W 01/01/2010 00:00 USA Market Holiday 01/01/2010 00:00 Canada Market Holiday 01/01/2010 00:00 Swiss Market Holiday 01/01/2010 00:00 U.K. Market Holiday 01/01/2010 00:00 Japan Market Holiday 01/01/2010 00:00 Australia Market Holiday Results for the week of: 20/12/2009 - 25/12/2009 20 December 2009 - 25 December 5009 * GMT Time Date Hour Country Event Result Forecast Previous Period 20/12/2009 23:50 Japan International Trade Balance mm 373.9B 344.5b 807.1b Nov 21/12/2009 13:30 Canada Core Retail Sales yy 0.2% 0.2% 1.1% Oct 21/12/2009 13:30 Canada Retail Sales mm 0.8% 0.7% 1.0% Oct 21/12/2009 21:45 New Zealand Current Account 0.120b Q3 21/12/2009 21:45 New Zealand Current Account -10.61b Q3 21/12/2009 23:30 Japan Tankan Survey -28.0 Dec 22/12/2009 07:00 Germany GFK Consumer Sentiment 3.5 3.7 Jan 22/12/2009 07:15 Swiss International Trade Balance mm 2463.0m Nov 22/12/2009 09:30 U.K. Current Account -11.42b Q3 22/12/2009 09:30 U.K. Gross Domestic Product (GDP) qq -0.1% -0.3% Q3 22/12/2009 09:30 U.K. Gross Domestic Product (GDP) yy -4.9% -5.1% Q3 22/12/2009 13:30 USA Core PCE qq 1.3% 1.3% Q3 22/12/2009 13:30 USA Gross Domestic Product (GDP) qq 2.7% 2.8% Q3 22/12/2009 13:30 USA Personal Consumption Exp. qq 2.7% 2.7% Q3 22/12/2009 15:00 USA Existing Home Sales (Units) 6.3m 6.1m Nov 22/12/2009 15:00 USA House Prices 0.0% Oct 22/12/2009 15:00 USA House Prices -3.0% Oct 22/12/2009 15:00 USA Richmond Fed srvs -7.0 Dec 22/12/2009 21:45 New Zealand Gross Domestic Product (GDP) yy -1.3% -2.1% Q3 23/12/2009 00:00 Japan Market Holiday 23/12/2009 09:30 U.K. Protocol of last interest rate meeting 23/12/2009 13:30 USA Personal Consumption 0.4% 0.7% Nov 23/12/2009 13:30 USA Core PCE mm 0.1% 0.2% Nov 23/12/2009 13:30 USA Core PCE yy 1.4% Nov 23/12/2009 13:30 USA Personal Consumption Exp. mm 0.3% Nov 23/12/2009 13:30 USA Personal Consumption Exp. yy 0.2% Nov 23/12/2009 13:30 USA Personal Income 0.4% 0.2% Nov 23/12/2009 13:30 Canada Gross Domestic Product (GDP) mm 0.4% Oct 23/12/2009 14:55 USA U.Michigan Consumer Sentiment 74.0 67.4 Dec 23/12/2009 15:00 USA New Home sales 0.44m 0.43m Nov 23/12/2009 23:50 Japan Protocol of last interest rate meeting Nov 24/12/2009 13:30 USA New orders XD 0.4% Nov 24/12/2009 13:30 USA Durable Goods Orders 0.3% -0.6% Nov 24/12/2009 13:30 USA Initial Jobless Claims 480.0k L/W 24/12/2009 23:30 Japan House hold Spending 0.4% 1.6% Nov 24/12/2009 23:30 Japan Core CPI yy -1.7% -2.2% Nov 24/12/2009 23:30 Japan Unemployment Rate 5.2% 5.1% Nov 25/12/2009 00:00 USA Market Holiday 25/12/2009 00:00 Canada Market Holiday 25/12/2009 00:00 Swiss Market Holiday 25/12/2009 00:00 Germany Market Holiday 25/12/2009 00:00 U.K. Market Holiday 25/12/2009 00:00 Australia Market Holiday 25/12/2009 05:00 Japan Construction Spending -40.1% Nov 25/12/2009 05:00 Japan Housing Starts yy -22.7% -27.1% Nov Results for the week of: 13/12/2009 - 18/12/2009 13 December 2009 - 18 December 2009 * GMT Time Date Hour Country Event Result Forecast Previous Period 13/12/2009 21:45 New Zealand Core Retail Sales mm 0.5% 0.3% 0.0% Oct 13/12/2009 21:45 New Zealand Retail Sales mm 0.0% 0.3% 0.2% Oct 13/12/2009 21:45 New Zealand Core Retail Sales yy -0.2% 0.7% -0.5% Oct 13/12/2009 23:50 Japan Tankan Survey -10.8% Q4 14/12/2009 08:15 Swiss Producer Price Index (PPI) mm -0.4% Nov 14/12/2009 08:15 Swiss Producer Price Index (PPI) yy -4.7% Nov 14/12/2009 10:00 Europe Industrial Production mm -0.6% 0.3% Oct 14/12/2009 10:00 Europe Industrial Production yy -10.5% -12.9% Oct 14/12/2009 13:30 Canada Capacity Utilization 67.4% Q3 15/12/2009 00:30 Australia Protocol of last interest rate meeting 15/12/2009 08:15 Swiss Factory Orders yy -17.5% Q3 15/12/2009 09:30 U.K. Consumer Price Index (CPI) mm 0.1% 0.2% Nov 15/12/2009 09:30 U.K. Consumer Price Index (CPI) yy 1.8% 1.5% Nov 15/12/2009 09:30 U.K. Retail Price Index (RPI) mm 0.2% 0.3% Nov 15/12/2009 09:30 U.K. Retail Price Index (RPI) yy 0.2% -0.8% Nov 15/12/2009 09:30 U.K. RPI ex. Mortgage (RPIX) mm 0.3% Nov 15/12/2009 09:30 U.K. RPI ex. Mortgage (RPIX) yy 2.6% 1.9% Nov 15/12/2009 10:00 Germany ZEW Economic Sentiment 50.0 51.1 Dec 15/12/2009 13:30 USA New-York Fed Survey 24.0 23.51 Dec 15/12/2009 13:30 USA Producer Price Index (PPI) yy 1.5% -1.9% Nov 15/12/2009 13:30 USA Producer Price Index (PPI) mm 0.2% 0.3% Nov 15/12/2009 13:30 USA Core PPI mm 0.2% -0.6% Nov 15/12/2009 13:30 USA Core PPI yy 0.9% 0.7% Nov 15/12/2009 13:30 Canada Leading Economic Indicators Nov 15/12/2009 14:00 USA Capital Flow 133.5b Oct 15/12/2009 14:15 USA Capacity Utilization 71.1% 70.7% Nov 15/12/2009 14:15 USA Industrial Production mm 0.4% 0.1% Nov 15/12/2009 18:00 USA NAHB housing market INDEX 18.0 17.0 Dec 16/12/2009 00:30 Australia Gross Domestic Product (GDP) qq 0.4% 0.6% Q3 16/12/2009 00:30 Australia Gross Domestic Product (GDP) yy 0.7% 0.6% Q3 16/12/2009 08:28 Germany Services PMI 51.7 51.4 Dec 16/12/2009 08:28 Germany Manufacturing PMI 52.5 52.4 Dec 16/12/2009 08:58 Europe Manufacturing PMI 51.5 51.2 Dec 16/12/2009 08:58 Europe Services PMI 53.2 53.0 Dec 16/12/2009 09:30 U.K. Initial Jobless Claims 12.3k 12.9k Nov 16/12/2009 09:30 U.K. Unemployment Rate 7.9% 7.8% Oct 16/12/2009 10:00 Europe Core HICP mm 0.1% 0.3% Nov 16/12/2009 10:00 Europe Core HICP yy 1.2% 1.0% Nov 16/12/2009 10:00 Europe HICP mm 0.2% 0.2% Nov 16/12/2009 10:00 Europe HICP yy 0.6% -0.1% Nov 16/12/2009 13:30 USA Building Permits 0.57m 0.551m Nov 16/12/2009 13:30 USA Core CPI mm 0.2% 0.2% Nov 16/12/2009 13:30 USA Consumer Price Index (CPI) mm 0.4% 0.3% Nov 16/12/2009 13:30 USA Core CPI yy 1.8% 1.7% Nov 16/12/2009 13:30 USA Consumer Price Index (CPI) yy 1.8% -0.2% Nov 16/12/2009 13:30 USA Current Account -115.1b -98.8b Q3 16/12/2009 13:30 USA Housing Starts yy 0.53 0.529 Nov 16/12/2009 19:15 USA Interest Rate Decision 0.25% 17/12/2009 09:30 U.K. Retail Sales mm 0.5% 0.4% Nov 17/12/2009 09:30 U.K. Retail Sales yy 3.7% 3.4% Nov 17/12/2009 10:00 Swiss ZEW Economic Sentiment 56.4 Dec 17/12/2009 12:00 Canada Core CPI mm 0.1 Nov 17/12/2009 12:00 Canada Core CPI yy 1.8 Nov 17/12/2009 12:00 Canada Consumer Price Index (CPI) mm -0.1% Nov 17/12/2009 12:00 Canada Consumer Price Index (CPI) yy 0.1% Nov 17/12/2009 13:30 USA Initial Jobless Claims 474.0k L/W 17/12/2009 15:00 Israel Leading Economic Indicators 0.6% 0.3% Nov 17/12/2009 15:00 USA Philadelphia Fed Survey 16.5 16.7 Dec 18/12/2009 04:00 Japan Interest Rate Decision Dec 18/12/2009 07:00 Germany Producer Price Index (PPI) mm 0.0% 0.0% Nov 18/12/2009 07:00 Germany Producer Price Index (PPI) yy -6.0% -7.6% Nov 18/12/2009 09:00 Europe Capital Flow 28.0 Oct 18/12/2009 09:00 Germany IFO Business Climate: index 94.4 93.9 Dec 18/12/2009 09:00 Europe Current Account -5.4b Oct 18/12/2009 09:30 U.K. M3 Money Supply yy 1.6% Nov 18/12/2009 10:00 Europe International Trade Balance yy 3.7b Oct 18/12/2009 13:35 Canada Wholesale Trade 3.7b Oct Results for the week of: 07/12/2009 - 11/12/2009 7 December 2009 - 11 December 2009 * GMT Time Date Hour Country Event Result Forecast Previous Period 07/12/2009 11:00 Germany Factory Orders mm 0.6% 0.9% Oct 07/12/2009 13:30 Canada Building Permits 1% 1.6% Oct 07/12/2009 17:00 USA Fed Chairman Bernanke Speaks 07/12/2009 20:00 USA Consumer Credit mm -10b -14.8b Oct 07/12/2009 23:50 Japan Current Account 51.4% 0.2% Oct 08/12/2009 05:00 Japan Leading Economic Indicators 3.2 Oct 08/12/2009 08:15 Australia Reserve Bank of Australia Governor Speech 08/12/2009 09:30 U.K. Industrial Production mm 0.4% 1.6% Oct 08/12/2009 09:30 U.K. Industrial Production yy -7.7% -10.3% Oct 08/12/2009 11:00 Germany Industrial Production mm 1% 2.7% Oct 08/12/2009 13:15 Canada Housing Starts yy 159k 157.3k Nov 08/12/2009 14:00 Canada Interest Rate Decision 0.25% Dec 08/12/2009 15:00 USA IBD Consumer Sentiment 47.9 Dec 08/12/2009 23:30 Australia Consumer Confidence -2.5% Dec 08/12/2009 23:50 Japan Gross Domestic Product (GDP) qq 0.7% 1.2% Q3 08/12/2009 23:50 Japan Gross Domestic Product (GDP) yy 2.8% 4.8% Q3 09/12/2009 00:00 U.K. Consumer Confidence 72 Nov 09/12/2009 00:30 Australia International Trade Balance mm -1700m -1849m Oct 09/12/2009 06:45 Swiss Unemployment Rate 4.2% 4.1% Nov 09/12/2009 07:00 Germany Consumer Price Index (CPI) mm -0.2% 0.1% Nov 09/12/2009 07:00 Germany Consumer Price Index (CPI) yy 0.3% 0% Nov 09/12/2009 07:00 Germany HICP mm -0.1% 0.1% Nov 09/12/2009 07:00 Germany HICP yy 0.4% -0.1% Nov 09/12/2009 07:00 Germany International Trade Balance mm 10.7b 9.9b Oct 09/12/2009 09:30 U.K. International Trade Balance mm -6.85b -7.194b Oct 09/12/2009 15:00 USA Wholsale Inventories -0.5% -0.9% Oct 09/12/2009 15:00 USA Wholesale Trade 0.5% 0.7% Oct 09/12/2009 20:00 New Zealand Interest Rate Decision 2.5% 2.5% Dec 09/12/2009 23:50 Japan Machinery Orders mm -4.5% 10.5% Oct 10/12/2009 00:30 Australia Unemployment Rate 5.9% 5.8% Nov 10/12/2009 00:30 Australia Non-Farm Payroll 5000 24500 Nov 10/12/2009 07:00 Germany Wholesale Price Index (WPI) mm -0.4% Nov 10/12/2009 07:00 Germany Wholesale Price Index (WPI) yy -7% Oct 10/12/2009 08:30 Swiss Interest Rate Decision 0.25% Q4 10/12/2009 12:00 U.K. Interest Rate Decision 0.5% 0.5% Dec 10/12/2009 13:30 USA Initial Jobless Claims 457k 457k L/W 10/12/2009 13:30 USA International Trade Balance mm -36.8b -36.47b Oct 10/12/2009 13:30 Canada International Trade Balance mm -0.7b -0.927b Oct 10/12/2009 19:00 USA Budget -134.75b -125.2b Nov 11/12/2009 05:00 Japan Consumer Confidence 40.5 Nov 11/12/2009 09:30 U.K. Core PPI mm 0.2% 0.3% Nov 11/12/2009 09:30 U.K. Core PPI yy 2.1% 2% Nov 11/12/2009 09:30 U.K. Producer Price Index (PPI) yy 0.6% 2.6% Nov 11/12/2009 09:30 U.K. Producer Price Index (PPI) yy 4.1% 0.1% Nov 11/12/2009 13:30 USA Export Prices 0.4% 0.3% Nov 11/12/2009 13:30 USA Import Prices 1% 0.7% Nov 11/12/2009 13:30 USA Core Retail Sales mm 0.4% 0.2% Nov 11/12/2009 13:30 USA Retail Sales mm 0.6% 1.4% Nov 11/12/2009 13:30 Canada House Prices 0.4% 0.5% Oct 11/12/2009 14:55 USA U.Michigan Consumer Sentiment 68.5 67.4 Dec 11/12/2009 15:00 USA Business Inventories -0.3% -0.4% Oct Results for the week of: 29/11/2009 - 04/12/2009 29 November 2009 - 4 December 2009 * GMT Time Date Hour Country Event Result Forecast Previous Period 29/11/2009 21:45 New Zealand Building Permits 11.7% 3.3% Oct 29/11/2009 23:15 Japan Manufacturing PMI 52.3 54.3 Nov 30/11/2009 00:00 U.K. GFK Consumer Sentiment -17.0 -13.0 Nov 30/11/2009 05:00 Japan Housing Starts yy -27.1% -33.5% -37.0% Oct 30/11/2009 09:30 U.K. Consumer Credit mm -0.579b -0.2b -0.262b Oct 30/11/2009 10:00 Europe HICP yy 0.6% 0.4% -0.1% Nov 30/11/2009 13:30 Canada Gross Domestic Product (GDP) mm 0.4% 0.4% 0.0% Sep 30/11/2009 13:30 Canada Gross Domestic Product (GDP) yy 0.4% 0.7% -3.4% Q3 30/11/2009 13:30 Canada Gross Domestic Product (GDP) qq 0.1% -0.9% Q3 30/11/2009 13:30 Canada Producer Price Index (PPI) mm -0.3% 0.3% -0.5% Oct 30/11/2009 13:30 Canada Producer Price Index (PPI) yy -6.3% -6.1% Oct 30/11/2009 14:45 USA Chicago PMI 53.0 54.2 Nov 30/11/2009 17:00 USA Mid-West Mnfg Activity 82.3 Oct 01/12/2009 00:30 Australia Building Permits 1.8% 2.7% Oct 01/12/2009 03:30 Australia Interest Rate Decision 3.75% 3.5% Dec 01/12/2009 06:45 Swiss Gross Domestic Product (GDP) qq 0.1% -0.3% Q3 01/12/2009 06:45 Swiss Gross Domestic Product (GDP) yy -2.0% Q2 01/12/2009 07:00 U.K. House Prices 0.4% Nov 01/12/2009 08:30 Swiss Manufacturing PMI 54.0 Nov 01/12/2009 08:50 Germany Manufacturing PMI 52.0 51.0 Nov 01/12/2009 08:50 Europe Manufacturing PMI 51.0 50.7 Nov 01/12/2009 09:00 Germany Unemployment Rate 8.2% 8.1% Nov 01/12/2009 09:25 U.K. Manufacturing PMI 53.7 Nov 01/12/2009 10:00 Europe Unemployment Rate 9.7% Nov 01/12/2009 15:00 USA Construction Spending -0.5% 0.8% Oct 01/12/2009 15:00 USA Pending Homes Sales 0.6% 6.1% Oct 01/12/2009 15:00 USA Manufacturing PMI 54.7 55.7 Nov 01/12/2009 23:30 Japan Tankan Survey Nov 02/12/2009 10:00 Europe Producer Price Index (PPI) mm -0.4% Oct 02/12/2009 10:00 Europe Producer Price Index (PPI) yy -7.7% Oct 02/12/2009 13:15 USA ADP employment -175.0k -203.0k Nov 02/12/2009 19:00 USA Fed Beige Book 02/12/2009 23:50 Japan Business Confidence -21.7 Q3 03/12/2009 01:30 Australia Retail Sales mm -0.2% 0.3% Oct 03/12/2009 08:50 Europe Services PMI 51.5 50.7 Nov 03/12/2009 08:55 Europe Services PMI 53.2 52.6 Nov 03/12/2009 09:25 U.K. Services PMI 56.9 Nov 03/12/2009 10:00 Europe Gross Domestic Product (GDP) qq 0.4% -0.2% Q3 03/12/2009 10:00 Europe Gross Domestic Product (GDP) yy -4.1% -4.8% Q3 03/12/2009 10:00 Europe Retail Sales mm -0.7% Oct 03/12/2009 10:00 Europe Retail Sales yy -3.6% Oct 03/12/2009 12:45 Europe Interest Rate Decision 1.0% 1.0% Dec 03/12/2009 13:10 Israel Productivity and Costs 9.5% 8.6% L/W 03/12/2009 13:30 USA Initial Jobless Claims 480.0k 466.0k L/W 03/12/2009 15:00 USA Services PMI 51.3 50.6 Nov 04/12/2009 08:15 Swiss Consumer Price Index (CPI) mm 0.6% Nov 04/12/2009 08:15 Swiss Consumer Price Index (CPI) yy -0.8% Nov 04/12/2009 12:00 Canada Non-Farm Payroll -42.3 Nov 04/12/2009 12:00 Canada Unemployment Rate 8.6% Nov 04/12/2009 13:30 USA Non-Farm Payroll -140.0k -190.0k Nov 04/12/2009 13:30 USA Unemployment Rate 10.2% 10.2% Nov 04/12/2009 15:00 USA Durable Goods Orders -0.6% Oct 04/12/2009 15:00 USA New orders XD 0.4% Oct 04/12/2009 15:00 USA Factory Orders yy 0.1% 0.9% Oct 04/12/2009 15:00 Canada Services PMI 61.2 Nov Results for the week of: 23/11/2009 - 27/11/2009 23 November 2009 - 27 November 2009 Date Hour Country Event Result Forecast Previous Period 23/11/2009 00:00 Japan Market Holiday 23/11/2009 08:28 Germany Services PMI 51.5 51.2 50.7 Nov 23/11/2009 08:28 Germany Manufacturing PMI 52.0 51.7 51.1 Nov 23/11/2009 08:58 Europe Manufacturing PMI 51.0 51.2 50.7 Nov 23/11/2009 08:58 Europe Services PMI 53.2 52.8 52.6 Nov 23/11/2009 13:30 Canada Core Retail Sales yy 1.1% 0.4% 0.5% Sep 23/11/2009 13:30 Canada Core Retail Sales mm 1.0% 0.5% 0.8% Sep 23/11/2009 15:00 USA Existing Home Sales (Units) 6.10m 5.70m 5.57m Oct 23/11/2009 15:30 Israel Interest Rate Decision 1.00% 0.75% 0.75% Dec 24/11/2009 07:00 Germany Gross Domestic Product (GDP) qq 0.7% 0.3% Q3 24/11/2009 07:00 Germany Gross Domestic Product (GDP) yy -4.7% -7.1% Q3 24/11/2009 08:15 Swiss Non-Farm Payroll 3.963m 3.94m Q3 24/11/2009 09:00 Germany IFO Business Climate: index 93.9 92.5 91.9 Nov 24/11/2009 10:00 Europe Factory Orders mm 1.5% 0.8% 2.0% Sep 24/11/2009 10:00 Europe Factory Orders yy -16.5% -17.7% -23.1% Sep 24/11/2009 13:30 USA Core PCE qq 1.3% 1.4% 1.4% Q3 24/11/2009 13:30 USA Personal Consumption Exp. qq 2.7% 2.8% 2.8% Q3 24/11/2009 14:00 USA House Prices 0.3% 0.8% 1.2% Sep 24/11/2009 15:00 USA Richmond Fed srvs -22.0 Nov 24/11/2009 15:00 USA Consumer Confidence 47.7 47.7 Nov 24/11/2009 15:00 USA House Prices -3.6% Sep 24/11/2009 22:00 Australia Reserve Bank of Australia Governor Speech 24/11/2009 23:50 Japan International Trade Balance mm 452.2b 520.6b Oct 25/11/2009 00:00 USA Building Permits 0.575m Oct 25/11/2009 07:00 Germany GFK Consumer Sentiment 3.8 4.0 Dec 25/11/2009 09:30 U.K. Gross Domestic Product (GDP) qq -0.4% Q3 25/11/2009 09:30 U.K. Gross Domestic Product (GDP) yy -5.2% Q3 25/11/2009 13:30 USA Personal Consumption 0.4% -0.5% Oct 25/11/2009 13:30 USA Core PCE mm 0.1% 0.1% Oct 25/11/2009 13:30 USA Core PCE yy 1.3% Oct 25/11/2009 13:30 USA New orders XD 0.4% 0.8% Oct 25/11/2009 13:30 USA Durable Goods Orders 0.5% 1.4% Oct 25/11/2009 13:30 USA Initial Jobless Claims 505.0k L/W 25/11/2009 13:30 USA Personal Consumption Exp. mm 0.1% Oct 25/11/2009 13:30 USA Personal Consumption Exp. yy -0.5% Oct 25/11/2009 13:30 USA Personal Income 0.1% 0.0% Oct 25/11/2009 14:55 USA U.Michigan Consumer Sentiment 66.0 70.6 Nov 25/11/2009 15:00 USA New Home sales 0.41m 0.402m Oct 25/11/2009 16:00 USA KC Fed 6.0 Nov 25/11/2009 19:00 USA Protocol of last interest rate meeting 25/11/2009 23:50 Japan Protocol of last interest rate meeting Oct 26/11/2009 00:00 USA Market Holiday 26/11/2009 00:00 Germany HICP mm 0.1% Nov 26/11/2009 00:00 Germany HICP yy -0.1% Nov 26/11/2009 00:00 Germany Consumer Price Index (CPI) mm 0.0% 0.1% Nov 26/11/2009 00:00 Germany Consumer Price Index (CPI) yy -0.1% Nov 26/11/2009 09:00 Germany M3 Money Supply yy 1.8% Oct 26/11/2009 11:00 U.K. CBI Sales 8.0 Nov 26/11/2009 21:45 New Zealand International Trade Balance mm Oct 26/11/2009 23:30 Japan House hold Spending 0.7% 1.0% Oct 26/11/2009 23:30 Japan Core CPI yy -2.2% -2.3% Oct 26/11/2009 23:30 Japan Core CPI mm -2.2% Oct 26/11/2009 23:30 Japan Unemployment Rate 5.4% 5.3% Oct 26/11/2009 23:50 Japan Retail Sales yy -1.5% -1.4% Oct 27/11/2009 10:00 Germany Industrial Sentiment -22.0 -21.0 Nov 27/11/2009 10:00 Germany Service Sentiment -7.0 Nov 27/11/2009 10:30 Swiss KOF Purchasing Manager ind 1.45 Nov 27/11/2009 13:30 Canada Current Account -11.2b Q3 Results for the week of: 15/11/2009 - 20/11/2009 15 November 2009 - 20 November 2009 * GMT Time Date Hour Country Event Result Forecast Previous Period 15/11/2009 21:45 New Zealand Producer Price Index (PPI) mm 0.3% -0.7% Q3 15/11/2009 23:50 Japan Gross Domestic Product (GDP) yy 2.9% 2.3% Q3 15/11/2009 23:50 Japan Gross Domestic Product (GDP) qq 0.7% 0.6% Q3 16/11/2009 10:00 Europe Core HICP mm 0.3% 0.2% Oct 16/11/2009 10:00 Europe Core HICP yy 1.1% 1.1% Oct 16/11/2009 10:00 Europe HICP mm 0.3% 0.0% Oct 16/11/2009 10:00 Europe HICP yy -0.1% -0.3% Oct 16/11/2009 13:30 USA New-York Fed Survey 31.0 34.57 Nov 16/11/2009 13:30 USA Core Retail Sales mm 0.4% 0.5% Oct 16/11/2009 13:30 USA Retail Sales mm 0.8% -1.5% Oct 16/11/2009 15:00 USA Business Inventories -0.6% -1.5% Sep 16/11/2009 17:15 USA Fed Chairman Bernanke Speaks 17/11/2009 08:15 Swiss Retail Sales mm 1.0%- Sep 17/11/2009 09:30 U.K. Consumer Price Index (CPI) mm 0.2% 0.0% Oct 17/11/2009 09:30 U.K. Consumer Price Index (CPI) yy 1.6% 1.1% Oct 17/11/2009 09:30 U.K. Retail Price Index (RPI) mm 0.4% Oct 17/11/2009 09:30 U.K. Retail Price Index (RPI) yy -0.9% -1.4% Oct 17/11/2009 09:30 U.K. RPI ex. Mortgage (RPIX) mm 0.4% Oct 17/11/2009 09:30 U.K. RPI ex. Mortgage (RPIX) yy 1.8% 1.3% Oct 17/11/2009 10:00 Europe International Trade Balance yy -4.0b Sep 17/11/2009 13:30 USA Producer Price Index (PPI) yy -4.8% Oct 17/11/2009 13:30 USA Producer Price Index (PPI) mm 0.4% -0.6% Oct 17/11/2009 13:30 USA Core PPI mm 0.1% -0.1% Oct 17/11/2009 13:30 USA Core PPI yy 1.8% Oct 17/11/2009 14:00 USA Capital Flow 10.2b Sep 17/11/2009 14:15 USA Capacity Utilization 70.8% 70.5% Oct 17/11/2009 14:15 USA Industrial Production mm 0.4% 0.7% Oct 17/11/2009 18:00 USA NAHB housing market INDEX 19.0 18.0 Nov 18/11/2009 09:00 Europe Current Account -1.3b Sep 18/11/2009 09:00 Europe Capital Flow 57.3b Sep 18/11/2009 09:30 U.K. Protocol of last interest rate meeting 18/11/2009 11:00 U.K. CBI Sales -51.0 Nov 18/11/2009 12:00 Canada Core CPI mm 0.3% Oct 18/11/2009 12:00 Canada Core CPI yy 1.5% Oct 18/11/2009 12:00 Canada Consumer Price Index (CPI) mm 0.0% Oct 18/11/2009 12:00 Canada Consumer Price Index (CPI) yy -0.9% Oct 18/11/2009 13:30 USA Building Permits 0.58m 0.575m Oct 18/11/2009 13:30 USA Core CPI mm 0.1% 0.2% Oct 18/11/2009 13:30 USA Consumer Price Index (CPI) mm 0.2% 0.2% Oct 18/11/2009 13:30 USA Core CPI yy 1.6% 1.5% Oct 18/11/2009 13:30 USA Consumer Price Index (CPI) yy -0.2% -1.3% Oct 18/11/2009 13:30 USA Housing Starts yy 0.6m 0.59m Oct 19/11/2009 07:15 Swiss International Trade Balance mm 1918.0m Oct 19/11/2009 09:30 U.K. Retail Sales mm 0.4% 0.0% Oct 19/11/2009 09:30 U.K. Retail Sales yy 2.7% 2.4% Oct 19/11/2009 09:30 U.K. Consumer Credit mm 7.1b 14.812b Oct 19/11/2009 09:30 U.K. M3 Money Supply yy 0.8% Oct 19/11/2009 13:30 USA Initial Jobless Claims 502.0k L/W 19/11/2009 13:30 Canada Wholesale Trade -1.4% Sep 19/11/2009 15:00 USA Leading Economic Indicators 0.4% 1.0% Oct 19/11/2009 15:00 USA Philadelphia Fed Survey 12.5 11.5 Nov 20/11/2009 04:00 Japan Interest Rate Decision 0.1% Nov 20/11/2009 07:00 Germany Producer Price Index (PPI) mm 0.2% -0.5% Oct 20/11/2009 07:00 Germany Producer Price Index (PPI) yy -7.4% -7.6% Oct Results for the week of: 09/11/2009 - 13/11/2009 9 November 2009 - 13 November 2009 * GMT Time Date Hour Country Event Result Forecast Previous Period 09/11/2009 07:00 Germany International Trade Balance mm 9.9b 11.4b 10.6b Sep 09/11/2009 11:00 Germany Industrial Production mm 2.7% 1.0% 1.7% Sep 09/11/2009 13:15 Canada Housing Starts yy 157.3k 150.1k Oct 09/11/2009 23:50 Japan Current Account 0.2% -4.1% 10.4% Sep 10/11/2009 07:00 Germany Consumer Price Index (CPI) mm 0.1% 0.1% -0.4% Oct 10/11/2009 07:00 Germany Consumer Price Index (CPI) yy 0.0% 0.0% -0.3% Oct 10/11/2009 07:00 Germany HICP mm 0.1% 0.2% -0.5% Oct 10/11/2009 07:00 Germany HICP yy -0.1% 0.0% -0.5% Oct 10/11/2009 09:30 U.K. International Trade Balance mm -7.194b -6.1b -6.24b Sep 10/11/2009 10:00 Germany ZEW Economic Sentiment 51.1 55.0 56.0 Nov 10/11/2009 15:00 USA IBD Consumer Sentiment 47.9 48.7 Nov 10/11/2009 23:30 Australia Consumer Confidence -2.5% 1.7% Nov 10/11/2009 23:50 Japan Machinery Orders mm 10.5% 2.9% 0.5% Sep 11/11/2009 09:30 U.K. Initial Jobless Claims 12.9k 20.0k 20.8k Oct 11/11/2009 09:30 U.K. Unemployment Rate 7.8% 8.0% 7.9% Sep 11/11/2009 10:30 U.K. Bank of England Quarterly Inflation Report 11/11/2009 21:45 New Zealand Core Retail Sales mm 0.0% 0.4% 1.2% Sep 11/11/2009 21:45 New Zealand Retail Sales mm 0.2% 0.4% 1.1% Sep 11/11/2009 21:45 New Zealand Retail Sales yy -0.5% -0.7% -1.1% Sep 12/11/2009 00:30 Australia Non-Farm Payroll 24500 -10000 40600 Oct 12/11/2009 00:30 Australia Unemployment Rate 5.8% 5.8% 5.7% Oct 12/11/2009 10:00 Swiss ZEW Economic Sentiment 65.0 Nov 12/11/2009 10:00 Europe Industrial Production mm 0.5% 0.9% Sep 12/11/2009 10:00 Europe Industrial Production yy -14.1% Sep 12/11/2009 13:30 USA Initial Jobless Claims 512.0k L/W 12/11/2009 13:30 Canada House Prices 0.1% Sep 12/11/2009 19:00 USA Budget -180.0b -155.53b Oct 13/11/2009 04:30 Japan Capacity Utilization 2.3% Sep 13/11/2009 05:00 Japan Consumer Confidence 40.5 Oct 13/11/2009 07:00 Germany Gross Domestic Product (GDP) qq 0.8% 0.3% Q3 13/11/2009 07:00 Germany Gross Domestic Product (GDP) yy -4.8% -7.1% Q3 13/11/2009 08:15 Swiss Producer Price Index (PPI) mm 0.2% Oct 13/11/2009 08:15 Swiss Producer Price Index (PPI) yy -4.9% Oct 13/11/2009 10:00 Europe Gross Domestic Product (GDP) qq 0.5% -0.2% Q3 13/11/2009 10:00 Europe Gross Domestic Product (GDP) yy -3.9% -4.8% Q3 13/11/2009 13:30 USA Export Prices 0.1% -0.3% Oct 13/11/2009 13:30 USA Import Prices 0.5% 0.1% Oct 13/11/2009 13:30 USA International Trade Balance mm -31.5b -30.71b Sep 13/11/2009 13:30 Canada International Trade Balance mm -1.99b Sep 13/11/2009 14:55 USA U.Michigan Consumer Sentiment 72.0 70.6 Nov Results for the week of: 02/11/2009 - 06/11/2009 2 November 2009 - 6 November 2009 * GMT time Date Time Importance Country Event Actual Forecast Previous Period 02/11/2009 00:30 House Prices 4.2% Q4 Country: Australia 02/11/2009 08:30 Manufacturing PMI 54.3 Oct Country: Switzerland Source: Institute for Supply Management. Raw Data Available At: http://www.ism.ws/ISMReport/index.cfm Release Time: 10:00 ET on the first business day of the month for the prior month. 02/11/2009 08:53 Manufacturing PMI 51.1 49.6 Oct Country: Germany Source: Institute for Supply Management. Raw Data Available At: http://www.ism.ws/ISMReport/index.cfm Release Time: 10:00 ET on the first business day of the month for the prior month. 02/11/2009 08:58 Manufacturing PMI 50.7 49.3 Oct Country: EMU Source: Institute for Supply Management. Raw Data Available At: http://www.ism.ws/ISMReport/index.cfm Release Time: 10:00 ET on the first business day of the month for the prior month. 02/11/2009 09:25 Manufacturing PMI 49.5 Oct Country: UK Source: Institute for Supply Management. Raw Data Available At: http://www.ism.ws/ISMReport/index.cfm Release Time: 10:00 ET on the first business day of the month for the prior month. 02/11/2009 15:00 Construction Spending 0.3%- 0.8% Sep Country: US Source: The Census Bureau of the Department of Commerce. Raw Data Available At: http://www.census.gov/const/www/c30index.html Release Time: 10:00 ET on the first business day of the month (data for two months prior). 02/11/2009 15:00 Manufacturing PMI 53.0 52.6 Oct Country: US Source: Institute for Supply Management. Raw Data Available At: http://www.ism.ws/ISMReport/index.cfm Release Time: 10:00 ET on the first business day of the month for the prior month. 02/11/2009 15:00 Pending Homes Sales 1.9% 6.4% Sep Country: US 03/11/2009 Market Holiday Country: Japan 03/11/2009 03:30 Interest Rate Decision 3.25% Nov Country: Australia Source (U.S.): The Federal Reserve Open Market Committee - FOMC. Source (World): The Central Bank Monetary Policy Committee - MPC. 03/11/2009 15:00 Durable Goods Orders 1.0% Sep Country: US Source: The Census Bureau of the Department of Commerce. Raw Data Available At: http://www.census.gov/ftp/pub/indicator/www/m3/index.htm Release Time: 8:30 ET around the 26th of the month (data for month prior). 03/11/2009 15:00 New orders XD 0.5% Sep Country: US Source: The Census Bureau of the Department of Commerce. Raw Data Available At: http://www.census.gov/ftp/pub/indicator/www/m3/index.htm Release Time: 8:30 ET around the 26th of the month (data for month prior). 03/11/2009 15:00 Factory Orders yy 1.0% 0.8%- Sep Country: US Source: The Census Bureau of the Department of Commerce. Raw Data Available At: http://www.census.gov/ftp/pub/indicator/www/m3/index.htm Release Time: 10:00 ET around the first business day of the month (data for two months prior). 04/11/2009 00:00 Consumer Confidence 71.0 Oct Country: UK Source: The Conference Board. Raw Data Available At: http://www.tcb-indicators.org/ Release Time: 10:00 ET on the last Tuesday of the month (data for current month). 04/11/2009 00:30 Building Permits 3.0% 0.1%- Sep Country: Australia Source: The Census Bureau of the Department of Commerce. Raw Data Available At: http://www.census.gov/const/www/newresconstindex.html Release Time: 8:30 ET around the 16th of the month (data for one month prior). 04/11/2009 00:30 Retail Sales mm 0.9% Sep Country: Australia Source: The Census Bureau of the Department of Commerce. Raw Data Available At: http://www.census.gov/svsd/www/advtable.html Release Time: 8:30 ET around the 13th of the month (data for one month prior). 04/11/2009 08:50 Manufacturing PMI 50.9 52.1 Oct Country: Germany Source: Institute for Supply Management. Raw Data Available At: http://www.ism.ws/ISMReport/index.cfm Release Time: 10:00 ET on the first business day of the month for the prior month. 04/11/2009 08:55 Manufacturing PMI 52.3 50.9 Oct Country: EMU Source: Institute for Supply Management. Raw Data Available At: http://www.ism.ws/ISMReport/index.cfm Release Time: 10:00 ET on the first business day of the month for the prior month. 04/11/2009 09:25 Services PMI 55.3 Oct Country: UK Source: Institute for Supply Management. Raw Data Available At: http://www.ism.ws/ISMReport/index.cfm Release Time: 10:00 ET on the first business day of the month for the prior month. 04/11/2009 10:00 Producer Price Index (PPI) mm 0.4% Sep Country: EMU Source: Bureau of Labor statistics, U.S. Department of Labor. Raw Data Available At: http://stats.bls.gov/news.release/ppi.toc.htm Release Time: Around the 11th of each month at 8:30 ET for the prior month. 04/11/2009 13:15 ADP employment 188.0K- 254.0K- Oct Country: US 04/11/2009 15:00 Services PMI 51.8 50.9 Oct Country: US Source: Institute for Supply Management. Raw Data Available At: http://www.ism.ws/ISMReport/index.cfm Release Time: 10:00 ET on the first business day of the month for the prior month. 04/11/2009 19:15 Interest Rate Decision 0.25% Nov Country: US Source (U.S.): The Federal Reserve Open Market Committee - FOMC. Source (World): The Central Bank Monetary Policy Committee - MPC. 04/11/2009 21:45 Unemployment Rate 6.4% 6.0% Q3 Country: NewZealand Source: Bureau of Labor Statistics, U.S. Department of Labor. Raw Data Available At: http://stats.bls.gov/news.release/empsit.toc.htm Release Time: First Friday of the month at 8:30 ET for the prior month. 04/11/2009 23:50 Protocol of last interest rate meeting Oct Country: Japan 05/11/2009 00:30 International Trade Balance mm 1524m- Sep Country: Australia Source: The Census Bureau and the Bureau of Economic Analysis of the Department of Commerce. Raw Data Available At: http://www.census.gov/foreign-trade/www/press.html Release Time: 8:30 ET around the 20th of the month (data for two months prior). 05/11/2009 06:45 Consumer Confidence 42.0- Q4 Country: Switzerland Source: The Conference Board. Raw Data Available At: http://www.tcb-indicators.org/ Release Time: 10:00 ET on the last Tuesday of the month (data for current month). 05/11/2009 08:15 Consumer Price Index (CPI) mm 0.0% Oct Country: Switzerland Source: Bureau of Labor statistics, U.S. Department of Labor. Raw Data Available At: http://stats.bls.gov/news.release/cpi.toc.htm Release Time: 8:30 ET, about the 13th of each month for the prior month. 05/11/2009 08:15 Consumer Price Index (CPI) yy -0.9% Oct Country: Switzerland Source: Bureau of Labor statistics, U.S. Department of Labor. Raw Data Available At: http://stats.bls.gov/news.release/cpi.toc.htm Release Time: 8:30 ET, about the 13th of each month for the prior month. 05/11/2009 08:55 Reserve Bank of Australia Governor Speech Country: Australia 05/11/2009 09:30 Industrial Production mm 2.5%- Sep Country: UK Source: Federal Reserve. Raw Data Available At: http://www.federalreserve.gov/releases/G17/Current/g17.txt Release Time: 9:15 ET around the 15th of the month (data for month prior). 05/11/2009 09:30 Industrial Production yy 11.2%- Sep Country: UK Source: Federal Reserve. Raw Data Available At: http://www.federalreserve.gov/releases/G17/Current/g17.txt Release Time: 9:15 ET around the 15th of the month (data for month prior). 05/11/2009 10:00 Retail Sales mm 0.0% 0.2%- Sep Country: EMU Source: The Census Bureau of the Department of Commerce. Raw Data Available At: http://www.census.gov/svsd/www/advtable.html Release Time: 8:30 ET around the 13th of the month (data for one month prior). 05/11/2009 12:00 Interest Rate Decision 0.5% 0.5% Nov Country: UK Source (U.S.): The Federal Reserve Open Market Committee - FOMC. Source (World): The Central Bank Monetary Policy Committee - MPC. 05/11/2009 12:45 Interest Rate Decision 1.0% 1.0% Nov Country: EMU Source (U.S.): The Federal Reserve Open Market Committee - FOMC. Source (World): The Central Bank Monetary Policy Committee - MPC. 05/11/2009 13:30 Initial Jobless Claims 530.0K L/W Country: US Source: The Employment and Training Administration of the Department of Labor. Raw Data Available At: http://www.dol.gov/opa/media/press/eta/main.htm Release Time: 8:30 ET each Thursday (data for week ended prior Saturday). 05/11/2009 13:30 Building Permits 7.2% Sep Country: Canada Source: The Census Bureau of the Department of Commerce. Raw Data Available At: http://www.census.gov/const/www/newresconstindex.html Release Time: 8:30 ET around the 16th of the month (data for one month prior). 05/11/2009 15:00 Services PMI 61.7 Oct Country: Canada Source: Institute for Supply Management. Raw Data Available At: http://www.ism.ws/ISMReport/index.cfm Release Time: 10:00 ET on the first business day of the month for the prior month. 06/11/2009 06:45 Initial Jobless Claims 4.1% Oct Country: Switzerland Source: The Employment and Training Administration of the Department of Labor. Raw Data Available At: http://www.dol.gov/opa/media/press/eta/main.htm Release Time: 8:30 ET each Thursday (data for week ended prior Saturday). 06/11/2009 06:45 Initial Jobless Claims 3.9% Oct Country: Switzerland Source: The Employment and Training Administration of the Department of Labor. Raw Data Available At: http://www.dol.gov/opa/media/press/eta/main.htm Release Time: 8:30 ET each Thursday (data for week ended prior Saturday). 06/11/2009 09:30 Core PPI mm 0.5% Oct Country: UK Source: Bureau of Labor statistics, U.S. Department of Labor. Raw Data Available At: http://stats.bls.gov/news.release/ppi.toc.htm Release Time: Around the 11th of each month at 8:30 ET for the prior month. 06/11/2009 09:30 Core PPI yy 1.4% Oct Country: UK Source: Bureau of Labor statistics, U.S. Department of Labor. Raw Data Available At: http://stats.bls.gov/news.release/ppi.toc.htm Release Time: Around the 11th of each month at 8:30 ET for the prior month. 06/11/2009 09:30 Producer Price Index (PPI) yy 0.5- Oct Country: UK Source: Bureau of Labor statistics, U.S. Department of Labor. Raw Data Available At: http://stats.bls.gov/news.release/ppi.toc.htm Release Time: Around the 11th of each month at 8:30 ET for the prior month. 06/11/2009 09:30 Producer Price Index (PPI) yy 6.5%- Oct Country: UK Source: Bureau of Labor statistics, U.S. Department of Labor. Raw Data Available At: http://stats.bls.gov/news.release/ppi.toc.htm Release Time: Around the 11th of each month at 8:30 ET for the prior month. 06/11/2009 11:00 Factory Orders mm 0.8%- 1.4% Sep Country: Germany Source: The Census Bureau of the Department of Commerce. Raw Data Available At: http://www.census.gov/ftp/pub/indicator/www/m3/index.htm Release Time: 10:00 ET around the first business day of the month (data for two months prior). 06/11/2009 12:00 Non-Farm Payroll 30.6K Oct Country: Canada Source: Bureau of Labor Statistics, U.S. Department of Labor. Raw Data Available At: http://stats.bls.gov/news.release/empsit.toc.htm Release Time: First Friday of the month at 8:30 ET for the prior month. 06/11/2009 12:00 Unemployment Rate 8.4% Oct Country: Canada Source: Bureau of Labor Statistics, U.S. Department of Labor. Raw Data Available At: http://stats.bls.gov/news.release/empsit.toc.htm Release Time: First Friday of the month at 8:30 ET for the prior month. 06/11/2009 13:30 Non-Farm Payroll 175.0K- 263.0K- Oct Country: US Source: Bureau of Labor Statistics, U.S. Department of Labor. Raw Data Available At: http://stats.bls.gov/news.release/empsit.toc.htm Release Time: First Friday of the month at 8:30 ET for the prior month. 06/11/2009 13:30 Unemployment Rate 9.9% 9.8% Oct Country: US Source: Bureau of Labor Statistics, U.S. Department of Labor. Raw Data Available At: http://stats.bls.gov/news.release/empsit.toc.htm Release Time: First Friday of the month at 8:30 ET for the prior month. 06/11/2009 15:00 Wholsale Inventories 1.0%- 1.3%- Sep Country: US 06/11/2009 15:00 Wholesale Trade 1.0% Sep Country: US Source: The Census Bureau of the Department of Commerce. Raw Data Available At: http://www.census.gov/svsd/www/mwts.html Release Time: 10:00 ET around the fifth business day of the month (data for two months prior). 06/11/2009 20:00 Consumer Credit mm 11.98b- 6.6b- Sep Country: US Source: Federal Reserve. Raw Data Available At: http://www.census.gov/const/www/c30index.html Release Time: 15:00 ET on the fifth business day of the month (data for two months prior). Results for the week of: 25/10/2009 - 30/10/2009 25 October 2009 - 30 October 2009 * GMT Time Date Time Importance Event Actual Forecast Previous Period 25/10/2009 23:30 Producer Price Index (PPI) mm 0.8%- Q3 Country: Australia Source: Bureau of Labor statistics, U.S. Department of Labor. Raw Data Available At: http://stats.bls.gov/news.release/ppi.toc.htm Release Time: Around the 11th of each month at 8:30 ET for the prior month. 25/10/2009 23:30 Producer Price Index (PPI) yy 2.1% Q3 Country: Australia Source: Bureau of Labor statistics, U.S. Department of Labor. Raw Data Available At: http://stats.bls.gov/news.release/ppi.toc.htm Release Time: Around the 11th of each month at 8:30 ET for the prior month. 26/10/2009 00:00 Market Holiday Country: NewZealand 26/10/2009 07:00 GFK Consumer Sentiment 4.5 4.3 Nov Country: Germany 26/10/2009 16:00 Mid-West Mnfg Activity 80.1 Sep Country: US 27/10/2009 Building Permits 0.573 Sep Country: US Source: The Census Bureau of the Department of Commerce. Raw Data Available At: http://www.census.gov/const/www/newresconstindex.html Release Time: 8:30 ET around the 16th of the month (data for one month prior). 27/10/2009 09:00 M3 Money Supply yy 2.2% 2.5% Sep Country: EMU Source: Federal Reserve Board. Raw Data Available At: http://www.bog.frb.fed.us/releases/H6/Current/ Release Time: Every Thursday at 16:30 ET, data for the week ended two Mondays prior. 27/10/2009 11:00 CBI Sales 3.0 Oct Country: UK Source: The Confederation of British Industry (CBI). Raw Data Available At: http://www.cbi.org.uk/home.html 27/10/2009 13:00 House Prices 1.3% 1.6% Aug Country: US 27/10/2009 13:00 House Prices 12.1%- 13.3%- Aug Country: US 27/10/2009 14:00 Consumer Confidence 54.3 53.1 Oct Country: US Source: The Conference Board. Raw Data Available At: http://www.tcb-indicators.org/ Release Time: 10:00 ET on the last Tuesday of the month (data for current month). 27/10/2009 14:00 Richmond Fed srvs 12.0- Oct Country: US Source: Chicago Purchasing Managers Association. Raw Data Available At: http://www.phil.frb.org/ Release Time: Last business day of the month at 10 ET for the current month. 27/10/2009 16:00 Treasury Secretary Speaks Country: US 27/10/2009 23:30 Consumer Price Index (CPI) mm 167.0 Q3 Country: Australia Source: Bureau of Labor statistics, U.S. Department of Labor. Raw Data Available At: http://stats.bls.gov/news.release/cpi.toc.htm Release Time: 8:30 ET, about the 13th of each month for the prior month. 27/10/2009 23:30 Consumer Price Index (CPI) yy 1.5% Q3 Country: Australia Source: Bureau of Labor statistics, U.S. Department of Labor. Raw Data Available At: http://stats.bls.gov/news.release/cpi.toc.htm Release Time: 8:30 ET, about the 13th of each month for the prior month. 27/10/2009 23:30 Consumer Price Index (CPI) mm 0.5% Q3 Country: Australia Source: Bureau of Labor statistics, U.S. Department of Labor. Raw Data Available At: http://stats.bls.gov/news.release/cpi.toc.htm Release Time: 8:30 ET, about the 13th of each month for the prior month. 27/10/2009 23:50 Retail Sales yy 1.6%- 1.8%- Sep Country: Japan Source: The Census Bureau of the Department of Commerce. Raw Data Available At: http://www.census.gov/svsd/www/advtable.html Release Time: 8:30 ET around the 13th of the month (data for one month prior). 28/10/2009 Consumer Price Index (CPI) mm 0.1% 0.4%- Oct Country: Germany Source: Bureau of Labor statistics, U.S. Department of Labor. Raw Data Available At: http://stats.bls.gov/news.release/cpi.toc.htm Release Time: 8:30 ET, about the 13th of each month for the prior month. 28/10/2009 Consumer Price Index (CPI) yy 0.0% 0.3%- Oct Country: Germany Source: Bureau of Labor statistics, U.S. Department of Labor. Raw Data Available At: http://stats.bls.gov/news.release/cpi.toc.htm Release Time: 8:30 ET, about the 13th of each month for the prior month. 28/10/2009 12:30 New orders XD 2.6%- Sep Country: US Source: The Census Bureau of the Department of Commerce. Raw Data Available At: http://www.census.gov/ftp/pub/indicator/www/m3/index.htm Release Time: 8:30 ET around the 26th of the month (data for month prior). 28/10/2009 12:30 Durable Goods Orders 1.3% 2.6%- Sep Country: US Source: The Census Bureau of the Department of Commerce. Raw Data Available At: http://www.census.gov/ftp/pub/indicator/www/m3/index.htm Release Time: 8:30 ET around the 26th of the month (data for month prior). 28/10/2009 14:00 New Home sales 0.44M 0.429M Sep Country: US Source: The Census Bureau of the Department of Commerce. Raw Data Available At: http://www.census.gov/const/newressales.pdf Release Time: 10:00 ET around the last business day of the month (data for month prior). 28/10/2009 20:00 Interest Rate Decision 2.5% 2.5% Country: NewZealand Source (U.S.): The Federal Reserve Open Market Committee - FOMC. Source (World): The Central Bank Monetary Policy Committee - MPC. 28/10/2009 21:45 International Trade Balance mm 725.0M- Sep Country: NewZealand Source: The Census Bureau and the Bureau of Economic Analysis of the Department of Commerce. Raw Data Available At: http://www.census.gov/foreign-trade/www/press.html Release Time: 8:30 ET around the 20th of the month (data for two months prior). 28/10/2009 21:45 International Trade Balance mm 1.77B- 2.37B- Sep Country: NewZealand Source: The Census Bureau and the Bureau of Economic Analysis of the Department of Commerce. Raw Data Available At: http://www.census.gov/foreign-trade/www/press.html Release Time: 8:30 ET around the 20th of the month (data for two months prior). 29/10/2009 03:00 Interest Rate Decision 0.1% Nov Country: Japan Source (U.S.): The Federal Reserve Open Market Committee - FOMC. Source (World): The Central Bank Monetary Policy Committee - MPC. 29/10/2009 09:00 Unemployment Rate 8.3% 8.2% Oct Country: Germany Source: Bureau of Labor Statistics, U.S. Department of Labor. Raw Data Available At: http://stats.bls.gov/news.release/empsit.toc.htm Release Time: First Friday of the month at 8:30 ET for the prior month. 29/10/2009 09:30 Consumer Credit mm 0.15B- 0.309B- Sep Country: UK Source: Federal Reserve. Raw Data Available At: http://www.census.gov/const/www/c30index.html Release Time: 15:00 ET on the fifth business day of the month (data for two months prior). 29/10/2009 10:00 Consumer Confidence 18.0- 19.0- Oct Country: EMU Source: The Conference Board. Raw Data Available At: http://www.tcb-indicators.org/ Release Time: 10:00 ET on the last Tuesday of the month (data for current month). 29/10/2009 10:00 Economic Sentiment 84.3 82.8 Oct Country: EMU 29/10/2009 10:00 Industrial Sentiment 22.0- 24.0- Oct Country: EMU 29/10/2009 12:30 Core PCE qq 1.8% 2.0% Q3 Country: US Source: The Bureau of Economic Analysis of the Department of Commerce. Raw Data Available At: http://www.bea.doc.gov/bea/rels.htm Release Time: 1 29/10/2009 12:30 Initial Jobless Claims 531.0K L/W Country: US Source: The Employment and Training Administration of the Department of Labor. Raw Data Available At: http://www.dol.gov/opa/media/press/eta/main.htm Release Time: 8:30 ET each Thursday (data for week ended prior Saturday). 29/10/2009 12:30 Personal Consumption Exp. yy 2.0% 1.4% Q3 Country: US Source: The Bureau of Economic Analysis of the Department of Commerce. Raw Data Available At: http://www.bea.doc.gov/bea/rels.htm Release Time: 8:30 ET around the first business day of the month (data for two months prior). 29/10/2009 12:30 Producer Price Index (PPI) mm 0.5% Sep Country: Canada Source: Bureau of Labor statistics, U.S. Department of Labor. Raw Data Available At: http://stats.bls.gov/news.release/ppi.toc.htm Release Time: Around the 11th of each month at 8:30 ET for the prior month. 29/10/2009 12:30 Producer Price Index (PPI) yy 6.7%- Sep Country: Canada Source: Bureau of Labor statistics, U.S. Department of Labor. Raw Data Available At: http://stats.bls.gov/news.release/ppi.toc.htm Release Time: Around the 11th of each month at 8:30 ET for the prior month. 29/10/2009 12:30 Gross Domestic Product (GDP) qq 3.2% -0.7% Q3 Country: US Source: Bureau of Economic Analysis, U.S. Department of Commerce. Raw Data Available At: http://www.bea.doc.gov/bea/dn1.htm Release Time: Third or fourth week of the month at 8:30 ET for the prior quarter, with subsequent revisions released in the second and third months of the quarter. 29/10/2009 21:45 Building Permits 1.7% Sep Country: NewZealand Source: The Census Bureau of the Department of Commerce. Raw Data Available At: http://www.census.gov/const/www/newresconstindex.html Release Time: 8:30 ET around the 16th of the month (data for one month prior). 29/10/2009 23:15 Manufacturing PMI 54.4 Oct Country: Japan Source: Institute for Supply Management. Raw Data Available At: http://www.ism.ws/ISMReport/index.cfm Release Time: 10:00 ET on the first business day of the month for the prior month. 29/10/2009 23:30 House hold Spending 1.3% 2.6% Sep Country: Japan 29/10/2009 23:30 Consumer Price Index (CPI) yy 2.4%- 2.4%- Sep Country: Japan Source: Bureau of Labor statistics, U.S. Department of Labor. Raw Data Available At: http://stats.bls.gov/news.release/cpi.toc.htm Release Time: 8:30 ET, about the 13th of each month for the prior month. 29/10/2009 23:30 Unemployment Rate 5.6% 5.5% Sep Country: Japan Source: Bureau of Labor Statistics, U.S. Department of Labor. Raw Data Available At: http://stats.bls.gov/news.release/empsit.toc.htm Release Time: First Friday of the month at 8:30 ET for the prior month. 30/10/2009 05:00 Construction Spending 25.2%- Sep Country: Japan Source: The Census Bureau of the Department of Commerce. Raw Data Available At: http://www.census.gov/const/www/c30index.html Release Time: 10:00 ET on the first business day of the month (data for two months prior). 30/10/2009 05:00 Housing Starts yy 37.1%- 38.3%- Sep Country: Japan Source: The Census Bureau of the Department of Commerce. Raw Data Available At: http://www.census.gov/const/www/newresconstindex.html Release Time: 8:30 ET around the 16th of the month (data for one month prior). 30/10/2009 10:00 HICP yy 0.1%- 0.3%- Oct Country: EMU Source: EU Eurostat. Raw Data Available At: ttp://europa.eu.int/comm/eurostat/ 30/10/2009 10:00 Unemployment Rate 9.7% 9.6% Sep Country: EMU Source: Bureau of Labor Statistics, U.S. Department of Labor. Raw Data Available At: http://stats.bls.gov/news.release/empsit.toc.htm Release Time: First Friday of the month at 8:30 ET for the prior month. 30/10/2009 10:30 KOF Purchasing Manager ind 1.3 0.85 Oct Country: Switzerland 30/10/2009 12:30 Personal Consumption 0.5%- 1.3%- Sep Country: US 30/10/2009 12:30 Core PCE mm 0.2% 0.1% Sep Country: US Source: The Bureau of Economic Analysis of the Department of Commerce. Raw Data Available At: http://www.bea.doc.gov/bea/rels.htm Release Time: 8:30 ET around the first business day of the month (data for two months prior). 30/10/2009 12:30 Core PCE yy 1.3% Sep Country: US Source: The Bureau of Economic Analysis of the Department of Commerce. Raw Data Available At: http://www.bea.doc.gov/bea/rels.htm Release Time: 8:30 ET around the first business day of the month (data for two months prior). 30/10/2009 12:30 Personal Consumption Exp. mm 0.3% Sep Country: US Source: The Bureau of Economic Analysis of the Department of Commerce. Raw Data Available At: http://www.bea.doc.gov/bea/rels.htm Release Time: 8:30 ET around the first business day of the month (data for two months prior). 30/10/2009 12:30 Personal Consumption Exp. yy 0.5%- Sep Country: US Source: The Bureau of Economic Analysis of the Department of Commerce. Raw Data Available At: http://www.bea.doc.gov/bea/rels.htm Release Time: 8:30 ET around the first business day of the month (data for two months prior). 30/10/2009 12:30 Personal Income 0.1% 0.2% Sep Country: US Source: The Bureau of Economic Analysis of the Department of Commerce. Raw Data Available At: http://www.bea.doc.gov/bea/rels.htm Release Time: 8:30 ET around the first business day of the month (data for two months prior). 30/10/2009 12:30 Gross Domestic Product (GDP) mm 0.0% Aug Country: Canada Source: Bureau of Economic Analysis, U.S. Department of Commerce. Raw Data Available At: http://www.bea.doc.gov/bea/dn1.htm Release Time: Third or fourth week of the month at 8:30 ET for the prior quarter, with subsequent revisions released in the second and third months of the quarter. 30/10/2009 13:45 Chicago PMI 49.1 46.1 Oct Country: US Source: Chicago Purchasing Managers Association. Raw Data Available At: http://www.phil.frb.org/ Release Time: Last business day of the month at 10 ET for the current month. 30/10/2009 13:55 U.Michigan Consumer Sentiment 73.5 Oct Country: US Source: The University of Michigan. Release Time: Preliminary: 10:00 ET on the second Friday of the month (data for current month); Final: 10:00 ET on the fourth Friday of the month (data for current month). Results for the week of: 18/10/2009 - 23/10/2009 18 October 2009 - 23 October 2009 *GMT Time Date Time Importance Event Actual Forecast Previous Period 18/10/2009 23:50 Protocol of last interest rate meeting Sep Country: Japan 19/10/2009 01:00 Fed Chairman Bernanke Speaks Country: US 19/10/2009 15:00 Fed Chairman Bernanke Speaks Country: US 20/10/2009 06:00 Producer Price Index (PPI) mm -0.1% 0.5% Sep Country: Germany Source: Bureau of Labor statistics, U.S. Department of Labor. Raw Data Available At: http://stats.bls.gov/news.release/ppi.toc.htm Release Time: Around the 11th of each month at 8:30 ET for the prior month. 20/10/2009 06:00 Producer Price Index (PPI) yy -7.1% -6.9% Sep Country: Germany Source: Bureau of Labor statistics, U.S. Department of Labor. Raw Data Available At: http://stats.bls.gov/news.release/ppi.toc.htm Release Time: Around the 11th of each month at 8:30 ET for the prior month. 20/10/2009 08:30 M3 Money Supply yy 0.1% Sep Country: UK Source: Federal Reserve Board. Raw Data Available At: http://www.bog.frb.fed.us/releases/H6/Current/ Release Time: Every Thursday at 16:30 ET, data for the week ended two Mondays prior. 20/10/2009 12:30 Housing Starts yy 0.61m 0.598m Sep Country: US Source: The Census Bureau of the Department of Commerce. Raw Data Available At: http://www.census.gov/const/www/newresconstindex.html Release Time: 8:30 ET around the 16th of the month (data for one month prior). 20/10/2009 12:30 Producer Price Index (PPI) yy -4.0% -4.3% Sep Country: US Source: Bureau of Labor statistics, U.S. Department of Labor. Raw Data Available At: http://stats.bls.gov/news.release/ppi.toc.htm Release Time: Around the 11th of each month at 8:30 ET for the prior month. 20/10/2009 12:30 Producer Price Index (PPI) mm 0.1% 1.7% Sep Country: US Source: Bureau of Labor statistics, U.S. Department of Labor. Raw Data Available At: http://stats.bls.gov/news.release/ppi.toc.htm Release Time: Around the 11th of each month at 8:30 ET for the prior month. 20/10/2009 12:30 Core PPI mm 0.1% 0.2% Sep Country: US Source: Bureau of Labor statistics, U.S. Department of Labor. Raw Data Available At: http://stats.bls.gov/news.release/ppi.toc.htm Release Time: Around the 11th of each month at 8:30 ET for the prior month. 20/10/2009 12:30 Core PPI yy 2.0% 2.3% Sep Country: US Source: Bureau of Labor statistics, U.S. Department of Labor. Raw Data Available At: http://stats.bls.gov/news.release/ppi.toc.htm Release Time: Around the 11th of each month at 8:30 ET for the prior month. 20/10/2009 12:30 Leading Economic Indicators 1.1% Sep Country: Canada Source: The Conference Board. Raw Data Available At: http://www.tcb-indicators.org/ Release Time: 8:30 ET around the third week of the month for the month prior. 20/10/2009 12:30 Wholesale Trade 2.8% Aug Country: Canada Source: The Census Bureau of the Department of Commerce. Raw Data Available At: http://www.census.gov/svsd/www/mwts.html Release Time: 10:00 ET around the fifth business day of the month (data for two months prior). 20/10/2009 12:30 House Prices Sep Country: US 20/10/2009 12:30 Building Permits 0.59m Sep Country: US Source: The Census Bureau of the Department of Commerce. Raw Data Available At: http://www.census.gov/const/www/newresconstindex.html Release Time: 8:30 ET around the 16th of the month (data for one month prior). 20/10/2009 13:00 Interest Rate Decision 0.25% Nov Country: Canada Source (U.S.): The Federal Reserve Open Market Committee - FOMC. Source (World): The Central Bank Monetary Policy Committee - MPC. 21/10/2009 08:30 Protocol of last interest rate meeting Country: UK 21/10/2009 10:00 CBI Sales -48 Oct Country: UK Source: The Confederation of British Industry (CBI). Raw Data Available At: http://www.cbi.org.uk/home.html 21/10/2009 23:50 International Trade Balance mm 629.8b 185.7b Sep Country: Japan Source: The Census Bureau and the Bureau of Economic Analysis of the Department of Commerce. Raw Data Available At: http://www.census.gov/foreign-trade/www/press.html Release Time: 8:30 ET around the 20th of the month (data for two months prior). 22/10/2009 06:15 International Trade Balance mm 1785m Sep Country: Switzerland Source: The Census Bureau and the Bureau of Economic Analysis of the Department of Commerce. Raw Data Available At: http://www.census.gov/foreign-trade/www/press.html Release Time: 8:30 ET around the 20th of the month (data for two months prior). 22/10/2009 08:00 Capital Flow -17.6b Aug Country: EMU 22/10/2009 08:00 Current Account 6.6b Aug Country: EMU 22/10/2009 08:30 Retail Sales mm 0.5% 0.0% Sep Country: UK Source: The Census Bureau of the Department of Commerce. Raw Data Available At: http://www.census.gov/svsd/www/advtable.html Release Time: 8:30 ET around the 13th of the month (data for one month prior). 22/10/2009 08:30 Retail Sales yy 2.8% 2.1% Sep Country: UK Source: The Census Bureau of the Department of Commerce. Raw Data Available At: http://www.census.gov/svsd/www/advtable.html Release Time: 8:30 ET around the 13th of the month (data for one month prior). 22/10/2009 12:30 Initial Jobless Claims 514.0k L/W Country: US Source: The Employment and Training Administration of the Department of Labor. Raw Data Available At: http://www.dol.gov/opa/media/press/eta/main.htm Release Time: 8:30 ET each Thursday (data for week ended prior Saturday). 22/10/2009 12:30 Core Retail Sales mm -0.6% Aug Country: Canada Source: The Census Bureau of the Department of Commerce. Raw Data Available At: http://www.census.gov/svsd/www/advtable.html Release Time: 8:30 ET around the 13th of the month (data for one month prior). 22/10/2009 12:30 Core Retail Sales yy -0.8% Aug Country: Canada Source: The Census Bureau of the Department of Commerce. Raw Data Available At: http://www.census.gov/svsd/www/advtable.html Release Time: 8:30 ET around the 13th of the month (data for one month prior). 22/10/2009 14:00 Leading Economic Indicators 0.5% 0.6% Sep Country: US Source: The Conference Board. Raw Data Available At: http://www.tcb-indicators.org/ Release Time: 8:30 ET around the third week of the month for the month prior. 22/10/2009 14:00 House Prices 0.3% Aug Country: US 23/10/2009 00:30 Import Prices -6.4% Q3 Country: Australia 23/10/2009 00:30 Export Prices -20.6% Q3 Country: Australia 23/10/2009 07:28 Services PMI 52.5 52.1 Oct Country: Germany Source: Institute for Supply Management. Raw Data Available At: http://www.ism.ws/ISMReport/index.cfm Release Time: 10:00 ET on the first business day of the month for the prior month. 23/10/2009 07:28 Manufacturing PMI 50.1 49.6 Oct Country: Germany Source: Institute for Supply Management. Raw Data Available At: http://www.ism.ws/ISMReport/index.cfm Release Time: 10:00 ET on the first business day of the month for the prior month. 23/10/2009 07:58 Manufacturing PMI 50.0 49.3 Oct Country: EMU Source: Institute for Supply Management. Raw Data Available At: http://www.ism.ws/ISMReport/index.cfm Release Time: 10:00 ET on the first business day of the month for the prior month. 23/10/2009 07:58 Services PMI 51.3 50.9 Oct Country: EMU Source: Institute for Supply Management. Raw Data Available At: http://www.ism.ws/ISMReport/index.cfm Release Time: 10:00 ET on the first business day of the month for the prior month. 23/10/2009 08:00 IFO Business Climate: index 92.0 91.3 Oct Country: Germany Source: Ifo Institute for Economic Research. Raw Data Available At: http://www.ifo.de/~cesifo/ifoinstitute.htm Release Time: 10:00 Germany-time around the 26th of the month (data for month prior). 23/10/2009 08:30 Gross Domestic Product (GDP) qq 0.2% -0.6% Q3 Country: UK Source: Bureau of Economic Analysis, U.S. Department of Commerce. Raw Data Available At: http://www.bea.doc.gov/bea/dn1.htm Release Time: Third or fourth week of the month at 8:30 ET for the prior quarter, with subsequent revisions released in the second and third months of the quarter. 23/10/2009 08:30 Gross Domestic Product (GDP) yy -4.6% -5.5% Q3 Country: UK Source: Bureau of Economic Analysis, U.S. Department of Commerce. Raw Data Available At: http://www.bea.doc.gov/bea/dn1.htm Release Time: Third or fourth week of the month at 8:30 ET for the prior quarter, with subsequent revisions released in the second and third months of the quarter. 23/10/2009 09:00 Factory Orders mm 1.0% 2.6% Aug Country: EMU Source: The Census Bureau of the Department of Commerce. Raw Data Available At: http://www.census.gov/ftp/pub/indicator/www/m3/index.htm Release Time: 10:00 ET around the first business day of the month (data for two months prior). 23/10/2009 09:00 Factory Orders yy -22.5% -24.3% Aug Country: EMU Source: The Census Bureau of the Department of Commerce. Raw Data Available At: http://www.census.gov/ftp/pub/indicator/www/m3/index.htm Release Time: 10:00 ET around the first business day of the month (data for two months prior). 23/10/2009 12:30 Fed Chairman Bernanke Speaks Country: US 23/10/2009 14:00 Existing Home Sales (Units) 5.3m 5.1m Sep Country: US Source: The National Association of Realtors. Raw Data Available At: (USA): http://www.realtor.org/research.nsf/pages/EHSdata Release Time: 10:00 ET around the 25th of the month (data for month prior). Results for the week of:12/10/2009 - 16/10/2009 * GMT Time Date Time Importance Event Actual Forecast Previous Period 12/10/2009 Market Holiday Country: Canada 12/10/2009 Market Holiday Country: Japan 12/10/2009 06:00 Wholesale Price Index (WPI) mm 0.7% Sep Country: Germany 12/10/2009 06:00 Wholesale Price Index (WPI) yy -8.3% Sep Country: Germany 12/10/2009 21:45 Core Retail Sales mm -0.5% Aug Country: NewZealand Source: The Census Bureau of the Department of Commerce. Raw Data Available At: http://www.census.gov/svsd/www/advtable.html Release Time: 8:30 ET around the 13th of the month (data for one month prior). 12/10/2009 21:45 Retail Sales mm -0.5% Aug Country: NewZealand Source: The Census Bureau of the Department of Commerce. Raw Data Available At: http://www.census.gov/svsd/www/advtable.html Release Time: 8:30 ET around the 13th of the month (data for one month prior). 12/10/2009 21:45 Retail Sales yy -1.4% Aug Country: NewZealand Source: The Census Bureau of the Department of Commerce. Raw Data Available At: http://www.census.gov/svsd/www/advtable.html Release Time: 8:30 ET around the 13th of the month (data for one month prior). 13/10/2009 05:00 Interest Rate Decision 0.1% Oct Country: Japan Source (U.S.): The Federal Reserve Open Market Committee - FOMC. Source (World): The Central Bank Monetary Policy Committee - MPC. 13/10/2009 07:15 Producer Price Index (PPI) mm 0.1% Sep Country: Switzerland Source: Bureau of Labor statistics, U.S. Department of Labor. Raw Data Available At: http://stats.bls.gov/news.release/ppi.toc.htm Release Time: Around the 11th of each month at 8:30 ET for the prior month. 13/10/2009 07:15 Producer Price Index (PPI) yy -5.5% Sep Country: Switzerland Source: Bureau of Labor statistics, U.S. Department of Labor. Raw Data Available At: http://stats.bls.gov/news.release/ppi.toc.htm Release Time: Around the 11th of each month at 8:30 ET for the prior month. 13/10/2009 08:30 Consumer Price Index (CPI) mm 0.3% 0.4% Sep Country: UK Source: Bureau of Labor statistics, U.S. Department of Labor. Raw Data Available At: http://stats.bls.gov/news.release/cpi.toc.htm Release Time: 8:30 ET, about the 13th of each month for the prior month. 13/10/2009 08:30 Consumer Price Index (CPI) yy 1.3% 1.6% Sep Country: UK Source: Bureau of Labor statistics, U.S. Department of Labor. Raw Data Available At: http://stats.bls.gov/news.release/cpi.toc.htm Release Time: 8:30 ET, about the 13th of each month for the prior month. 13/10/2009 08:30 Retail Price Index (RPI) mm 0.3% 0.5% Sep Country: UK 13/10/2009 08:30 Retail Price Index (RPI) yy -1.5% -1.3% Sep Country: UK 13/10/2009 09:00 ZEW Economic Sentiment 58 57.7 Oct Country: Germany Source: ZEW - The Centre for European Economic Research. Raw Data Available At: http://www.zew.de/ 13/10/2009 12:30 House Prices 0.3% Aug Country: Canada 13/10/2009 14:00 IBD Consumer Sentiment 52.5 Oct Country: US Source: The Conference Board. Raw Data Available At: http://www.tcb-indicators.org/ Release Time: 10:00 ET on the last Tuesday of the month (data for current month). 13/10/2009 18:15 RPI ex. Mortgage (RPIX) yy 1.2% 1.4% Sep Country: UK 14/10/2009 05:00 Consumer Confidence 40.1 Sep Country: Japan Source: The Conference Board. Raw Data Available At: http://www.tcb-indicators.org/ Release Time: 10:00 ET on the last Tuesday of the month (data for current month). 14/10/2009 08:30 Initial Jobless Claims 24k 24.4k Sep Country: UK Source: The Employment and Training Administration of the Department of Labor. Raw Data Available At: http://www.dol.gov/opa/media/press/eta/main.htm Release Time: 8:30 ET each Thursday (data for week ended prior Saturday). 14/10/2009 08:30 ILO Unemployment 8% 7.9% Aug Country: UK Source: Bureau of Labor Statistics, U.S. Department of Labor. Raw Data Available At: http://stats.bls.gov/news.release/empsit.toc.htm Release Time: First Friday of the month at 8:30 ET for the prior month. 14/10/2009 09:00 Industrial Production mm 0.8% -0.3% Aug Country: EMU Source: Federal Reserve. Raw Data Available At: http://www.federalreserve.gov/releases/G17/Current/g17.txt Release Time: 9:15 ET around the 15th of the month (data for month prior). 14/10/2009 09:00 Industrial Production yy -15.5% -15.9% Aug Country: EMU Source: Federal Reserve. Raw Data Available At: http://www.federalreserve.gov/releases/G17/Current/g17.txt Release Time: 9:15 ET around the 15th of the month (data for month prior). 14/10/2009 12:30 Retail Sales mm -1.4% 2.7% Sep Country: US Source: The Census Bureau of the Department of Commerce. Raw Data Available At: http://www.census.gov/svsd/www/advtable.html Release Time: 8:30 ET around the 13th of the month (data for one month prior). 14/10/2009 12:30 Core Retail Sales mm 0.2% 1.1% Sep Country: US Source: The Census Bureau of the Department of Commerce. Raw Data Available At: http://www.census.gov/svsd/www/advtable.html Release Time: 8:30 ET around the 13th of the month (data for one month prior). 14/10/2009 14:00 Business Inventories -0.8% -1% Aug Country: US Source: The Census Bureau of the Department of Commerce. Raw Data Available At: http://www.census.gov/mtis/www/current.html Release Time: 08:30 ET around the 15th of the month (data for two months prior). 14/10/2009 18:00 Protocol of last interest rate meeting Country: US 14/10/2009 23:30 Tankan Survey -33 Oct Country: Japan Source: Bank of Japan. Raw Data Available At: http://www2.boj.or.jp/en/dlong/tk/faqtk.htm 14/10/2009 23:30 Reserve Bank of Australia Governor Speech Country: Australia 15/10/2009 01:00 Australia Consumer Inflation Expectation (Oct) 3.5% 15/10/2009 01:30 Australia RBA Foreign Exchange Transaction (Sep) 576M 15/10/2009 04:30 Japan Capacity Utilization (Aug) 3.9 15/10/2009 04:30 Japan Industrial Production (YoY) (Aug) -22.7% 15/10/2009 05:00 Japan Bank of Japan Monthly Economic Survey 15/10/2009 08:00 European Monetary Union ECB Monthly Report (Oct) 15/10/2009 09:00 European Monetary Union Consumer Price Index - Core (YoY) (Sep) 1.3% 15/10/2009 09:00 European Monetary Union Consumer Price Index (MoM) (Sep) 0.3% 15/10/2009 09:00 European Monetary Union Consumer Price Index (YoY) (Sep) -0.3% 15/10/2009 09:00 Switzerland ZEW Survey - Expectations (Oct) 58 15/10/2009 12:30 United States Consumer Price Index (MoM) (Sep) 0.4% 15/10/2009 12:30 United States Consumer Price Index (YoY) (Sep) -1.5% 15/10/2009 12:30 United States Consumer Price Index Ex Food & Energy (MoM) (Sep) 0.1% 15/10/2009 12:30 United States Consumer Price Index Ex Food & Energy (YoY) (Sep) 1.4% 15/10/2009 12:30 United States Continuing Jobless Claims (Oct 3) 6040K 15/10/2009 12:30 United States Initial Jobless Claims (Oct 10) 521K 15/10/2009 12:30 United States NY Empire State Manufacturing Index (Oct) 18.9 15/10/2009 14:00 United States Philadelphia Fed Manufacturing Survey (Oct) 14.1 15/10/2009 14:30 Canada Bank of Canada Business Outlook Survey 16/10/2009 07:15 Switzerland Adjusted Real Retail Sales (YoY) (Aug) 1% 16/10/2009 09:00 European Monetary Union Trade Balance n.s.a. (Aug) EUR12.6B 16/10/2009 09:00 European Monetary Union Trade Balance s.a. (Aug) EUR6.8B 16/10/2009 11:00 Canada Bank of Canada Consumer Price Index Core (MoM) (Sep) 0.1% 16/10/2009 11:00 Canada Bank of Canada Consumer Price Index Core (YoY) (Sep) 1.6% 16/10/2009 11:00 Canada Consumer Price Index (MoM) (Sep) 0.3% 16/10/2009 11:00 Canada Consumer Price Index (YoY) (Sep) -0.8% 16/10/2009 13:00 United States Net Long-term TIC Flows (Aug) $15.3B 16/10/2009 13:00 United States Total Net TIC Flows (Aug) -$97.5B 16/10/2009 13:15 United States Capacity Utilization (Sep) 69.6% 16/10/2009 13:15 United States Industrial Production (MoM) (Sep) 0.8% 16/10/2009 14:00 United States Reuters/Michigan Consumer Sentiment Index (Oct) 73.5 Results for the week of: 05/10/2009 - 9/10/2009 5 October 2009 - 9 October 2009 * GMT time Date Time Importance Event Actual Forecast Previous Period 05/10/2009 07:53 Services PMI 52.2 53.8 Sep Country: Germany Source: Institute for Supply Management. Raw Data Available At: http://www.ism.ws/ISMReport/index.cfm Release Time: 10:00 ET on the first business day of the month for the prior month. 05/10/2009 07:58 Services PMI 50.6 49.9 Sep Country: EMU Source: Institute for Supply Management. Raw Data Available At: http://www.ism.ws/ISMReport/index.cfm Release Time: 10:00 ET on the first business day of the month for the prior month. 05/10/2009 08:25 Services PMI 54.5 54.1 Sep Country: UK Source: Institute for Supply Management. Raw Data Available At: http://www.ism.ws/ISMReport/index.cfm Release Time: 10:00 ET on the first business day of the month for the prior month. 05/10/2009 09:00 Retail Sales mm -0.5% -0.2% Aug Country: EMU Source: The Census Bureau of the Department of Commerce. Raw Data Available At: http://www.census.gov/svsd/www/advtable.html Release Time: 8:30 ET around the 13th of the month (data for one month prior). 05/10/2009 09:00 Retail Sales yy -2.6% -1.8% Aug Country: EMU Source: The Census Bureau of the Department of Commerce. Raw Data Available At: http://www.census.gov/svsd/www/advtable.html Release Time: 8:30 ET around the 13th of the month (data for one month prior). 05/10/2009 14:00 Manufacturing PMI 50.0 48.4 Sep Country: US Source: Institute for Supply Management. Raw Data Available At: http://www.ism.ws/ISMReport/index.cfm Release Time: 10:00 ET on the first business day of the month for the prior month. 06/10/2009 00:30 International Trade Balance mm 0.9b 1.55b Sep Country: Australia Source: The Census Bureau and the Bureau of Economic Analysis of the Department of Commerce. Raw Data Available At: http://www.census.gov/foreign-trade/www/press.html Release Time: 8:30 ET around the 20th of the month (data for two months prior). 06/10/2009 04:30 Interest Rate Decision 3% 3% Oct Country: Australia Source (U.S.): The Federal Reserve Open Market Committee - FOMC. Source (World): The Central Bank Monetary Policy Committee - MPC. 06/10/2009 07:15 Consumer Price Index (CPI) mm 0.1% 0.1% Sep Country: Switzerland Source: Bureau of Labor statistics, U.S. Department of Labor. Raw Data Available At: http://stats.bls.gov/news.release/cpi.toc.htm Release Time: 8:30 ET, about the 13th of each month for the prior month. 06/10/2009 07:15 Consumer Price Index (CPI) yy -0.8% -0.8% Sep Country: Switzerland Source: Bureau of Labor statistics, U.S. Department of Labor. Raw Data Available At: http://stats.bls.gov/news.release/cpi.toc.htm Release Time: 8:30 ET, about the 13th of each month for the prior month. 06/10/2009 08:30 Industrial Production mm 0.2% 0.5% Aug Country: UK Source: Federal Reserve. Raw Data Available At: http://www.federalreserve.gov/releases/G17/Current/g17.txt Release Time: 9:15 ET around the 15th of the month (data for month prior). 06/10/2009 08:30 Industrial Production yy -8.7% -9.3% Aug Country: UK Source: Federal Reserve. Raw Data Available At: http://www.federalreserve.gov/releases/G17/Current/g17.txt Release Time: 9:15 ET around the 15th of the month (data for month prior). 06/10/2009 12:30 Building Permits -11.4% Aug Country: Canada Source: The Census Bureau of the Department of Commerce. Raw Data Available At: http://www.census.gov/const/www/newresconstindex.html Release Time: 8:30 ET around the 16th of the month (data for one month prior). 06/10/2009 14:00 Services PMI 55.7 Sep Country: Canada Source: Institute for Supply Management. Raw Data Available At: http://www.ism.ws/ISMReport/index.cfm Release Time: 10:00 ET on the first business day of the month for the prior month. 07/10/2009 05:00 Leading Economic Indicators 2.1 Aug Country: Japan Source: The Conference Board. Raw Data Available At: http://www.tcb-indicators.org/ Release Time: 8:30 ET around the third week of the month for the month prior. 07/10/2009 05:45 Unemployment Rate 4.1% 4.0% Sep Country: Switzerland Source: Bureau of Labor Statistics, U.S. Department of Labor. Raw Data Available At: http://stats.bls.gov/news.release/empsit.toc.htm Release Time: First Friday of the month at 8:30 ET for the prior month. 07/10/2009 09:00 Gross Domestic Product (GDP) qq -0.1% -2.5% Q2 Country: EMU Source: Bureau of Economic Analysis, U.S. Department of Commerce. Raw Data Available At: http://www.bea.doc.gov/bea/dn1.htm Release Time: Third or fourth week of the month at 8:30 ET for the prior quarter, with subsequent revisions released in the second and third months of the quarter. 07/10/2009 09:00 Gross Domestic Product (GDP) yy -4.7% -4.9% Q2 Country: EMU Source: Bureau of Economic Analysis, U.S. Department of Commerce. Raw Data Available At: http://www.bea.doc.gov/bea/dn1.htm Release Time: Third or fourth week of the month at 8:30 ET for the prior quarter, with subsequent revisions released in the second and third months of the quarter. 07/10/2009 10:00 Factory Orders mm 1.2% 3.5% Aug Country: Germany Source: The Census Bureau of the Department of Commerce. Raw Data Available At: http://www.census.gov/ftp/pub/indicator/www/m3/index.htm Release Time: 10:00 ET around the first business day of the month (data for two months prior). 07/10/2009 19:00 Consumer Credit mm -6.9b -21.6b Aug Country: US Source: Federal Reserve. Raw Data Available At: http://www.census.gov/const/www/c30index.html Release Time: 15:00 ET on the fifth business day of the month (data for two months prior). 07/10/2009 23:50 Current Account 8.9% -19.4% Aug Country: Japan 08/10/2009 00:30 Non-Farm Payroll -10k -27k Sep Country: Australia Source: Bureau of Labor Statistics, U.S. Department of Labor. Raw Data Available At: http://stats.bls.gov/news.release/empsit.toc.htm Release Time: First Friday of the month at 8:30 ET for the prior month. 08/10/2009 00:30 Unemployment Rate 5.9% 5.8% Sep Country: Australia Source: Bureau of Labor Statistics, U.S. Department of Labor. Raw Data Available At: http://stats.bls.gov/news.release/empsit.toc.htm Release Time: First Friday of the month at 8:30 ET for the prior month. 08/10/2009 10:00 Industrial Production mm 1.6% -0.9% Aug Country: Germany Source: Federal Reserve. Raw Data Available At: http://www.federalreserve.gov/releases/G17/Current/g17.txt Release Time: 9:15 ET around the 15th of the month (data for month prior). 08/10/2009 11:00 Interest Rate Decision 0.5% 0.5% Oct Country: UK Source (U.S.): The Federal Reserve Open Market Committee - FOMC. Source (World): The Central Bank Monetary Policy Committee - MPC. 08/10/2009 11:45 Interest Rate Decision 1.0% 1.0% Oct Country: EMU Source (U.S.): The Federal Reserve Open Market Committee - FOMC. Source (World): The Central Bank Monetary Policy Committee - MPC. 08/10/2009 12:15 Housing Starts yy 150.4k Sep Country: Canada Source: The Census Bureau of the Department of Commerce. Raw Data Available At: http://www.census.gov/const/www/newresconstindex.html Release Time: 8:30 ET around the 16th of the month (data for one month prior). 08/10/2009 12:30 Initial Jobless Claims 551.0k L/W Country: US Source: The Employment and Training Administration of the Department of Labor. Raw Data Available At: http://www.dol.gov/opa/media/press/eta/main.htm Release Time: 8:30 ET each Thursday (data for week ended prior Saturday). 08/10/2009 14:00 Wholsale Inventories -0.9% -1.4% Aug Country: US 08/10/2009 14:00 Wholesale Trade 0.5% 0.5% Aug Country: US Source: The Census Bureau of the Department of Commerce. Raw Data Available At: http://www.census.gov/svsd/www/mwts.html Release Time: 10:00 ET around the fifth business day of the month (data for two months prior). 08/10/2009 23:50 Machinery Orders mm 2.1% -9.3% Aug Country: Japan The Japanese equivalent to Durable Goods Orders. 09/10/2009 06:00 Consumer Price Index (CPI) mm -0.4% 0.2% Sep Country: Germany Source: Bureau of Labor statistics, U.S. Department of Labor. Raw Data Available At: http://stats.bls.gov/news.release/cpi.toc.htm Release Time: 8:30 ET, about the 13th of each month for the prior month. 09/10/2009 06:00 Consumer Price Index (CPI) yy -0.3% 0.0% Sep Country: Germany Source: Bureau of Labor statistics, U.S. Department of Labor. Raw Data Available At: http://stats.bls.gov/news.release/cpi.toc.htm Release Time: 8:30 ET, about the 13th of each month for the prior month. 09/10/2009 06:00 International Trade Balance mm 12.6b 12.4b Aug Country: Germany Source: The Census Bureau and the Bureau of Economic Analysis of the Department of Commerce. Raw Data Available At: http://www.census.gov/foreign-trade/www/press.html Release Time: 8:30 ET around the 20th of the month (data for two months prior). 09/10/2009 08:30 Core PPI mm 0.2% 0.2% Sep Country: UK Source: Bureau of Labor statistics, U.S. Department of Labor. Raw Data Available At: http://stats.bls.gov/news.release/ppi.toc.htm Release Time: Around the 11th of each month at 8:30 ET for the prior month. 09/10/2009 08:30 Core PPI yy 0.9% 0.7% Sep Country: UK Source: Bureau of Labor statistics, U.S. Department of Labor. Raw Data Available At: http://stats.bls.gov/news.release/ppi.toc.htm Release Time: Around the 11th of each month at 8:30 ET for the prior month. 09/10/2009 08:30 Producer Price Index (PPI) yy -6.7% -7.5% Sep Country: UK Source: Bureau of Labor statistics, U.S. Department of Labor. Raw Data Available At: http://stats.bls.gov/news.release/ppi.toc.htm Release Time: Around the 11th of each month at 8:30 ET for the prior month. 09/10/2009 08:30 Producer Price Index (PPI) mm -0.8% 2.2% Sep Country: UK Source: Bureau of Labor statistics, U.S. Department of Labor. Raw Data Available At: http://stats.bls.gov/news.release/ppi.toc.htm Release Time: Around the 11th of each month at 8:30 ET for the prior month. 09/10/2009 08:30 International Trade Balance mm -6.3b -6.479b Aug Country: UK Source: The Census Bureau and the Bureau of Economic Analysis of the Department of Commerce. Raw Data Available At: http://www.census.gov/foreign-trade/www/press.html Release Time: 8:30 ET around the 20th of the month (data for two months prior). 09/10/2009 11:00 Non-Farm Payroll 27.1k Sep Country: Canada Source: Bureau of Labor Statistics, U.S. Department of Labor. Raw Data Available At: http://stats.bls.gov/news.release/empsit.toc.htm Release Time: First Friday of the month at 8:30 ET for the prior month. 09/10/2009 11:00 Unemployment Rate 8.7% Sep Country: Canada Source: Bureau of Labor Statistics, U.S. Department of Labor. Raw Data Available At: http://stats.bls.gov/news.release/empsit.toc.htm Release Time: First Friday of the month at 8:30 ET for the prior month. 09/10/2009 12:30 International Trade Balance mm -1.43b Oct Country: Canada Source: The Census Bureau and the Bureau of Economic Analysis of the Department of Commerce. Raw Data Available At: http://www.census.gov/foreign-trade/www/press.html Release Time: 8:30 ET around the 20th of the month (data for two months prior). 09/10/2009 15:55 International Trade Balance mm -32.0b -31.96b Aug Country: US Source: The Census Bureau and the Bureau of Economic Analysis of the Department of Commerce. Raw Data Available At: http://www.census.gov/foreign-trade/www/press.html Release Time: 8:30 ET around the 20th of the month (data for two months prior). Results for the week of: 27/09/2009 - 2/10/2009 28 September 2009 - 2 October 2009 * GMT time Date Time Importance Event Actual Forecast Previous Period 28/09/2009 06:00 Import Prices 0.6% -0.9% Aug Country: Germany 28/09/2009 23:30 Core CPI yy -2.2% Aug Country: Japan Source: Bureau of Labor statistics, U.S. Department of Labor. Raw Data Available At: http://stats.bls.gov/news.release/ppi.toc.htm Release Time: Around the 11th of each month at 8:30 ET for the prior month. 29/09/2009 06:00 Retail Sales mm 0.1% 0.7% Aug Country: Germany Source: The Census Bureau of the Department of Commerce. Raw Data Available At: http://www.census.gov/svsd/www/advtable.html Release Time: 8:30 ET around the 13th of the month (data for one month prior). 29/09/2009 06:00 Retail Sales yy -1.0% 0.0% Aug Country: Germany Source: The Census Bureau of the Department of Commerce. Raw Data Available At: http://www.census.gov/svsd/www/advtable.html Release Time: 8:30 ET around the 13th of the month (data for one month prior). 29/09/2009 08:30 Consumer Credit mm 0.0b -0.217b Aug Country: UK Source: Federal Reserve. Raw Data Available At: http://www.census.gov/const/www/c30index.html Release Time: 15:00 ET on the fifth business day of the month (data for two months prior). 29/09/2009 08:30 Gross Domestic Product (GDP) qq -0.7% -0.7% Q2 Country: UK Source: Bureau of Economic Analysis, U.S. Department of Commerce. Raw Data Available At: http://www.bea.doc.gov/bea/dn1.htm Release Time: Third or fourth week of the month at 8:30 ET for the prior quarter, with subsequent revisions released in the second and third months of the quarter. 29/09/2009 08:30 Gross Domestic Product (GDP) yy -5.5% -5.5% Q2 Country: UK Source: Bureau of Economic Analysis, U.S. Department of Commerce. Raw Data Available At: http://www.bea.doc.gov/bea/dn1.htm Release Time: Third or fourth week of the month at 8:30 ET for the prior quarter, with subsequent revisions released in the second and third months of the quarter. 29/09/2009 09:00 Consumer Confidence -21.0 -22.0 Sep Country: EMU Source: The Conference Board. Raw Data Available At: http://www.tcb-indicators.org/ Release Time: 10:00 ET on the last Tuesday of the month (data for current month). 29/09/2009 09:00 Economic Sentiment 82.2 80.6 Sep Country: EMU 29/09/2009 09:00 Industrial Sentiment -24.0 -26.0 Sep Country: EMU 29/09/2009 09:00 Service Sentiment -8.0 -11.0 Sep Country: EMU 29/09/2009 10:00 CBI Sales -13.0 -16.0 Sep Country: UK Source: The Confederation of British Industry (CBI). Raw Data Available At: http://www.cbi.org.uk/home.html 29/09/2009 13:00 House Prices 0.8% 1.4% Jul Country: US 29/09/2009 14:00 Consumer Confidence 56.5 54.1 Sep Country: US Source: The Conference Board. Raw Data Available At: http://www.tcb-indicators.org/ Release Time: 10:00 ET on the last Tuesday of the month (data for current month). 29/09/2009 23:15 Manufacturing PMI 53.6 Sep Country: Japan Source: Institute for Supply Management. Raw Data Available At: http://www.ism.ws/ISMReport/index.cfm Release Time: 10:00 ET on the first business day of the month for the prior month. 30/09/2009 00:00 Retail Sales mm 0.5% -1.0% Aug Country: Australia Source: The Census Bureau of the Department of Commerce. Raw Data Available At: http://www.census.gov/svsd/www/advtable.html Release Time: 8:30 ET around the 13th of the month (data for one month prior). 30/09/2009 01:30 Building Permits 1.5% 7.7% Aug Country: Australia Source: The Census Bureau of the Department of Commerce. Raw Data Available At: http://www.census.gov/const/www/newresconstindex.html Release Time: 8:30 ET around the 16th of the month (data for one month prior). 30/09/2009 05:00 Construction Spending -42.8% Aug Country: Japan Source: The Census Bureau of the Department of Commerce. Raw Data Available At: http://www.census.gov/const/www/c30index.html Release Time: 10:00 ET on the first business day of the month (data for two months prior). 30/09/2009 05:00 Housing Starts yy -32.1% Aug Country: Japan Source: The Census Bureau of the Department of Commerce. Raw Data Available At: http://www.census.gov/const/www/newresconstindex.html Release Time: 8:30 ET around the 16th of the month (data for one month prior). 30/09/2009 06:00 Retail Sales mm 0.1% 0.7% Aug Country: Germany Source: The Census Bureau of the Department of Commerce. Raw Data Available At: http://www.census.gov/svsd/www/advtable.html Release Time: 8:30 ET around the 13th of the month (data for one month prior). 30/09/2009 06:00 Retail Sales yy -1.0% -1.0% Aug Country: Germany Source: The Census Bureau of the Department of Commerce. Raw Data Available At: http://www.census.gov/svsd/www/advtable.html Release Time: 8:30 ET around the 13th of the month (data for one month prior). 30/09/2009 08:00 Unemployment Rate 8.4% 8.3% Sep Country: Germany Source: Bureau of Labor Statistics, U.S. Department of Labor. Raw Data Available At: http://stats.bls.gov/news.release/empsit.toc.htm Release Time: First Friday of the month at 8:30 ET for the prior month. 30/09/2009 09:00 Core HICP yy -0.2% -0.2% Sep Country: EMU Source: EU Eurostat. Raw Data Available At: http://europa.eu.int/comm/eurostat/ 30/09/2009 09:30 KOF Purchasing Manager ind 0.5 -0.04 Sep Country: Switzerland 30/09/2009 12:15 ADP employment -212k -298k Sep Country: US 30/09/2009 12:30 Core PCE qq 2.0% 2.0% Q2 Country: US Source: The Bureau of Economic Analysis of the Department of Commerce. Raw Data Available At: http://www.bea.doc.gov/bea/rels.htm Release Time: 1:00 30/09/2009 12:30 Gross Domestic Product (GDP) mm 0.1% Jul Country: Canada Source: Bureau of Economic Analysis, U.S. Department of Commerce. Raw Data Available At: http://www.bea.doc.gov/bea/dn1.htm Release Time: Third or fourth week of the month at 8:30 ET for the prior quarter, with subsequent revisions released in the second and third months of the quarter. 30/09/2009 12:30 Core PPI mm -0.5% Aug Country: Canada Source: Bureau of Labor statistics, U.S. Department of Labor. Raw Data Available At: http://stats.bls.gov/news.release/ppi.toc.htm Release Time: Around the 11th of each month at 8:30 ET for the prior month. 30/09/2009 12:30 Producer Price Index (PPI) mm -6.9% Aug Country: Canada Source: Bureau of Labor statistics, U.S. Department of Labor. Raw Data Available At: http://stats.bls.gov/news.release/ppi.toc.htm Release Time: Around the 11th of each month at 8:30 ET for the prior month. 30/09/2009 23:50 Retail Sales yy -2.5% Aug Country: Japan Source: The Census Bureau of the Department of Commerce. Raw Data Available At: http://www.census.gov/svsd/www/advtable.html Release Time: 8:30 ET around the 13th of the month (data for one month prior). 01/10/2009 07:30 Manufacturing PMI 50.2 Sep Country: Switzerland Source: Institute for Supply Management. Raw Data Available At: http://www.ism.ws/ISMReport/index.cfm Release Time: 10:00 ET on the first business day of the month for the prior month. 01/10/2009 07:50 Manufacturing PMI 49.6 49.2 Sep Country: Germany Source: Institute for Supply Management. Raw Data Available At: http://www.ism.ws/ISMReport/index.cfm Release Time: 10:00 ET on the first business day of the month for the prior month. 01/10/2009 07:55 Manufacturing PMI 49.0 48.2 Sep Country: EMU Source: Institute for Supply Management. Raw Data Available At: http://www.ism.ws/ISMReport/index.cfm Release Time: 10:00 ET on the first business day of the month for the prior month. 01/10/2009 08:25 Manufacturing PMI 50.1 49.7 Sep Country: UK Source: Institute for Supply Management. Raw Data Available At: http://www.ism.ws/ISMReport/index.cfm Release Time: 10:00 ET on the first business day of the month for the prior month. 01/10/2009 09:00 Unemployment Rate 9.6% 9.5% Aug Country: EMU Source: Bureau of Labor Statistics, U.S. Department of Labor. Raw Data Available At: http://stats.bls.gov/news.release/empsit.toc.htm Release Time: First Friday of the month at 8:30 ET for the prior month. 01/10/2009 09:00 Producer Price Index (PPI) mm -7.5% -8.5% Aug Country: EMU Source: Bureau of Labor statistics, U.S. Department of Labor. Raw Data Available At: http://stats.bls.gov/news.release/ppi.toc.htm Release Time: Around the 11th of each month at 8:30 ET for the prior month. 01/10/2009 12:30 Consumer Spending 1.0% 0.2% Aug Country: US 01/10/2009 12:30 Core PCE mm 0.1% 0.1% Aug Country: US Source: The Bureau of Economic Analysis of the Department of Commerce. Raw Data Available At: http://www.bea.doc.gov/bea/rels.htm Release Time: 8:30 ET around the first business day of the month (data for two months prior). 01/10/2009 12:30 Core PCE yy 1.4% Aug Country: US Source: The Bureau of Economic Analysis of the Department of Commerce. Raw Data Available At: http://www.bea.doc.gov/bea/rels.htm Release Time: 8:30 ET around the first business day of the month (data for two months prior). 01/10/2009 12:30 Initial Jobless Claims 530.0 L/W Country: US Source: The Employment and Training Administration of the Department of Labor. Raw Data Available At: http://www.dol.gov/opa/media/press/eta/main.htm Release Time: 8:30 ET each Thursday (data for week ended prior Saturday). 01/10/2009 12:30 Personal Consumption Exp. mm 0.0% Aug Country: US Source: The Bureau of Economic Analysis of the Department of Commerce. Raw Data Available At: http://www.bea.doc.gov/bea/rels.htm Release Time: 8:30 ET around the first business day of the month (data for two months prior). 01/10/2009 12:30 Personal Consumption Exp. yy -0.8% Aug Country: US Source: The Bureau of Economic Analysis of the Department of Commerce. Raw Data Available At: http://www.bea.doc.gov/bea/rels.htm Release Time: 8:30 ET around the first business day of the month (data for two months prior). 01/10/2009 12:30 Personal Income 0.1% 0.0% Aug Country: US Source: The Bureau of Economic Analysis of the Department of Commerce. Raw Data Available At: http://www.bea.doc.gov/bea/rels.htm Release Time: 8:30 ET around the first business day of the month (data for two months prior). 01/10/2009 14:00 Construction Spending -0.2% -0.2% Aug Country: US Source: The Census Bureau of the Department of Commerce. Raw Data Available At: http://www.census.gov/const/www/c30index.html Release Time: 10:00 ET on the first business day of the month (data for two months prior). 01/10/2009 14:00 Manufacturing PMI 54.0 52.9 Sep Country: US Source: Institute for Supply Management. Raw Data Available At: http://www.ism.ws/ISMReport/index.cfm Release Time: 10:00 ET on the first business day of the month for the prior month. 01/10/2009 14:00 Pending Homes Sales 1.5% 3.2% Aug Country: US 01/10/2009 23:30 House hold Spending -2.0% Aug Country: Japan 01/10/2009 23:30 Unemployment Rate 5.7% Aug Country: Japan Source: Bureau of Labor Statistics, U.S. Department of Labor. Raw Data Available At: http://stats.bls.gov/news.release/empsit.toc.htm Release Time: First Friday of the month at 8:30 ET for the prior month. 02/10/2009 09:00 Producer Price Index (PPI) mm 0.4% -0.8% Aug Country: EMU Source: Bureau of Labor statistics, U.S. Department of Labor. Raw Data Available At: http://stats.bls.gov/news.release/ppi.toc.htm Release Time: Around the 11th of each month at 8:30 ET for the prior month. 02/10/2009 12:30 Non-Farm Payroll -188.0k -216.0k Sep Country: US Source: Bureau of Labor Statistics, U.S. Department of Labor. Raw Data Available At: http://stats.bls.gov/news.release/empsit.toc.htm Release Time: First Friday of the month at 8:30 ET for the prior month. 02/10/2009 12:30 Unemployment Rate 9.8% 9.7% Sep Country: US Source: Bureau of Labor Statistics, U.S. Department of Labor. Raw Data Available At: http://stats.bls.gov/news.release/empsit.toc.htm Release Time: First Friday of the month at 8:30 ET for the prior month. 02/10/2009 14:00 Durable Goods Orders Aug Country: US Source: The Census Bureau of the Department of Commerce. Raw Data Available At: http://www.census.gov/ftp/pub/indicator/www/m3/index.htm Release Time: 8:30 ET around the 26th of the month (data for month prior). 02/10/2009 14:00 New orders XD Aug Country: US Source: The Census Bureau of the Department of Commerce. Raw Data Available At: http://www.census.gov/ftp/pub/indicator/www/m3/index.htm Release Time: 8:30 ET around the 26th of the month (data for month prior). 02/10/2009 14:00 Factory Orders yy 1.1% 1.3% Aug Country: US Source: The Census Bureau of the Department of Commerce. Raw Data Available At: http://www.census.gov/ftp/pub/indicator/www/m3/index.htm Release Time: 10:00 ET around the first business day of the month (data for two months prior). Results for the week of:21/09/2009 - 25/09/2009 21 September 2009 - 25 September 2009 Timezone GMT Date Time Importance Event Actual Forecast Previous Period 21/09/2009 Market Holiday Country: Japan 21/09/2009 14:00 Leading Economic Indicators 0.7% 0.6% Aug Country: US Source: The Conference Board. Raw Data Available At: http://www.tcb-indicators.org/ Release Time: 8:30 ET around the third week of the month for the month prior. 21/09/2009 21:45 Current Account -13.04b -15.25b Q2 Country: NewZealand 22/09/2009 Market Holiday Country: Japan 22/09/2009 06:15 International Trade Balance mm 2347.0m Aug Country: Switzerland Source: The Census Bureau and the Bureau of Economic Analysis of the Department of Commerce. Raw Data Available At: http://www.census.gov/foreign-trade/www/press.html Release Time: 8:30 ET around the 20th of the month (data for two months prior). 22/09/2009 12:30 Core Retail Sales mm 1.0% Jul Country: Canada Source: The Census Bureau of the Department of Commerce. Raw Data Available At: http://www.census.gov/svsd/www/advtable.html Release Time: 8:30 ET around the 13th of the month (data for one month prior). 22/09/2009 12:30 Retail Sales mm 1.0% Jul Country: Canada Source: The Census Bureau of the Department of Commerce. Raw Data Available At: http://www.census.gov/svsd/www/advtable.html Release Time: 8:30 ET around the 13th of the month (data for one month prior). 22/09/2009 14:00 House Prices 0.5% Jul Country: US 22/09/2009 14:00 Richmond Fed srvs -8 Sep Country: US Source: Chicago Purchasing Managers Association. Raw Data Available At: http://www.phil.frb.org/ Release Time: Last business day of the month at 10 ET for the current month. 22/09/2009 22:45 Gross Domestic Product (GDP) yy -2.7% -2.7% Q2 Country: NewZealand Source: Bureau of Economic Analysis, U.S. Department of Commerce. Raw Data Available At: http://www.bea.doc.gov/bea/dn1.htm Release Time: Third or fourth week of the month at 8:30 ET for the prior quarter, with subsequent revisions released in the second and third months of the quarter. 23/09/2009 Market Holiday Country: Japan 23/09/2009 06:25 Manufacturing PMI 51.0 49.2 Sep Country: Germany Source: Institute for Supply Management. Raw Data Available At: http://www.ism.ws/ISMReport/index.cfm Release Time: 10:00 ET on the first business day of the month for the prior month. ISM: Institute for Supply Management formerly NAPM: National Association of Purchasing Managers 23/09/2009 07:25 Services PMI 54.0 53.8 Sep Country: Germany Source: Institute for Supply Management. Raw Data Available At: http://www.ism.ws/ISMReport/index.cfm Release Time: 10:00 ET on the first business day of the month for the prior month. ISM: Institute for Supply Management formerly NAPM: National Association of Purchasing Managers 23/09/2009 07:55 Manufacturing PMI 49.8 48.2 Sep Country: EMU Source: Institute for Supply Management. Raw Data Available At: http://www.ism.ws/ISMReport/index.cfm Release Time: 10:00 ET on the first business day of the month for the prior month. ISM: Institute for Supply Management formerly NAPM: National Association of Purchasing Managers 23/09/2009 07:55 Services PMI 50.6 49.9 Sep Country: EMU Source: Institute for Supply Management. Raw Data Available At: http://www.ism.ws/ISMReport/index.cfm Release Time: 10:00 ET on the first business day of the month for the prior month. 23/09/2009 08:00 Factory Orders mm 2.0% 31.% Jul Country: EMU Source: The Census Bureau of the Department of Commerce. Raw Data Available At: http://www.census.gov/ftp/pub/indicator/www/m3/index.htm Release Time: 10:00 ET around the first business day of the month (data for two months prior). 23/09/2009 08:30 Protocol of last interest rate meeting Country: UK 23/09/2009 09:00 Factory Orders yy -25.1% Jul Country: EMU Source: The Census Bureau of the Department of Commerce. Raw Data Available At: http://www.census.gov/ftp/pub/indicator/www/m3/index.htm Release Time: 10:00 ET around the first business day of the month (data for two months prior). 23/09/2009 14:00 Existing Home Sales (Units) 5.3m 5.24m Aug Country: US Source: The National Association of Realtors. Raw Data Available At: (USA): http://www.realtor.org/research.nsf/pages/EHSdata Release Time: 10:00 ET around the 25th of the month (data for month prior). 23/09/2009 18:15 Interest Rate Decision 0.25% Oct Country: US Source (U.S.): The Federal Reserve Open Market Committee - FOMC. Source (World): The Central Bank Monetary Policy Committee - MPC. 23/09/2009 23:45 Export Prices -36.0% -36.5% Aug Country: Japan 23/09/2009 23:50 Import Prices -41.5% -40.8% Aug Country: Japan 23/09/2009 23:50 International Trade Balance mm 364.2 Aug Country: Japan Source: The Census Bureau and the Bureau of Economic Analysis of the Department of Commerce. Raw Data Available At: http://www.census.gov/foreign-trade/www/press.html Release Time: 8:30 ET around the 20th of the month (data for two months prior). 24/09/2009 08:00 IFO Business Climate: index 92.0 90.5 Sep Country: Germany Source: Ifo Institute for Economic Research. Raw Data Available At: http://www.ifo.de/~cesifo/ifoinstitute.htm Release Time: 10:00 Germany-time around the 26th of the month (data for month prior). 24/09/2009 12:30 Initial Jobless Claims 545.0 L/W Country: US Source: The Employment and Training Administration of the Department of Labor. Raw Data Available At: http://www.dol.gov/opa/media/press/eta/main.htm Release Time: 8:30 ET each Thursday (data for week ended prior Saturday). 24/09/2009 22:45 International Trade Balance mm -163.0m -273.0m Aug Country: NewZealand Source: The Census Bureau and the Bureau of Economic Analysis of the Department of Commerce. Raw Data Available At: http://www.census.gov/foreign-trade/www/press.html Release Time: 8:30 ET around the 20th of the month (data for two months prior). 24/09/2009 23:50 Protocol of last interest rate meeting Aug Country: Japan 25/09/2009 Building Permits 0.579m Aug Country: US Source: The Census Bureau of the Department of Commerce. Raw Data Available At: http://www.census.gov/const/www/newresconstindex.html Release Time: 8:30 ET around the 16th of the month (data for one month prior). 25/09/2009 12:30 New orders XD 4.5% Aug Country: US Source: The Census Bureau of the Department of Commerce. Raw Data Available At: http://www.census.gov/ftp/pub/indicator/www/m3/index.htm Release Time: 8:30 ET around the 26th of the month (data for month prior). 25/09/2009 12:30 Durable Goods Orders 1.1% 5.1% Aug Country: US Source: The Census Bureau of the Department of Commerce. Raw Data Available At: http://www.census.gov/ftp/pub/indicator/www/m3/index.htm Release Time: 8:30 ET around the 26th of the month (data for month prior). 25/09/2009 13:55 U.Michigan Consumer Sentiment 70.2 65.7 Sep Country: Italy Source: The University of Michigan. Release Time: Preliminary: 10:00 ET on the second Friday of the month (data for current month); Final: 10:00 ET on the fourth Friday of the month (data for current month). 25/09/2009 14:00 New Home sales 0.45m 0.433m Aug Country: US Source: The Census Bureau of the Department of Commerce. Raw Data Available At: http://www.census.gov/const/newressales.pdf Release Time: 10:00 ET around the last business day of the month (data for month prior). Results for the week of:13/09/2009 - 18/09/2009 13 September 2009 - 18 September 2009 Timezone: GMT Date Time Importance Event Actual Forecast Previous Period 13/09/2009 22:45 Retail Sales mm 0.5% 0.1% Jul Country: NewZealand Source: The Census Bureau of the Department of Commerce. Raw Data Available At: http://www.census.gov/svsd/www/advtable.html Release Time: 8:30 ET around the 13th of the month (data for one month prior). 13/09/2009 22:45 Retail Sales yy -0.4% -1.1% Jul Country: NewZealand Source: The Census Bureau of the Department of Commerce. Raw Data Available At: http://www.census.gov/svsd/www/advtable.html Release Time: 8:30 ET around the 13th of the month (data for one month prior). 13/09/2009 22:45 Core Retail Sales mm 0.6% -0.4% Jul Country: NewZealand Source: The Census Bureau of the Department of Commerce. Raw Data Available At: http://www.census.gov/svsd/www/advtable.html Release Time: 8:30 ET around the 13th of the month (data for one month prior). 14/09/2009 07:15 Producer Price Index (PPI) mm 0.1% 0% Aug Country: Switzerland Source: Bureau of Labor statistics, U.S. Department of Labor. Raw Data Available At: http://stats.bls.gov/news.release/ppi.toc.htm Release Time: Around the 11th of each month at 8:30 ET for the prior month. 14/09/2009 07:15 Producer Price Index (PPI) yy -5.4% -6.1% Aug Country: Switzerland Source: Bureau of Labor statistics, U.S. Department of Labor. Raw Data Available At: http://stats.bls.gov/news.release/ppi.toc.htm Release Time: Around the 11th of each month at 8:30 ET for the prior month. 14/09/2009 09:00 Industrial Production mm -0.2% -0.6% Jul Country: EMU Source: Federal Reserve. Raw Data Available At: http://www.federalreserve.gov/releases/G17/Current/g17.txt Release Time: 9:15 ET around the 15th of the month (data for month prior). 14/09/2009 09:00 Industrial Production yy -16.6% -17% Jul Country: EMU Source: Federal Reserve. Raw Data Available At: http://www.federalreserve.gov/releases/G17/Current/g17.txt Release Time: 9:15 ET around the 15th of the month (data for month prior). 14/09/2009 12:30 Capacity Utilization 69.3 Q2 Country: Canada Source: Federal Reserve. Raw Data Available At: http://www.federalreserve.gov/releases/G17/Current/g17.txt Release Time: 9:15 ET around the 15th of the month (data for month prior). 15/09/2009 01:30 Protocol of last interest rate meeting Country: Australia 15/09/2009 07:15 Factory Orders yy -17.6% Q2 Country: Switzerland Source: The Census Bureau of the Department of Commerce. Raw Data Available At: http://www.census.gov/ftp/pub/indicator/www/m3/index.htm Release Time: 10:00 ET around the first business day of the month (data for two months prior). 15/09/2009 08:30 Consumer Price Index (CPI) mm 0.3% 0% Aug Country: UK Source: Bureau of Labor statistics, U.S. Department of Labor. Raw Data Available At: http://stats.bls.gov/news.release/cpi.toc.htm Release Time: 8:30 ET, about the 13th of each month for the prior month. 15/09/2009 08:30 Consumer Price Index (CPI) yy 1.4% 1.8% Aug Country: UK Source: Bureau of Labor statistics, U.S. Department of Labor. Raw Data Available At: http://stats.bls.gov/news.release/cpi.toc.htm Release Time: 8:30 ET, about the 13th of each month for the prior month. 15/09/2009 09:00 ZEW Economic Sentiment 60 56.1 Sep Country: Germany Source: ZEW - The Centre for European Economic Research. Raw Data Available At: http://www.zew.de/ 15/09/2009 12:30 Producer Price Index (PPI) yy -5.3% -6.8% Aug Country: US Source: Bureau of Labor statistics, U.S. Department of Labor. Raw Data Available At: http://stats.bls.gov/news.release/ppi.toc.htm Release Time: Around the 11th of each month at 8:30 ET for the prior month. 15/09/2009 12:30 Producer Price Index (PPI) mm 0.8% -0.9% Aug Country: US Source: Bureau of Labor statistics, U.S. Department of Labor. Raw Data Available At: http://stats.bls.gov/news.release/ppi.toc.htm Release Time: Around the 11th of each month at 8:30 ET for the prior month. 15/09/2009 12:30 Core PPI mm 0.1% -0.1% Aug Country: US Source: Bureau of Labor statistics, U.S. Department of Labor. Raw Data Available At: http://stats.bls.gov/news.release/ppi.toc.htm Release Time: Around the 11th of each month at 8:30 ET for the prior month. 15/09/2009 12:30 Core PPI yy 2.2% 2.6% Aug Country: US Source: Bureau of Labor statistics, U.S. Department of Labor. Raw Data Available At: http://stats.bls.gov/news.release/ppi.toc.htm Release Time: Around the 11th of each month at 8:30 ET for the prior month. 15/09/2009 12:30 Core Retail Sales mm 0.3% -0.6% Aug Country: US Source: The Census Bureau of the Department of Commerce. Raw Data Available At: http://www.census.gov/svsd/www/advtable.html Release Time: 8:30 ET around the 13th of the month (data for one month prior). 15/09/2009 12:30 Retail Sales mm 1.9% -0.1% Aug Country: US Source: The Census Bureau of the Department of Commerce. Raw Data Available At: http://www.census.gov/svsd/www/advtable.html Release Time: 8:30 ET around the 13th of the month (data for one month prior). 15/09/2009 14:00 Business Inventories -0.8% -1.1% Jul Country: US Source: The Census Bureau of the Department of Commerce. Raw Data Available At: http://www.census.gov/mtis/www/current.html Release Time: 08:30 ET around the 15th of the month (data for two months prior). 15/09/2009 14:00 IBD Consumer Sentiment 50.3 Sep Country: US Source: The Conference Board. Raw Data Available At: http://www.tcb-indicators.org/ Release Time: 10:00 ET on the last Tuesday of the month (data for current month). 16/09/2009 03:00 Interest Rate Decision 0.1% 0.1% Sep Country: Japan Source (U.S.): The Federal Reserve Open Market Committee - FOMC. Source (World): The Central Bank Monetary Policy Committee - MPC. 16/09/2009 07:15 Retail Sales mm 0.9% Jul Country: Switzerland Source: The Census Bureau of the Department of Commerce. Raw Data Available At: http://www.census.gov/svsd/www/advtable.html Release Time: 8:30 ET around the 13th of the month (data for one month prior). 16/09/2009 08:30 Initial Jobless Claims 25k 24.9k Aug Country: UK Source: The Employment and Training Administration of the Department of Labor. Raw Data Available At: http://www.dol.gov/opa/media/press/eta/main.htm Release Time: 8:30 ET each Thursday (data for week ended prior Saturday). 16/09/2009 08:30 Unemployment Rate 7.9% 7.8% Jul Country: UK Source: Bureau of Labor Statistics, U.S. Department of Labor. Raw Data Available At: http://stats.bls.gov/news.release/empsit.toc.htm Release Time: First Friday of the month at 8:30 ET for the prior month. 16/09/2009 09:00 ZEW Economic Sentiment 18.6 Sep Country: Switzerland Source: ZEW - The Centre for European Economic Research. Raw Data Available At: http://www.zew.de/ 16/09/2009 09:00 Core HICP mm 0.2% -0.5% Aug Country: EMU Source: EU Eurostat. Raw Data Available At: http://europa.eu.int/comm/eurostat/ 16/09/2009 09:00 Core HICP yy 1.2% 1.2% Aug Country: EMU Source: EU Eurostat. Raw Data Available At: http://europa.eu.int/comm/eurostat/ 16/09/2009 09:00 HICP mm 0.3% -0.7% Aug Country: EMU Source: EU Eurostat. Raw Data Available At: ttp://europa.eu.int/comm/eurostat/ 16/09/2009 09:00 HICP yy -0.2% -0.7% Aug Country: EMU Source: EU Eurostat. Raw Data Available At: ttp://europa.eu.int/comm/eurostat/ 16/09/2009 12:30 Core CPI mm 0.1% 0.1% Aug Country: US Source: Bureau of Labor statistics, U.S. Department of Labor. Raw Data Available At: http://stats.bls.gov/news.release/cpi.toc.htm 8:30 ET, about the 13th of each month for the prior month. 16/09/2009 12:30 Consumer Price Index (CPI) mm 0.3% 0% Aug Country: US Source: Bureau of Labor statistics, U.S. Department of Labor. Raw Data Available At: http://stats.bls.gov/news.release/cpi.toc.htm Release Time: 8:30 ET, about the 13th of each month for the prior month. 16/09/2009 12:30 Core CPI yy 1.4% 1.5% Aug Country: US Source: Bureau of Labor statistics, U.S. Department of Labor. Raw Data Available At: http://stats.bls.gov/news.release/cpi.toc.htm 8:30 ET, about the 13th of each month for the prior month. 16/09/2009 12:30 Consumer Price Index (CPI) yy -1.7% -2.1% Aug Country: US Source: Bureau of Labor statistics, U.S. Department of Labor. Raw Data Available At: http://stats.bls.gov/news.release/cpi.toc.htm Release Time: 8:30 ET, about the 13th of each month for the prior month. 16/09/2009 12:30 Current Account -92b -101.5b Q2 Country: US 16/09/2009 13:00 Capital Flow -31.2b Jul Country: US 16/09/2009 13:15 Capacity Utilization 69% 68.5% Aug Country: US Source: Federal Reserve. Raw Data Available At: http://www.federalreserve.gov/releases/G17/Current/g17.txt Release Time: 9:15 ET around the 15th of the month (data for month prior). 16/09/2009 13:15 Industrial Production mm 0.6% 0.5% Aug Country: US Source: Federal Reserve. Raw Data Available At: http://www.federalreserve.gov/releases/G17/Current/g17.txt Release Time: 9:15 ET around the 15th of the month (data for month prior). 16/09/2009 23:30 Tankan Survey -42 Sep Country: Japan Source: Bank of Japan. Raw Data Available At: http://www2.boj.or.jp/en/dlong/tk/faqtk.htm 17/09/2009 08:30 Retail Sales mm 0.1% 0.4% Aug Country: UK Source: The Census Bureau of the Department of Commerce. Raw Data Available At: http://www.census.gov/svsd/www/advtable.html Release Time: 8:30 ET around the 13th of the month (data for one month prior). 17/09/2009 08:30 Retail Sales mm 2.6% 3.3% Aug Country: UK Source: The Census Bureau of the Department of Commerce. Raw Data Available At: http://www.census.gov/svsd/www/advtable.html Release Time: 8:30 ET around the 13th of the month (data for one month prior). 17/09/2009 09:00 International Trade Balance mm 5.2b 4.6b Jul Country: EMU Source: The Census Bureau and the Bureau of Economic Analysis of the Department of Commerce. Raw Data Available At: http://www.census.gov/foreign-trade/www/press.html Release Time: 8:30 ET around the 20th of the month (data for two months prior). 17/09/2009 10:00 CBI Sales -50 -54 Sep Country: UK Source: The Confederation of British Industry (CBI). Raw Data Available At: http://www.cbi.org.uk/home.html 17/09/2009 11:00 Consumer Price Index (CPI) mm -0.3% Aug Country: Canada Source: Bureau of Labor statistics, U.S. Department of Labor. Raw Data Available At: http://stats.bls.gov/news.release/cpi.toc.htm Release Time: 8:30 ET, about the 13th of each month for the prior month. 17/09/2009 11:00 Consumer Price Index (CPI) yy -0.9% Aug Country: Canada Source: Bureau of Labor statistics, U.S. Department of Labor. Raw Data Available At: http://stats.bls.gov/news.release/cpi.toc.htm Release Time: 8:30 ET, about the 13th of each month for the prior month. 17/09/2009 12:00 Interest Rate Decision 0.25% 0.25% Q3 Country: Switzerland Source (U.S.): The Federal Reserve Open Market Committee - FOMC. Source (World): The Central Bank Monetary Policy Committee - MPC. 17/09/2009 12:30 Building Permits 0.58m 0.564m Aug Country: US Source: The Census Bureau of the Department of Commerce. Raw Data Available At: http://www.census.gov/const/www/newresconstindex.html Release Time: 8:30 ET around the 16th of the month (data for one month prior). 17/09/2009 12:30 Housing Starts yy 0.6k 0.581m Aug Country: US Source: The Census Bureau of the Department of Commerce. Raw Data Available At: http://www.census.gov/const/www/newresconstindex.html Release Time: 8:30 ET around the 16th of the month (data for one month prior). 17/09/2009 12:30 Initial Jobless Claims 545k 550k L/W Country: US Source: The Employment and Training Administration of the Department of Labor. Raw Data Available At: http://www.dol.gov/opa/media/press/eta/main.htm Release Time: 8:30 ET each Thursday (data for week ended prior Saturday). 17/09/2009 12:30 Leading Economic Indicators 0.4% Aug Country: Canada Source: The Conference Board. Raw Data Available At: http://www.tcb-indicators.org/ Release Time: 8:30 ET around the third week of the month for the month prior. 17/09/2009 14:00 Philadelphia Fed Survey 8 4.2 Sep Country: US Source: Chicago Purchasing Managers Association. Raw Data Available At: http://www.phil.frb.org/ Release Time: Last business day of the month at 10 ET for the current month. 18/09/2009 06:00 Producer Price Index (PPI) mm 0.2% -1.5% Aug Country: Germany Source: Bureau of Labor statistics, U.S. Department of Labor. Raw Data Available At: http://stats.bls.gov/news.release/ppi.toc.htm Release Time: Around the 11th of each month at 8:30 ET for the prior month. 18/09/2009 06:00 Producer Price Index (PPI) mm -7.2% -7.8% Aug Country: Germany Source: Bureau of Labor statistics, U.S. Department of Labor. Raw Data Available At: http://stats.bls.gov/news.release/ppi.toc.htm Release Time: Around the 11th of each month at 8:30 ET for the prior month. 18/09/2009 08:00 Current Account -5.3b Jul Country: EMU 18/09/2009 08:00 Capital Flow 36.7b Jul Country: EMU 18/09/2009 12:30 Wholesale Trade 0.6% Jul Country: Canada Source: The Census Bureau of the Department of Commerce. Raw Data Available At: http://www.census.gov/svsd/www/mwts.html Release Time: 10:00 ET around the fifth business day of the month (data for two months prior). Results for the week of: 07/09/2009 - 11/09/2009 7 September 2009 - 11 September 2009 Timezone *GMT Date Time Importance Event Actual Forecast Previous Period 07/09/2009 Market Holiday Country: US 07/09/2009 Market Holiday Country: Canada 07/09/2009 10:00 Factory Orders yy 3.5% 2.0% 4.5% Jul Country: Germany Source: The Census Bureau of the Department of Commerce. Raw Data Available At: http://www.census.gov/ftp/pub/indicator/www/m3/index.htm Release Time: 10:00 ET around the first business day of the month (data for two months prior). 07/09/2009 23:50 Current Account -19.4% -7.3% 144.4% Jul Country: Japan 08/09/2009 05:45 Unemployment Rate 4.0% 4.0% 3.9% Aug Country: Switzerland Source: Bureau of Labor Statistics, U.S. Department of Labor. Raw Data Available At: http://stats.bls.gov/news.release/empsit.toc.htm Release Time: First Friday of the month at 8:30 ET for the prior month. 08/09/2009 06:00 International Trade Balance mm 12.4b 11.4b 11.0b Jul Country: Germany Source: The Census Bureau and the Bureau of Economic Analysis of the Department of Commerce. Raw Data Available At: http://www.census.gov/foreign-trade/www/press.html Release Time: 8:30 ET around the 20th of the month (data for two months prior). 08/09/2009 08:30 Industrial Production mm 0.5% 0.2% 0.5% Jul Country: UK Source: Federal Reserve. Raw Data Available At: http://www.federalreserve.gov/releases/G17/Current/g17.txt Release Time: 9:15 ET around the 15th of the month (data for month prior). 08/09/2009 08:30 Industrial Production yy -9.3% -10.1% -11.1% Jul Country: UK Source: Federal Reserve. Raw Data Available At: http://www.federalreserve.gov/releases/G17/Current/g17.txt Release Time: 9:15 ET around the 15th of the month (data for month prior). 08/09/2009 08:30 Industrial Production mm 0.9% 0.3% 0.4% Jul Country: UK Source: Federal Reserve. Raw Data Available At: http://www.federalreserve.gov/releases/G17/Current/g17.txt Release Time: 9:15 ET around the 15th of the month (data for month prior). 08/09/2009 10:00 Industrial Production mm -0.9% 1.5% -0.1% Jul Country: Germany Source: Federal Reserve. Raw Data Available At: http://www.federalreserve.gov/releases/G17/Current/g17.txt Release Time: 9:15 ET around the 15th of the month (data for month prior). 08/09/2009 12:30 Building Permits -11.4% 0.4% 1.0% Jul Country: Canada Source: The Census Bureau of the Department of Commerce. Raw Data Available At: http://www.census.gov/const/www/newresconstindex.html Release Time: 8:30 ET around the 16th of the month (data for one month prior). 08/09/2009 19:00 Consumer Credit mm -4.5b -10.3b Jul Country: US Source: Federal Reserve. Raw Data Available At: http://www.census.gov/const/www/c30index.html Release Time: 15:00 ET on the fifth business day of the month (data for two months prior). 08/09/2009 23:00 Consumer Confidence 60.0 Aug Country: UK Source: The Conference Board. Raw Data Available At: http://www.tcb-indicators.org/ Release Time: 10:00 ET on the last Tuesday of the month (data for current month). 09/09/2009 01:00 Consumer Confidence 3.7% Sep Country: Australia Source: The Conference Board. Raw Data Available At: http://www.tcb-indicators.org/ Release Time: 10:00 ET on the last Tuesday of the month (data for current month). 09/09/2009 01:30 Retail Sales mm 0.5% -1.4% Jul Country: Australia Source: The Census Bureau of the Department of Commerce. Raw Data Available At: http://www.census.gov/svsd/www/advtable.html Release Time: 8:30 ET around the 13th of the month (data for one month prior). 09/09/2009 05:00 Leading Economic Indicators 2.9 Jul Country: Japan Source: The Conference Board. Raw Data Available At: http://www.tcb-indicators.org/ Release Time: 8:30 ET around the third week of the month for the month prior. 09/09/2009 06:00 Consumer Price Index (CPI) mm 0.2% 0.0% Aug Country: Germany Source: Bureau of Labor statistics, U.S. Department of Labor. Raw Data Available At: http://stats.bls.gov/news.release/cpi.toc.htm Release Time: 8:30 ET, about the 13th of each month for the prior month. 09/09/2009 06:00 Consumer Price Index (CPI) yy 0.0% -0.5% Aug Country: Germany Source: Bureau of Labor statistics, U.S. Department of Labor. Raw Data Available At: http://stats.bls.gov/news.release/cpi.toc.htm Release Time: 8:30 ET, about the 13th of each month for the prior month. 09/09/2009 06:00 HICP mm 0.4% -0.1% Aug Country: Germany Source: EU Eurostat. Raw Data Available At: ttp://europa.eu.int/comm/eurostat/ 09/09/2009 06:00 HICP yy 0.0% -0.7% Aug Country: Germany Source: EU Eurostat. Raw Data Available At: ttp://europa.eu.int/comm/eurostat/ 09/09/2009 08:30 International Trade Balance mm -6.28b -6.451b Jul Country: UK Source: The Census Bureau and the Bureau of Economic Analysis of the Department of Commerce. Raw Data Available At: http://www.census.gov/foreign-trade/www/press.html Release Time: 8:30 ET around the 20th of the month (data for two months prior). 09/09/2009 12:15 Housing Starts yy 132.1k Aug Country: Canada Source: The Census Bureau of the Department of Commerce. Raw Data Available At: http://www.census.gov/const/www/newresconstindex.html Release Time: 8:30 ET around the 16th of the month (data for one month prior). 09/09/2009 21:00 Interest Rate Decision 2.5% 2.5% Sep Country: NewZealand Source (U.S.): The Federal Reserve Open Market Committee - FOMC. Source (World): The Central Bank Monetary Policy Committee - MPC. 09/09/2009 23:50 Machinery Orders mm 9.7% Jul Country: Japan 10/09/2009 01:30 Non-Farm Payroll -12500 32200 Aug Country: Australia Source: Bureau of Labor Statistics, U.S. Department of Labor. Raw Data Available At: http://stats.bls.gov/news.release/empsit.toc.htm Release Time: First Friday of the month at 8:30 ET for the prior month. 10/09/2009 01:30 Unemployment Rate 5.9% 5.8% Aug Country: Australia Source: Bureau of Labor Statistics, U.S. Department of Labor. Raw Data Available At: http://stats.bls.gov/news.release/empsit.toc.htm Release Time: First Friday of the month at 8:30 ET for the prior month. 10/09/2009 11:00 Interest Rate Decision 0.5% 0.5% Sep Country: UK Source (U.S.): The Federal Reserve Open Market Committee - FOMC. Source (World): The Central Bank Monetary Policy Committee - MPC. 10/09/2009 12:30 International Trade Balance mm -27.5b -27.01b Jul Country: US Source: The Census Bureau and the Bureau of Economic Analysis of the Department of Commerce. Raw Data Available At: http://www.census.gov/foreign-trade/www/press.html Release Time: 8:30 ET around the 20th of the month (data for two months prior). 10/09/2009 12:30 Initial Jobless Claims 570.0k L/W Country: US Source: The Employment and Training Administration of the Department of Labor. Raw Data Available At: http://www.dol.gov/opa/media/press/eta/main.htm Release Time: 8:30 ET each Thursday (data for week ended prior Saturday). 10/09/2009 12:30 International Trade Balance mm -0.06b Jul Country: Canada Source: The Census Bureau and the Bureau of Economic Analysis of the Department of Commerce. Raw Data Available At: http://www.census.gov/foreign-trade/www/press.html Release Time: 8:30 ET around the 20th of the month (data for two months prior). 10/09/2009 13:00 Interest Rate Decision 0.25% Sep Country: Canada Source (U.S.): The Federal Reserve Open Market Committee - FOMC. Source (World): The Central Bank Monetary Policy Committee - MPC. 10/09/2009 23:50 Gross Domestic Product (GDP) qq 0.9% Q2 Country: Japan Source: Bureau of Economic Analysis, U.S. Department of Commerce. Raw Data Available At: http://www.bea.doc.gov/bea/dn1.htm Release Time: Third or fourth week of the month at 8:30 ET for the prior quarter, with subsequent revisions released in the second and third months of the quarter. 11/09/2009 05:00 Consumer Confidence 39.4 Aug Country: Japan Source: The Conference Board. Raw Data Available At: http://www.tcb-indicators.org/ Release Time: 10:00 ET on the last Tuesday of the month (data for current month). 11/09/2009 06:00 Wholesale Price Index (WPI) mm -0.5% Aug Country: Germany 11/09/2009 06:00 Wholesale Price Index (WPI) yy -10.6% Aug Country: Germany 11/09/2009 08:30 Core PPI mm 0.5% Aug Country: UK Source: Bureau of Labor statistics, U.S. Department of Labor. Raw Data Available At: http://stats.bls.gov/news.release/ppi.toc.htm Release Time: Around the 11th of each month at 8:30 ET for the prior month. 11/09/2009 08:30 Core PPI yy 0.2% Aug Country: UK Source: Bureau of Labor statistics, U.S. Department of Labor. Raw Data Available At: http://stats.bls.gov/news.release/ppi.toc.htm Release Time: Around the 11th of each month at 8:30 ET for the prior month. 11/09/2009 12:30 Export Prices 0.0% -0.3% Aug Country: US 11/09/2009 12:30 Import Prices 0.9% -0.7% Aug Country: US 11/09/2009 12:30 House Prices -0.2% Jul Country: Canada 11/09/2009 13:10 Producer Price Index (PPI) mm -1.4% Aug Country: UK Source: Bureau of Labor statistics, U.S. Department of Labor. Raw Data Available At: http://stats.bls.gov/news.release/ppi.toc.htm Release Time: Around the 11th of each month at 8:30 ET for the prior month. 11/09/2009 13:55 U.Michigan Consumer Sentiment 65.3 65.7 Sep Country: US Source: The University of Michigan. Release Time: Preliminary: 10:00 ET on the second Friday of the month (data for current month); Final: 10:00 ET on the fourth Friday of the month (data for current month). 11/09/2009 14:00 Wholsale Inventories -1.0% -1.7% Jul Country: US 11/09/2009 14:00 Wholesale Trade 0.6% 0.4% Jul Country: US Source: The Census Bureau of the Department of Commerce. 11/09/2009 18:00 Budget -161.5b -111.91b Aug Country: US Source: U.S. Treasury Department. Raw Data Available At: http://www.fms.treas.gov/mts/index.html Release Time: 14:00 ET, about the third week of the month for the prior month. Results for the week of: 28/08/2009 - 4/09/2009 28 August 2009 - 4 September 2009 Date Time * Source Description Forecast Previous 8/28/2009 03:00 NZ Money Supply M3 YoY n/a 2.7% 8/28/2009 08:30 UK GDP QoQ -0.8% -0.8% 8/28/2009 09:00 EU Business Climate Indicator -2.50 -2.71 8/28/2009 12:30 CA Current Account (BOP) -$11.3B -$9.1B 8/28/2009 12:30 US Personal Income 0.1% -1.3% 8/28/2009 14:00 US U. of Michigan Confidence 64.0 63.2 8/30/2009 23:01 UK Hometrack Housing Survey (YoY) n/a -7.7% 8/30/2009 23:50 JPN Retail Trade YoY n/a -2.9% 8/31/2009 00:30 AUS TD Securities Inflation YoY% n/a 1.9% 8/31/2009 01:00 AUS HIA New Home Sales (MoM) n/a 0.5% 8/31/2009 01:30 AUS Private Sector Credit YoY% n/a 3.4% 8/31/2009 01:30 JPN Labor Cash Earnings YoY n/a -7.0% 8/31/2009 03:00 NZ NBNZ Business Confidence n/a 18.7 8/31/2009 04:00 JPN Vehicle Production (YoY) n/a -34.0% 8/31/2009 05:00 JPN Housing Starts (YoY) n/a -32.4% 8/31/2009 09:00 EU Euro-Zone CPI Estimate (YoY) n/a -0.6% 8/31/2009 12:30 CA GDP MoM n/a -0.5% 8/31/2009 13:45 US Chicago Purchasing Manager 47.3 43.4 8/31/2009 14:00 US NAPM-Milwaukee n/a 45.0 8/31/2009 14:30 US Dallas Fed Manf. Activity n/a -25.5% 8/31/2009 20:15 US Bloomberg FCI Monthly n/a n/a 8/31/2009 23:30 AUS AiG Performance of Mfg Index n/a 44.5 9/1/2009 01:30 AUS Current Account Balance n/a n/a 9/1/2009 04:30 AUS RBA CASH TARGET 3.00% 3.00% 9/1/2009 05:00 JPN Vehicle Sales (YoY) n/a -4.2% 9/1/2009 07:55 GE Unemployment Change (000's) n/a -6K 9/1/2009 08:00 EU PMI Manufacturing n/a 47.9 9/1/2009 08:30 UK M4 Money Supply (YoY) n/a 13.6% 9/1/2009 09:00 EU Euro-Zone Unemployment Rate n/a 9.4% 9/1/2009 14:00 US ISM Prices Paid 58.0 55.0 9/1/2009 21:00 US ABC Consumer Confidence n/a n/a 9/1/2009 23:50 JPN Monetary Base (YoY) n/a 6.1% 9/2/2009 01:30 AUS GDP (YoY) n/a 0.4% 9/2/2009 08:30 UK PMI Construction n/a 47.0 9/2/2009 09:00 EU Euro-Zone GDP s.a. (YoY) n/a -4.6% 9/2/2009 11:30 US Challenger Job Cuts YoY n/a -5.7% 9/2/2009 12:15 US ADP Employment Change -250k -371k 9/2/2009 12:30 US Nonfarm Productivity 6.1% 6.4% 9/2/2009 14:00 US Factory Orders 1.3% 0.4% 9/2/2009 18:00 US Minutes of Aug. 12 FOMC Meeting n/a n/a 9/2/2009 23:30 AUS AiG Performance of Service Index n/a 44.1 9/3/2009 01:30 AUS Trade Balance n/a -441M 9/3/2009 03:00 NZ ANZ Commodity Price n/a 1.0% 9/3/2009 07:55 GE PMI Services n/a 54.1 9/3/2009 08:00 EU PMI Services n/a 49.5 9/3/2009 08:30 UK PMI Services n/a 53.2 9/3/2009 09:00 EU Euro-Zone Retail Sales (YoY) n/a -2.4% 9/3/2009 11:45 EU ECB Announces Interest Rates n/a 1.00% 9/3/2009 12:30 US Initial Jobless Claims n/a n/a 9/3/2009 12:30 US Continuing Claims n/a n/a 9/3/2009 14:00 US ISM Non-Manf. Composite 48.0 46.4 9/3/2009 15:00 US ICSC Chain Store Sales YoY n/a -5.0% 9/3/2009 23:50 JPN Capital Spending n/a -25.3% 9/4/2009 09:45 EU European Commission Releases Economic Forecasts n/a n/a 9/4/2009 11:00 CA Net Change in Employment -20.0K -44.5K 9/4/2009 12:30 US Change in Nonfarm Payrolls -231K -247K 9/4/2009 14:00 CA Ivey Purchasing Managers Index 54.0 51.8 Results for the week of: 24/08/09 - 28/08/09 24 August 2009 - 28 August 2009 * Timezone GMT (Greenwich Mean Time) Date Time Importance Event Actual Forecast Previous Period 24/08/09 09:00 Factory Orders mm 1.6% -0.2% Jun Country: EMU Source: The Census Bureau of the Department of Commerce. Raw Data Available At: http://www.census.gov/ftp/pub/indicator/www/m3/index.htm Release Time: 10:00 ET around the first business day of the month (data for two months prior). Factory orders consist of the earlier announced durable goods report plus non- durable goods orders. The report is very predictable with nondurables the only new component. Nondurables consist of such items as food and tobacco products which grow at a fairly consistent monthly rate, so that market forecasts for this report are far more accurate than for the durable orders report. In addition to seeing nondurables for the first time, the market also watches for revisions to the durable orders data, which can be significant. At present, durable goods orders sum to about 54% of total orders. The final piece of new information in this report is factory inventories -- the first glimpse at the inventory picture each month (wholesales inventories are typically released a week later, with retail inventories released a few days after wholesale inventories). Though the inventory figure is not a market-mover, economists use this number to help forecast inventories in the quarterly GDP report. 24/08/09 09:00 Factory Orders yy -28.6% -30.1% Jun Country: EMU Source: The Census Bureau of the Department of Commerce. Raw Data Available At: http://www.census.gov/ftp/pub/indicator/www/m3/index.htm Release Time: 10:00 ET around the first business day of the month (data for two months prior). Factory orders consist of the earlier announced durable goods report plus non- durable goods orders. The report is very predictable with nondurables the only new component. Nondurables consist of such items as food and tobacco products which grow at a fairly consistent monthly rate, so that market forecasts for this report are far more accurate than for the durable orders report. In addition to seeing nondurables for the first time, the market also watches for revisions to the durable orders data, which can be significant. At present, durable goods orders sum to about 54% of total orders. The final piece of new information in this report is factory inventories -- the first glimpse at the inventory picture each month (wholesales inventories are typically released a week later, with retail inventories released a few days after wholesale inventories). Though the inventory figure is not a market-mover, economists use this number to help forecast inventories in the quarterly GDP report. 24/08/09 12:30 Core Retail Sales mm 0.7% Jun Country: Canada Source: The Census Bureau of the Department of Commerce. Raw Data Available At: http://www.census.gov/svsd/www/advtable.html Release Time: 8:30 ET around the 13th of the month (data for one month prior). The retail sales report is a measure of the total receipts of retail stores. The changes in retail sales are widely followed as the most timely indicator of broad consumer spending patterns. Retail sales are often viewed ex-autos, as auto sales can move sharply from month-to-month. It is also important to keep an eye on the gas and food components, where changes in sales are often a result of price changes rather than shifting consumer demand. 24/08/09 12:30 Retail Sales mm 1.2% Jun Country: Canada Source: The Census Bureau of the Department of Commerce. Raw Data Available At: http://www.census.gov/svsd/www/advtable.html Release Time: 8:30 ET around the 13th of the month (data for one month prior). The retail sales report is a measure of the total receipts of retail stores. The changes in retail sales are widely followed as the most timely indicator of broad consumer spending patterns. Retail sales are often viewed ex-autos, as auto sales can move sharply from month-to-month. It is also important to keep an eye on the gas and food components, where changes in sales are often a result of price changes rather than shifting consumer demand. Retail sales can be quite volatile and the advance reports are subject to rather large revisions. Retail sales do not include spending on services, which makes up over half of total consumption. Total personal consumption is not available until the personal income and consumption reports are released, typically two weeks after retail sales. 24/08/09 16:00 Mid-West Mnfg Activity 78.1 Jul Country: US 25/08/09 06:00 Gross Domestic Product (GDP) qq -3.5% Q2 Country: Germany Source: Bureau of Economic Analysis, U.S. Department of Commerce. Raw Data Available At: http://www.bea.doc.gov/bea/dn1.htm Release Time: Third or fourth week of the month at 8:30 ET for the prior quarter, with subsequent revisions released in the second and third months of the quarter. Gross Domestic Product (GDP) is the broadest measure of economic activity. Annualized quarterly percent changes in GDP reflect the growth rate of total economic output. The figures can be quite volatile from quarter to quarter. Inventory and net export swings in particular can produce significant volatility in GDP. The final sales figure, which excludes inventories, can sometimes be helpful in identifying underlying growth trends as inventories represent unsold goods, and a large inventory increase will boost GDP but might be indicative of weakness rather than strength. The broad components of GDP are: consumption, investment, net exports, government purchases, and inventories. Consumption is by far the largest component, totalling roughly 2/3rds of GDP. In addition to the GDP figures, there are GDP deflators, which measure the change in prices in total GDP and for each component. Though the consumer price index is a more closely watched inflation indicator, the GDP deflator is another key inflation measure. Unlike CPI, it has the advantage of not being a fixed basket of goods and services, so that changes in consumption patterns or the introduction of new goods and services will be reflected in the deflator. With both GDP and the deflator, the market tends to focus on the quarter/quarter change. Year/year changes are also cited frequently, though they do not provide the most timely indications of economic activity or inflation. The bond market often reacts to GDP, though the price moves are typically small, as much of the GDP data is easily predicted using monthly economic releases such as personal consumption, durable goods shipments, construction spending, international trade, and inventories. Quarterly GDP reports are broken down into three announcements: advance, preliminary, and final. After the final revision, GDP is not revised again until the annual benchmark revisions each July. These revisions can be quite large and usually affect the past five years of data. 25/08/09 06:00 Gross Domestic Product (GDP) yy -6.4% Q2 Country: Germany Source: Bureau of Economic Analysis, U.S. Department of Commerce. Raw Data Available At: http://www.bea.doc.gov/bea/dn1.htm Release Time: Third or fourth week of the month at 8:30 ET for the prior quarter, with subsequent revisions released in the second and third months of the quarter. Gross Domestic Product (GDP) is the broadest measure of economic activity. Annualized quarterly percent changes in GDP reflect the growth rate of total economic output. The figures can be quite volatile from quarter to quarter. Inventory and net export swings in particular can produce significant volatility in GDP. The final sales figure, which excludes inventories, can sometimes be helpful in identifying underlying growth trends as inventories represent unsold goods, and a large inventory increase will boost GDP but might be indicative of weakness rather than strength. The broad components of GDP are: consumption, investment, net exports, government purchases, and inventories. Consumption is by far the largest component, totalling roughly 2/3rds of GDP. In addition to the GDP figures, there are GDP deflators, which measure the change in prices in total GDP and for each component. Though the consumer price index is a more closely watched inflation indicator, the GDP deflator is another key inflation measure. Unlike CPI, it has the advantage of not being a fixed basket of goods and services, so that changes in consumption patterns or the introduction of new goods and services will be reflected in the deflator. With both GDP and the deflator, the market tends to focus on the quarter/quarter change. Year/year changes are also cited frequently, though they do not provide the most timely indications of economic activity or inflation. The bond market often reacts to GDP, though the price moves are typically small, as much of the GDP data is easily predicted using monthly economic releases such as personal consumption, durable goods shipments, construction spending, international trade, and inventories. Quarterly GDP reports are broken down into three announcements: advance, preliminary, and final. After the final revision, GDP is not revised again until the annual benchmark revisions each July. These revisions can be quite large and usually affect the past five years of data. 25/08/09 07:15 Non-Farm Payroll 3.957m Q2 Country: Switzerland Source: Bureau of Labor Statistics, U.S. Department of Labor. Raw Data Available At: http://stats.bls.gov/news.release/empsit.toc.htm Release Time: First Friday of the month at 8:30 ET for the prior month. In Brief The employment report is actually two separate reports which are the results of two separate surveys. The household survey is a survey of roughly 60,000 households. This survey produces the unemployment rate. The establishment survey is a survey of 375,000 businesses. This survey produces the nonfarm payrolls, average workweek, and average hourly earnings figures, to name a few. Both surveys cover the payroll period which includes the 12th of each month. The reports both measure employment levels, just from different angles. Due to the vastly different size of the survey samples (the establishment survey not only surveys more businesses, but each business employs many individuals), the measures of employment may differ markedly from month to month. The household survey is used only for the unemployment measure - the market focusses primarily on the more comprehensive establishment survey. Together, these two surveys make up the employment report, the most timely and broad indicator of economic activity released each month. Total payrolls are broken down into sectors such as manufacturing, mining, construction, services, and government. The markets follows these components closely as indicators of the trends in sectors of the economy; the manufacturing sector is watched the most closely as it often leads the business cycle. The data also include breakdowns of hours worked, overtime, and average hourly earnings. The average workweek (also known as hours worked) is important for two reasons. First, it is a critical determinant of such monthly indicators as industrial production and personal income. Second, it is considered a useful indicator of labor market conditions: a rising workweek early in the business cycle may be the first indication that employers are preparing to boost their payrolls, while late in the cycle a rising workweek may indicate that employers are having difficulty finding qualified applicants for open positions. Average earnings are closely followed as an indicator of potential inflation. Like the price of any good or service, the price of labor reacts to an overly accommodative monetary policy. If the price of labor is rising sharply, it may be an indication that too much money is chasing too few goods, or in this case employees. In Depth The employment report is really two reports - the household survey and the establishment survey. These two surveys contain a wealth of timely information which justify this report's status as the most important economic release of the month. This same wealth of information can nevertheless turn into a dearth of knowledge if it is not placed in the proper context. Household and Establishment Surveys The household and establishment surveys differ due to the source of the data, as the names suggest. The household survey is a survey of households and the establishment survey is a surveys of businesses. The establishment survey, which is sometimes referred to as the payrolls survey, is favored by the market for a simple reason - it is far more comprehensive. Both surveys attempt to measure employment conditions at the roughly the same point in time - the household survey covers the calendar week which includes the 12th of the month while the establishment survey covers the pay period (be it a week, two weeks, or longer) which includes the 12th. But the establishment survey covers 390,000 businesses which employ 47 million people, while the household survey covers just 50,000 individuals. With a sample size which is 940 times larger than the household survey, it is hardly surprising that the market is more interested in the establishment survey. Aside from the sample size, the surveys differ in other significant ways. The household survey counts farm workers, the self-employed, unpaid family workers, and private household workers as employed; the establishment survey does not. The household survey can only count one individual as employed once, even if that person holds two jobs. The establishment survey will double count an individual who appears on the payrolls of two companies. There are other, less significant differences, but let's turn now to the statistics produced by the two surveys. The Establishment Survey Nonfarm Payrolls Without question, the single most important piece of data contained in the employment report generally and the establishment survey specifically is nonfarm payrolls. As the name implies, nonfarm payrolls measure the number of people on the payrolls of all non-agricultural businesses. The monthly changes in payrolls can be quite volatile, occasionally varying by better than 200K from one month to the next. Even with this volatility and the possibility of large revisions to past data, the payrolls figures offer the most timely and comprehensive snapshot of the economy. Average Workweek The workweek, also referred to as hours worked, is an often underrated indicator in the establishment survey. The average number of hours worked by employees on nonfarm payrolls is an important determinant of both industrial production and personal income in any given month. The workweek typically sees changes of a tenth or two each month, but can see much larger swings, such as the four tenth decline reported for October. To understand the importance of these changes in the workweek, note that a one tenth decline in the average workweek of 120 mln workers (roughly the current level of employment) results in 12 mln fewer hours worked. To create a similar decline in manhours through a change in employment, payrolls would have to fall 340K. For the purposes of production and income calculations, a one tenth of an hour change in the workweek is equivalent to a 340K change in employment. Needless to say, the workweek data are therefore critical in judging the overall strength or weakness of the employment report. Aggregate Hours Worked The aggregate hours worked index simply brings together the two series we just noted. By calculating an index which looks at both employment and the workweek, we get a complete picture of the total hours worked each month. This indicator is seen as a monthly proxy for GDP. By definition, the quarterly change in the amount of goods produced is equal to the change in manhours plus the change in productivity. As productivity is somewhat predictable from quarter to quarter, the aggregate hours worked index provides a helpful monthly read on the overall economy. Average Hourly Earnings The last indicator from the establishment survey which is worthy of close inspection is average hourly earnings, which is important for two reasons. Alongside total manhours, the average earnings figure gives us a good indication of personal income growth during the month. Second, the earnings figures are closely watched during periods of strong economic growth for evidence of increasing wage pressures. Such has certainly been the case over the past year, as the market's reaction to the employment data has often turned on the change in hourly earnings and its implications for the inflation outlook. 25/08/09 13:00 House Prices 0.2% 0.5% Jun Country: US 25/08/09 14:00 Consumer Confidence 48.0 46.6 Aug Country: US Source: The Conference Board. Raw Data Available At: http://www.tcb-indicators.org/ Release Time: 10:00 ET on the last Tuesday of the month (data for current month). This survey measures the level of confidence individual households have in the performance of the economy now and in the future. It is a leading indicator of future spending and the business cycle. 5000 consumers in the nine census divisions across the country are surveyed each month. The level of consumer confidence is directly correlated to the strength of consumer spending, which accounts for two-thirds of the economy. It also correlates closely with joblessness, inflation, and real incomes. The report can occasionally be helpful in predicting sudden shifts in consumption patterns, though most small changes in the index are just noise. Only index changes of at least five points should be considered significant. The index consists of two subindexes - consumers' appraisal of current conditions and their expectations for the future. Expectations make up 60% of the total index, with current conditions accounting for the other 40%. The expectations index is typically seen as having better leading indicator qualities than the current conditions index. The more confident consumers are about the economy and their own personal finances, the more likely they are to spend. Note, changes in consumer confidence and retail sales do not move in tandem month by month. If the economy experiences a long-term expansion, buying intentions may decline even while the jobless rate declines because of the satisfaction of pent-up demand. Conversely, if inflation begins to accelerate, spending plans may increase for the short-term as consumers buy now to avoid having to pay higher prices later. Regional differences in consumer confidence are an indication of differing business cycles across the nation. This has implications for spending on durable goods and, more importantly, for residential real estate markets. Financial markets interpret rising consumer confidence as a precursor to higher consumer spending. Higher consumer spending could in turn spark inflation. Look for a change in the direction of the six month moving average of the index. Consumers do not usually have the necessary information to accurately assess income and job growth six months in the future. The report provides information on planned spending, which does not necessarily turn into actual spending, although it is unlikely that increasing consumer confidence would be followed by a decline in spending. The Consumer Confidence survey is not useful for any type of forecasting. 25/08/09 14:00 House Prices -5.6% Jun Country: US 25/08/09 14:00 Richmond Fed srvs -16.0 Aug Country: US Source: Chicago Purchasing Managers Association. Raw Data Available At: http://www.phil.frb.org/ Release Time: Last business day of the month at 10 ET for the current month. In Brief There are many regional manufacturing surveys, and they tend to be ranked in order of timeliness and the importance of the region. The Philadelphia Fed's survey is first each month, actually coming out during the third week of the month for which it is reporting. Several smaller surveys are then released before the Chicago purchasing managers' report on the last day of each month. A few, such as the Atlanta and Richmond Fed surveys, are released after the NAPM and are of little value. The purchasing managers' reports are measured like the national NAPM - 50% marks the breakeven line between an expanding and contracting manufacturing sector. For the Philadelphia and Atlanta Fed indexes, 0 is the breakeven mark. These surveys can be of some help in forecasting the national NAPM - particularly the Philadelphia and Chicago surveys which are more closely watched due to their timeliness and the fact that these regions represent a reasonable cross section of national manufacturing activities. In Depth The market has been bombarded with a bevy of surveys purporting to measure manufacturing activity in every nook and cranny of the country. First it was Philadelphia, then Chicago, and Detroit, Milwaukee, New York, Cincinnati, Richmond, Atlanta, Boston, and there might as well have been a Nome survey. This hodge-podge of releases is begging for someone - namely us - to come along and cut this group down to a more manageable size. Nuts and Bolts Let's start with the issue of what these manufacturing surveys are trying to measure and how they go about doing it. The leader of this pack of regional surveys is the ISM index which comes from the Institute for Supply Management (formerly the National Association of Purchasing Managers). It has been around since 1931 (1948 on an uninterrupted basis), it is national, and it is one of the most timely measures of manufacturing activity available. In other words, it sets the standards by which its progeny are measured. The ISM index is actually a composite of five sub-indexes - new orders, production, supplier deliveries, inventories, and employment. In surveying over 300 companies each month, the ISM asks for positive, negative, or unchanged readings on each of these indicators. The positive responses are added to one half of the unchanged responses to produce the diffusion index. For example, if 50% of respondents reported stronger orders, 40% reported weaker, and 10% unchanged, the diffusion index for orders would be 55%, the 50% positive plus half of the 10% unchanged. To calculate the total index, the ISM uses weights for the five indicators, which are as follows: 30% new orders, 25% production, 20% employment, 15% supplier deliveries, and 10% inventories. The Selection Criteria Since this methodology has made the ISM index one of the better leading indicators of economic activity over the years, we will measure the usefulness of the regional indexes based on their ability to help in forecasting the national index. In our effort to arrive at the most important regional indices, these criteria make eliminating most of the candidates easy for one simple reason - they are released after the national index. While regional economic developments are of interest to those who live in the region, they are not particularly important to the markets. If a region cannot help in forecasting national trends, then its data are not particularly useful. So say adios to Atlanta, Richmond, Kansas City, and who knows how many others which have cropped up in recent years. And the Winner Is... Let's focus on the regional surveys which precede the release of the national index on the first business day of each month (with data for the prior month). The contestants are Philadelphia, Chicago, Milwaukee, Detroit, New York, and the most recent addition to the bunch - the APICS survey. We looked at the correlation of all of these indexes to the national NAPM and found substantial differences in their forecasting ability. The winners are...drum roll please...Chicago and Philadelphia, in that order. The Chicago PMI (officially known as the Business Barometer) is a monthly composite index based on opinion surveys of more than 200 Chicago purchasing managers regarding the manufacturing industry. The survey responses are limited to three options: slower, faster and same. As such, the index will not capture if a component is growing but at a much slower rate or vice versa. The index is a composite of seven similarly constructed indexes including: new orders, production, supplier delivery times, backlogs, inventories, prices paid, and employment. New orders and orders backlog indices indicate future production activity. It signals factory-sector expansion when it is above 50 and contraction when below it. The index is seasonally adjusted for the effects of variations within the year, differences due to holidays and institutional changes. Because it is an opinion survey, it is often influenced by respondents' perception of current events, as opposed to actual hard data. Also, it does not capture technological and production changes, which make it possible for production to expand, while employment contracts. Because the Chicago PMI is released the day before the ISM, it is watched in order to predict the more important ISM report (the Chicago PMI has an impressive 91% correlation with the ISM national NAPM), which is in itself a good leading indicator of overall economic activity. It frequently moves markets. The Philadelphia Fed index, which is released on the third Thursday of the month (with data for the same month), was a distant second at 76%. Philly Fed's performance improved slightly to 78% when Briefing measured its results using the NAPM methodology. The Philly index as released is not a composite of its subindexes, as the NAPM is. Instead, the Philly Fed survey asks many questions, but the total index is based on the general question "are business conditions better or worse than last month." It is often the case that a weighted measure of the individual questions on specifics such as new orders and production moves in a different direction than the index based on the general question. The rest of the regional indexes fared poorly, ranging from correlations as poor as 55% (APICS) to 73% (Milwaukee). Chicago was the clear winner, but the Philly Fed index definitely deserves recognition, particularly since it is released so much earlier than the rest. In the future, then, we would recommend setting aside most of the regional manufacturing surveys and focussing on just Philly and Chicago, which offer the best hope of predicting the national index. And when you look at the Philly index, improve your chances by looking at the Philly numbers calculated on an NAPM basis, which Briefing will be happy to provide. 25/08/09 23:50 International Trade Balance mm 385.0b 508.0b Jul Country: Japan Source: The Census Bureau and the Bureau of Economic Analysis of the Department of Commerce. Raw Data Available At: http://www.census.gov/foreign-trade/www/press.html Release Time: 8:30 ET around the 20th of the month (data for two months prior). The trade report is most widely watched for trends in the overall trade balance. But trends in both exports and imports of goods and services bear watching as well. The export data in particular are important to watch for indications that a strengthening competitive position at home and/or strengthening economies overseas are boosting U.S. growth. Imports provide an indication of domestic demand, but given the severe lag of this report relative to other consumption indicators, it is not particularly valuable for this purpose. The volatility in the monthly trade balance can play an important role in GDP forecasts. Net exports are a relatively volatile component of GDP, and the trade report provides the only early clues to the net export performance each quarter. 26/08/09 06:00 Import Prices -0.7% 0.4% Jul Country: Germany 26/08/09 08:00 IFO Business Climate: index 88.5 87.3 Aug Country: Germany Source: Ifo Institute for Economic Research. Raw Data Available At: http://www.ifo.de/~cesifo/ifoinstitute.htm Release Time: 10:00 Germany-time around the 26th of the month (data for month prior). The Ifo Institute for Economic Research, is one of the largest economic research institutes in Germany. The Ifo Institute is a service-based research organisation with a three-fold orientation: to conduct economic research, to offer advice to economic policy-makers and to provide services for the research and business communities. The Ifo Institute is internationally renowned for its business surveys. Every month more than 7,000 enterprises are questioned on their appraisals of the business situation and their short-term planning. The confidence indicator frequently referred to as the Ifo Index is derived from the responses to the Ifo Business Survey. 26/08/09 12:30 New orders XD 0.5% -0.5% Jul Country: US Source: The Census Bureau of the Department of Commerce. Raw Data Available At: http://www.census.gov/ftp/pub/indicator/www/m3/index.htm Release Time: 8:30 ET around the 26th of the month (data for month prior). The durable orders release measures the dollar volume of orders, shipments, and unfilled orders of durable goods (defined as goods whose intended lifespan is three years or more). Orders are considered a leading indicator of manufacturing activity, and the market often moves on this report despite the volatility and large revisions that make it a less than perfect indicator. These problems can be minimized by looking at the breakdown of orders. The total number is often skewed by huge increases in aircraft and defense orders. An increase based solely on strength in one sector tends to be discounted, while the market is more impressed with broadbased increases in orders. Also notable in this report is the narrow category of nondefense capital goods. These goods mirror the GDP category producers' durable equipment (PDE) -- the largest component of business investment. Shipments of nondefense capital goods are a good proxy for PDE in the current quarter, while nondefense capital goods orders provide an indication of PDE growth in the quarters ahead. 26/08/09 12:30 Durable Goods Orders 1.7% -2.2% Jul Country: US Source: The Census Bureau of the Department of Commerce. Raw Data Available At: http://www.census.gov/ftp/pub/indicator/www/m3/index.htm Release Time: 8:30 ET around the 26th of the month (data for month prior). The durable orders release measures the dollar volume of orders, shipments, and unfilled orders of durable goods (defined as goods whose intended lifespan is three years or more). Orders are considered a leading indicator of manufacturing activity, and the market often moves on this report despite the volatility and large revisions that make it a less than perfect indicator. These problems can be minimized by looking at the breakdown of orders. The total number is often skewed by huge increases in aircraft and defense orders. An increase based solely on strength in one sector tends to be discounted, while the market is more impressed with broadbased increases in orders. Also notable in this report is the narrow category of nondefense capital goods. These goods mirror the GDP category producers' durable equipment (PDE) -- the largest component of business investment. Shipments of nondefense capital goods are a good proxy for PDE in the current quarter, while nondefense capital goods orders provide an indication of PDE growth in the quarters ahead. 26/08/09 14:00 New Home sales 0.39m 0.384m Jul Country: US Source: The Census Bureau of the Department of Commerce. Raw Data Available At: http://www.census.gov/const/newressales.pdf Release Time: 10:00 ET around the last business day of the month (data for month prior). The report indicates the level of new privately owned one-family houses sold and for sale. New home sales usually have a lagged reaction to changing mortgage rates. They also tend to be stronger early in the business cycle when pent-up demand is strong, and they fade later in the cycle as the demand for housing is sated. In addition to home sales, the market monitors the number of homes for sale relative to the current sales pace. As this inventory measure falls (rises), housing starts tend to rise (fall). Finally, the median home price provides an indication of inflation in the housing sector, though only year/year changes provide any meaningful information. The home sales report is quite volatile and subject to huge revisions, making any one month's reading very unreliable. The report rarely prompts a market reaction. The market prefers the existing home sales report, which has a sample data pool four times as large and is released earlier in the month. 26/08/09 22:45 International Trade Balance mm -417.0m Jul Country: NewZealand Source: The Census Bureau and the Bureau of Economic Analysis of the Department of Commerce. Raw Data Available At: http://www.census.gov/foreign-trade/www/press.html Release Time: 8:30 ET around the 20th of the month (data for two months prior). The trade report is most widely watched for trends in the overall trade balance. But trends in both exports and imports of goods and services bear watching as well. The export data in particular are important to watch for indications that a strengthening competitive position at home and/or strengthening economies overseas are boosting U.S. growth. Imports provide an indication of domestic demand, but given the severe lag of this report relative to other consumption indicators, it is not particularly valuable for this purpose. The volatility in the monthly trade balance can play an important role in GDP forecasts. Net exports are a relatively volatile component of GDP, and the trade report provides the only early clues to the net export performance each quarter. 27/08/09 06:00 GFK Consumer Sentiment 3.7 3.5 Sep Country: Germany 27/08/09 08:00 M3 Money Supply yy 3.3% 3.5% Jul Country: EMU Source: Federal Reserve Board. Raw Data Available At: http://www.bog.frb.fed.us/releases/H6/Current/ Release Time: Every Thursday at 16:30 ET, data for the week ended two Mondays prior. M1: Currency + travelers checks + demand deposits + other checkable deposits (NOW accounts). M2: M1 + savings deposits + small time deposits + retail money market funds. Also, see release details. M3: M2 + large time deposits + institutional money market funds + RPs + Eurodollars. In Brief Money supply figures, and M1 specifically, once were the most important release to watch in the Treasury market, as the Fed directly targetted M1 growth in the early 1980s. The focus on money supply has long since been abandoned, however. To the extent that money supply is still monitored by the market, M2 is the favored monetary aggregate. The Fed still targets both M2 and M3 in a rhetorical sense, but these targets mean little when it comes to policy decisions. If the Fed misses its target, it is more likely to change the target than it is to change policy. In 2000, the Fed finally abandoned the targets altogether, thereby removing any remaining emphasis on this one-time star release. In DepthThough money supply measures were long ago relegated to the bottom of the Fed's list of policy tools, they are still useful in providing clues regarding the strength of the economy. This article offers a refresher on just what the monetary aggregates are - how they are constructed, why they matter, and how much the Fed cares about each. Let's start with the strict definitions. M1, the narrowest of the monetary aggregates, contains the following: 1. Currency, except that held by the Fed, Treasury, or banks/thrifts 2. Travelers checks 3. Demand deposits (non-interest bearing checking accounts), except those due to banks, the government, or foreign institutions 4. Other checkable deposits - most notably NOW (negotiable order of withdrawal) accounts. M2, the aggregate which the Fed watches most closely, contains the following: 1. M1 2. Savings deposits (including money market deposit accounts- MMDAs) 3. Time deposits (known commonly as CDs or certificates of deposit) in denominations of less than $100,000 4. Balances in retail money market funds (retail funds have minimum initial investments of less than $50,000) Finally, M3 - the broadest aggregate - contains: 1. M2 2. Time deposits in denominations of $100,000 or more 3. Balances in institutional money market funds (minimum investments of more than $50,000) 4. Overnight and term repurchase agreements 5. Overnight and term eurodollars held by U.S. residents The Decline of M1 In the early 1980s, M1 was directly targetted by the Federal Reserve, and its weekly release was of critical importance to the financial markets. Today, M1 is barely noticed, and its stock continues to decline. The reason for M1's demise as a useful indicator is financial deregulation, which enabled individuals to hold transaction balances in accounts such as MMDAs which were not included in M1. More recently, M1 has lost what little usefulness it had left as sweep accounts have undermined the narrow aggregate. Sweeps-stakes Sweep accounts are a hybrid checking account/savings account. In a typical sweep account, banks will sweep part of a NOW account's balance into an MMDA. As funds are needed to cover checks written against the NOW account, the bank will periodically shift funds from the MMDA back into the NOW account. Since the legal maximum number of withdrawals from an MMDA is six per month, all funds will be shifted back to the NOW account on the sixth transaction of the month. Sweep accounts benefit both banks and depositors. Banks benefit because MMDAs do not require any reserves to be held with the Fed, while NOW accounts are reservable. As these required reserves are non-interest bearing, banks benefit by reducing their level of required reserves. Depositors benefit because MMDAs carry higher interest rates, and thus earnings on checking balances are increased. As NOW accounts are in M1 and MMDAs are in M2, M1 has been dramatically weakened by sweeps, while M2 has not been affected (since M2 already includes M1, a shift from a NOW account to an MMDA has no impact on M2). The Rise and Fall and Rise of M2 M2 is the most closely watched monetary aggregate - both by economists and the Federal Reserve. The 1978 Humphrey-Hawkins Act mandated that the Fed set annual targets for money supply and that the Fed Chairman report to Congress twice each year regarding these targets. The Fed used to take that responsibility quite seriously - setting point targets for M1 growth, and later setting target ranges for M2 and M3. Finally, in 2000, the Fed abandoned these money targetting altogether. T he reduced emphasis on M2 first became evident in the late 1980s but was sealed in the early 1990s. M2 is a useful indicator only so long as its velocity (the rate of turnover of a dollar of M2, or mathematically, nominal GDP divided by M2) is stable over the long term. Unfortunately, the long term stability of M2 velocity, which was at the core of monetarism, disappeared beginning in the late 1980s. Banks and thrifts, devastated by nonperforming assets, pulled back from their traditional lending business, with market financing sources picking up the slack. The result was a break from the long term trend in M2 velocity. Suddenly, one dollar of M2 could fund far more nominal GDP growth, as market financing increased the efficiency of the financial system. Regardless of the hows and whys - which are still debated by economists - the bottom line was that M2 was no longer a reliable indicator. It will take many years of predictable velocity before the Fed once again places much emphasis on M2 in its policy deliberations. And it is safe to say that neither M2 nor any other monetary aggregate will occupy the top spot in policy making as M1 did in the early 1980s. The record of interest rate targetting has simply been much better than that of money targetting. M3: Still Bringing Up the Rear M3 attracts more attention than it did previously, due largely to the demise of M1, but its inclusion of institutional accounts makes it less attractive than M2, which focusses on individual deposit accounts. The bottom line in determining which aggregate receives the most attention is the relative stability of its velocity. Even though M2 velocity went off course in the early 1990s, it has still been the most predictable of the three during the postwar period. 27/08/09 10:00 CBI Sales -12.0 -15.0 Aug Country: UK Source: The Confederation of British Industry (CBI). Raw Data Available At: http://www.cbi.org.uk/home.html First introduced in 1983, this authoritative indicator of short-term trends in the UK retail and wholesale distribution sector carries significant weight in the formulation of economic policy at the Bank of England and within Government. Quarterly and monthly surveys Aimed at senior executives and sales managers and released on a monthly and quarterly basis, this quarterly survey tracks optimism, employment, prices, investment and stocks. The monthly issue provides a vital update on volume of sales, orders and stocks. A wealth of information This timely guide to retail and wholesale trade is published within seven days of its closing date and covers: 1. Total distribution 2. Retail, wholesale and motor trade activity 3. Employment 4. Type of outlet 5. Twenty-three individual sectors The importance of this survey's data is reflected in its regular supply to the European Commission's harmonised survey of retail trade. 27/08/09 12:30 Core PCE qq 2.0% 2.0% Q2 Country: US Source: The Bureau of Economic Analysis of the Department of Commerce. Raw Data Available At: http://www.bea.doc.gov/bea/rels.htm Release Time: 1 Personal income measures income from all sources. The largest component of total income is wages and salaries, a figure which can be estimated using payrolls and earnings data from the employment report. Beyond that, there are many other categories of income, including rental income, government subsidy payments, interest income, and dividend income. Personal income is a decent indicator of future consumer demand, but it is not perfect. Recessions usually occur when consumers stop spending, which then drives down income growth. Looking solely at income growth, one may therefore miss the turning point when consumers stop spending. The income report also includes a section covering personal consumption expenditures, also known as PCE. PCE is comprised of three categories: durables, nondurables, and services. The retail sales report will provide a good read on durable and nondurable consumption, while service purchases tend to grow at a fairly steady pace, making this a relatively predictable report, and ranking it well below retail sales in terms of market importance. 27/08/09 12:30 Gross Domestic Product (GDP) qq -1.4% -1.0% Q2 Country: US Source: Bureau of Economic Analysis, U.S. Department of Commerce. Raw Data Available At: http://www.bea.doc.gov/bea/dn1.htm Release Time: Third or fourth week of the month at 8:30 ET for the prior quarter, with subsequent revisions released in the second and third months of the quarter. Gross Domestic Product (GDP) is the broadest measure of economic activity. Annualized quarterly percent changes in GDP reflect the growth rate of total economic output. The figures can be quite volatile from quarter to quarter. Inventory and net export swings in particular can produce significant volatility in GDP. The final sales figure, which excludes inventories, can sometimes be helpful in identifying underlying growth trends as inventories represent unsold goods, and a large inventory increase will boost GDP but might be indicative of weakness rather than strength. The broad components of GDP are: consumption, investment, net exports, government purchases, and inventories. Consumption is by far the largest component, totalling roughly 2/3rds of GDP. In addition to the GDP figures, there are GDP deflators, which measure the change in prices in total GDP and for each component. Though the consumer price index is a more closely watched inflation indicator, the GDP deflator is another key inflation measure. Unlike CPI, it has the advantage of not being a fixed basket of goods and services, so that changes in consumption patterns or the introduction of new goods and services will be reflected in the deflator. With both GDP and the deflator, the market tends to focus on the quarter/quarter change. Year/year changes are also cited frequently, though they do not provide the most timely indications of economic activity or inflation. The bond market often reacts to GDP, though the price moves are typically small, as much of the GDP data is easily predicted using monthly economic releases such as personal consumption, durable goods shipments, construction spending, international trade, and inventories. Quarterly GDP reports are broken down into three announcements: advance, preliminary, and final. After the final revision, GDP is not revised again until the annual benchmark revisions each July. These revisions can be quite large and usually affect the past five years of data. 27/08/09 12:30 Initial Jobless Claims 576.0k L/W Country: US Source: The Employment and Training Administration of the Department of Labor. Raw Data Available At: http://www.dol.gov/opa/media/press/eta/main.htm Release Time: 8:30 ET each Thursday (data for week ended prior Saturday). This survey measures the attitudes and expectations concerning both present and future economic conditions of 500 consumers. The Michigan index is almost identical to the Conference Board Consumer Confidence index, though there are two monthly releases, a preliminary and final reading. Like the Conference Board index, it has two subindexes - expectations and current conditions. The expectations index is a component of the Conference Board's Leading Indicators index. 27/08/09 12:30 Personal Consumption Exp. qq 1.3% 1.3% Q2 Country: US Source: The Bureau of Economic Analysis of the Department of Commerce. Raw Data Available At: http://www.bea.doc.gov/bea/rels.htm Release Time: 1 Personal income measures income from all sources. The largest component of total income is wages and salaries, a figure which can be estimated using payrolls and earnings data from the employment report. Beyond that, there are many other categories of income, including rental income, government subsidy payments, interest income, and dividend income. Personal income is a decent indicator of future consumer demand, but it is not perfect. Recessions usually occur when consumers stop spending, which then drives down income growth. Looking solely at income growth, one may therefore miss the turning point when consumers stop spending. The income report also includes a section covering personal consumption expenditures, also known as PCE. PCE is comprised of three categories: durables, nondurables, and services. The retail sales report will provide a good read on durable and nondurable consumption, while service purchases tend to grow at a fairly steady pace, making this a relatively predictable report, and ranking it well below retail sales in terms of market importance. 27/08/09 15:00 KC Fed 2.0 Aug Country: US 27/08/09 22:45 Building Permits -9.5% Jul Country: NewZealand Source: The Census Bureau of the Department of Commerce. Raw Data Available At: http://www.census.gov/const/www/newresconstindex.html Release Time: 8:30 ET around the 16th of the month (data for one month prior). Housing Starts are a measure of the number of residential units on which construction is begun each month. A start in construction is defined as the beginning of excavation of the foundation for the building and is comprised primarily of residential housing. Building permits are permits taken out in order to allow excavation. An increase in building permits and starts usually occurs a few months after a reduction in mortgage rates. Permits lead starts, but permits are not required in all regions of the country, and the level of permits therefore tends to be less than the level of starts over time. The monthly national report is broken down by region: Northeast, Midwest, South, and West. Briefing recommends analyzing the regional data because they are subject to a high degree of volatility. The high volatility can be attributed to weather changes and/or natural disasters. For example, an unexpectedly high level of rain in South could delay housing starts for the region. 27/08/09 23:00 GFK Consumer Sentiment -24.0 -25.0 Aug Country: UK 27/08/09 23:15 Manufacturing PMI 50.4 Aug Country: Japan Source: Institute for Supply Management. Raw Data Available At: http://www.ism.ws/ISMReport/index.cfm Release Time: 10:00 ET on the first business day of the month for the prior month. ISM: Institute for Supply Management formerly NAPM: National Association of Purchasing Managers In Brief The ISM report is a national survey of purchasing managers which covers such indicators as new orders, production, employment, inventories, delivery times, prices, export orders, and import orders. Diffusion indexes are produced for each of these categories, with a reading over 50% indicating expansion relative to the prior month, and a sub-50% reading indicating contraction. The total index is calculated based on a weighted average of the following five sub-indexes, with weights in parentheses: new orders (30%), production (25%), employment (20%), deliveries (15%), and inventories (10%). The ISM is one of the first comprehensive economic releases of the month, typically preceding the employment report. Though it covers only the manufacturing sector, it can often provide accurate hints regarding the tone of subsequent releases. During periods of inflation concerns, the prices paid and vendor deliveries indexes often determine the bond market's reaction to the report. In Depth The Institute for Supply Management's monthly Report on Business is probably the most widely watched economic indicator produced by the private sector. There are two key reasons for the ISM's prominence. First, its longevity - the report was first produced in 1931, and after a break during World War II, it has produced continuously since 1948. Second , its leading quality - the ISM has been one of the better predictors of the business cycle over the years. Who and What It Surveys The ISM index is the result of a monthly survey of over 400 companies in 20 industries throughout the 50 states. The survey queries respondents on a number of monthly indicators, including orders, production, employment, inventories, delivery times, prices paid, export orders, and import orders. Respondents are asked to characterize each indicator as higher, lower, or unchanged for the month (or faster/slower in the case of delivery times). They are not asked for specific numbers - only a thumbs up or down. Presenting the Numbers Based on these responses, the ISM calculates diffusion indexes for each of the components. These diffusion indexes are calculated by adding half of the percentage of respondents answering "unchanged" to the percentage answering "higher" (or "slower" for deliveries). These diffusion indexes do not yield estimates of specific magnitudes of strength or weakness, but the more respondents who are indicating trends in the same direction - the better the chance that the magnitude of that move is larger. A diffusion index of 50% is the theoretical breakeven mark - with readings above indicating strength and below indicating weakness. The ISM only provides the raw data - the Department of Commerce produces the seasonal factors which are used to provide more meaningful, seasonally adjusted indexes. The total index is not the result of a separate question regarding general business conditions (as is the case with the Philadelphia Fed index). Instead, the index is calculated using the weighted sum of five of the subindexes. Orders account for 30% of the total; production - 25%; employment - 20%; deliveries - 15%; inventories - 10%. Prices, export orders, and import orders are not part of the total index. Breakevens in Theory and Practice Though 50% is the breakeven mark in theory, different readings have proved to be breakeven in practice. For new orders, 50.3% is the level consistent with breakeven readings in factory orders. For production, 49.4% has been the breakeven mark in theory and practice. For employment, 47.5% has been consistent with a steady level of manufacturing employment. For inventories, 41.3% has been consistent with steady business inventory readings. And finally, the 42.7% mark on the total index marks the point below which the overall economy is believed to be in recession. Between 42.7-50%, the manufacturing sector may be in decline, but the total economy is only seeing slower growth. No Services This observation highlights the important element which is missing from the ISM index - the service sector. With the manufacturing sector making up an ever-shrinking percentage of the total economy - the ISM might seem to be an indicator in decline. Not so, however - the manufacturing sector, while shrinking in relative terms, still tends to lead the total economy into and out of recessions. The ISM therefore remains a closely watched indicator despite its manufacturing focus. A Proven Performer The ISM's leading quality has been proven over time. Its bottom during a recession has preceded the turning point for the business cycle by an average of four months, and its worst performance in leading the turning point was on two occasions when the ISM trough occurred in the same month as the business cycle trough. The ISM index is released on the first business day of each at 10:00 ET, with data for the prior calendar month. 27/08/09 23:30 House hold Spending -0.5% 0.2% Jul Country: Japan 27/08/09 23:30 Consumer Price Index (CPI) yy -2.2% -1.7% Jul Country: Japan Source: Bureau of Labor statistics, U.S. Department of Labor. Raw Data Available At: http://stats.bls.gov/news.release/cpi.toc.htm Release Time: 8:30 ET, about the 13th of each month for the prior month. The Consumer Price Index is a measure of the price level of a fixed market basket of goods and services purchased by consumers. CPI is the most widely cited inflation indicator, and it is used to calculate cost of living adjustments for government programs and it is the basis of COLAs for many private labor agreements as well. It has been criticized for overstating inflation, because it does not adjust for substitution effects and because the fixed basket does not reflect price changes in new technology goods which are often declining in price. Despite these criticisms, it remains the benchmark inflation index. 27/08/09 23:30 Unemployment Rate 5.5% 5.4% Jul Country: Japan Source: Bureau of Labor Statistics, U.S. Department of Labor. Raw Data Available At: http://stats.bls.gov/news.release/empsit.toc.htm Release Time: First Friday of the month at 8:30 ET for the prior month. In Brief The employment report is actually two separate reports which are the results of two separate surveys. The household survey is a survey of roughly 60,000 households. This survey produces the unemployment rate. The establishment survey is a survey of 375,000 businesses. This survey produces the nonfarm payrolls, average workweek, and average hourly earnings figures, to name a few. Both surveys cover the payroll period which includes the 12th of each month. The reports both measure employment levels, just from different angles. Due to the vastly different size of the survey samples (the establishment survey not only surveys more businesses, but each business employs many individuals), the measures of employment may differ markedly from month to month. The household survey is used only for the unemployment measure - the market focusses primarily on the more comprehensive establishment survey. Together, these two surveys make up the employment report, the most timely and broad indicator of economic activity released each month. Total payrolls are broken down into sectors such as manufacturing, mining, construction, services, and government. The markets follows these components closely as indicators of the trends in sectors of the economy; the manufacturing sector is watched the most closely as it often leads the business cycle. The data also include breakdowns of hours worked, overtime, and average hourly earnings. The average workweek (also known as hours worked) is important for two reasons. First, it is a critical determinant of such monthly indicators as industrial production and personal income. Second, it is considered a useful indicator of labor market conditions: a rising workweek early in the business cycle may be the first indication that employers are preparing to boost their payrolls, while late in the cycle a rising workweek may indicate that employers are having difficulty finding qualified applicants for open positions. Average earnings are closely followed as an indicator of potential inflation. Like the price of any good or service, the price of labor reacts to an overly accommodative monetary policy. If the price of labor is rising sharply, it may be an indication that too much money is chasing too few goods, or in this case employees. In Depth The employment report is really two reports - the household survey and the establishment survey. These two surveys contain a wealth of timely information which justify this report's status as the most important economic release of the month. This same wealth of information can nevertheless turn into a dearth of knowledge if it is not placed in the proper context. Household and Establishment Surveys The household and establishment surveys differ due to the source of the data, as the names suggest. The household survey is a survey of households and the establishment survey is a surveys of businesses. The establishment survey, which is sometimes referred to as the payrolls survey, is favored by the market for a simple reason - it is far more comprehensive. Both surveys attempt to measure employment conditions at the roughly the same point in time - the household survey covers the calendar week which includes the 12th of the month while the establishment survey covers the pay period (be it a week, two weeks, or longer) which includes the 12th. But the establishment survey covers 390,000 businesses which employ 47 million people, while the household survey covers just 50,000 individuals. With a sample size which is 940 times larger than the household survey, it is hardly surprising that the market is more interested in the establishment survey. Aside from the sample size, the surveys differ in other significant ways. The household survey counts farm workers, the self-employed, unpaid family workers, and private household workers as employed; the establishment survey does not. The household survey can only count one individual as employed once, even if that person holds two jobs. The establishment survey will double count an individual who appears on the payrolls of two companies. There are other, less significant differences, but let's turn now to the statistics produced by the two surveys. The Household Survey The Unemployment Rate As we noted earlier, the household survey is not nearly as reliable as the establishment survey due to the small size of the survey sample. This survey nevertheless receives attention, primarily because it is responsible for the one figure which is guaranteed to lead the nightly news - the unemployment rate. The unemployment rate demands little explanation, though it is worth noting that the rate can occasionally sees significant monthly changes which are due to flukes in the data. The rate is simply the result of dividing the number of people unemployed (labor force less employed) by the number of people in the labor force. The problem is that the employment and labor force measures in the household survey are far more volatile than even nonfarm payrolls. The reason, of course, is the small survey sample size. It is therefore useful to look at the labor force and employment figures themselves to determine if changes in the unemployment rate are due to aberrant swings in one or both of these series. Beyond the basics of tallying up the labor force and employment, the household survey breaks down these totals in every way imaginable - by gender, race, age, type of job, duration of unemployment, and on and on. These breakdowns seldom are of interest to the financial markets. Perhaps the only two exceptions are the discouraged worker and part-time worker measures. Discouraged Workers Discouraged workers are people who have dropped out of the labor force because they have become discouraged about their job prospects. During hard times, this statistic is often watched alongside the unemployment rate. If the job situation gets exceptionally bleak, it is possible to see the unemployment rate remaining stable not because people are finding jobs, but because they have given up looking and dropped out of the labor force. Part-Time Workers The issue of part time employment has arisen in recent years as many analysts have argued that strong payroll growth reflected the increase in the number of workers holding multiple part-time jobs. Since the payroll data do not differentiate between full and part-time workers, it is possible that a sudden surge in part-time employment which reflected poor full-time job prospects would actually boost payroll growth. In reality, it does not appear that this has happened, as part-time employment has been relatively steady in recent years. This figure nevertheless receives attention from time to time. The Big Picture Given the wealth of data contained in the employment report, it is important to take all of these indicators into account when passing judgment on the report. Looking at payrolls along is often misleading, as the workweek, earnings, and household employment measures may be telling a different story. Taken together, however, and taken with the caveats concerning monthly volatility and revisions, the employment report offers the best monthly glimpse of the economy. 28/08/09 08:30 Gross Domestic Product (GDP) qq -0.8% -0.8% Q2 Country: UK Source: Bureau of Economic Analysis, U.S. Department of Commerce. Raw Data Available At: http://www.bea.doc.gov/bea/dn1.htm Release Time: Third or fourth week of the month at 8:30 ET for the prior quarter, with subsequent revisions released in the second and third months of the quarter. Gross Domestic Product (GDP) is the broadest measure of economic activity. Annualized quarterly percent changes in GDP reflect the growth rate of total economic output. The figures can be quite volatile from quarter to quarter. Inventory and net export swings in particular can produce significant volatility in GDP. The final sales figure, which excludes inventories, can sometimes be helpful in identifying underlying growth trends as inventories represent unsold goods, and a large inventory increase will boost GDP but might be indicative of weakness rather than strength. The broad components of GDP are: consumption, investment, net exports, government purchases, and inventories. Consumption is by far the largest component, totalling roughly 2/3rds of GDP. In addition to the GDP figures, there are GDP deflators, which measure the change in prices in total GDP and for each component. Though the consumer price index is a more closely watched inflation indicator, the GDP deflator is another key inflation measure. Unlike CPI, it has the advantage of not being a fixed basket of goods and services, so that changes in consumption patterns or the introduction of new goods and services will be reflected in the deflator. With both GDP and the deflator, the market tends to focus on the quarter/quarter change. Year/year changes are also cited frequently, though they do not provide the most timely indications of economic activity or inflation. The bond market often reacts to GDP, though the price moves are typically small, as much of the GDP data is easily predicted using monthly economic releases such as personal consumption, durable goods shipments, construction spending, international trade, and inventories. Quarterly GDP reports are broken down into three announcements: advance, preliminary, and final. After the final revision, GDP is not revised again until the annual benchmark revisions each July. These revisions can be quite large and usually affect the past five years of data. 28/08/09 08:30 Gross Domestic Product (GDP) yy -5.6% -5.6% Q2 Country: UK Source: Bureau of Economic Analysis, U.S. Department of Commerce. Raw Data Available At: http://www.bea.doc.gov/bea/dn1.htm Release Time: Third or fourth week of the month at 8:30 ET for the prior quarter, with subsequent revisions released in the second and third months of the quarter. Gross Domestic Product (GDP) is the broadest measure of economic activity. Annualized quarterly percent changes in GDP reflect the growth rate of total economic output. The figures can be quite volatile from quarter to quarter. Inventory and net export swings in particular can produce significant volatility in GDP. The final sales figure, which excludes inventories, can sometimes be helpful in identifying underlying growth trends as inventories represent unsold goods, and a large inventory increase will boost GDP but might be indicative of weakness rather than strength. The broad components of GDP are: consumption, investment, net exports, government purchases, and inventories. Consumption is by far the largest component, totalling roughly 2/3rds of GDP. In addition to the GDP figures, there are GDP deflators, which measure the change in prices in total GDP and for each component. Though the consumer price index is a more closely watched inflation indicator, the GDP deflator is another key inflation measure. Unlike CPI, it has the advantage of not being a fixed basket of goods and services, so that changes in consumption patterns or the introduction of new goods and services will be reflected in the deflator. With both GDP and the deflator, the market tends to focus on the quarter/quarter change. Year/year changes are also cited frequently, though they do not provide the most timely indications of economic activity or inflation. The bond market often reacts to GDP, though the price moves are typically small, as much of the GDP data is easily predicted using monthly economic releases such as personal consumption, durable goods shipments, construction spending, international trade, and inventories. Quarterly GDP reports are broken down into three announcements: advance, preliminary, and final. After the final revision, GDP is not revised again until the annual benchmark revisions each July. These revisions can be quite large and usually affect the past five years of data. 28/08/09 09:00 Economic Sentiment 78.0 76.0 Aug Country: EMU 28/08/09 09:00 Industrial Sentiment -28.0% -30.0% Aug Country: EMU 28/08/09 09:00 Service Sentiment -17.0 -18.0 Aug Country: EMU 28/08/09 09:30 KOF Purchasing Manager ind -0.58 -0.99 Aug Country: Switzerland 28/08/09 12:30 Personal Consumption 0.2% 0.4% Jul Country: US 28/08/09 12:30 Core PCE mm 0.1% 0.2% Jul Country: US Source: The Bureau of Economic Analysis of the Department of Commerce. Raw Data Available At: http://www.bea.doc.gov/bea/rels.htm Release Time: 8:30 ET around the first business day of the month (data for two months prior). Personal income measures income from all sources. The largest component of total income is wages and salaries, a figure which can be estimated using payrolls and earnings data from the employment report. Beyond that, there are many other categories of income, including rental income, government subsidy payments, interest income, and dividend income. Personal income is a decent indicator of future consumer demand, but it is not perfect. Recessions usually occur when consumers stop spending, which then drives down income growth. Looking solely at income growth, one may therefore miss the turning point when consumers stop spending. The income report also includes a section covering personal consumption expenditures, also known as PCE. PCE is comprised of three categories: durables, nondurables, and services. The retail sales report will provide a good read on durable and nondurable consumption, while service purchases tend to grow at a fairly steady pace, making this a relatively predictable report, and ranking it well below retail sales in terms of market importance. 28/08/09 12:30 Core PCE yy 1.5% Jul Country: US Source: The Bureau of Economic Analysis of the Department of Commerce. Raw Data Available At: http://www.bea.doc.gov/bea/rels.htm Release Time: 8:30 ET around the first business day of the month (data for two months prior). Personal income measures income from all sources. The largest component of total income is wages and salaries, a figure which can be estimated using payrolls and earnings data from the employment report. Beyond that, there are many other categories of income, including rental income, government subsidy payments, interest income, and dividend income. Personal income is a decent indicator of future consumer demand, but it is not perfect. Recessions usually occur when consumers stop spending, which then drives down income growth. Looking solely at income growth, one may therefore miss the turning point when consumers stop spending. The income report also includes a section covering personal consumption expenditures, also known as PCE. PCE is comprised of three categories: durables, nondurables, and services. The retail sales report will provide a good read on durable and nondurable consumption, while service purchases tend to grow at a fairly steady pace, making this a relatively predictable report, and ranking it well below retail sales in terms of market importance. 28/08/09 12:30 Personal Consumption Exp. mm 0.5% Jul Country: US Source: The Bureau of Economic Analysis of the Department of Commerce. Raw Data Available At: http://www.bea.doc.gov/bea/rels.htm Release Time: 8:30 ET around the first business day of the month (data for two months prior). Personal income measures income from all sources. The largest component of total income is wages and salaries, a figure which can be estimated using payrolls and earnings data from the employment report. Beyond that, there are many other categories of income, including rental income, government subsidy payments, interest income, and dividend income. Personal income is a decent indicator of future consumer demand, but it is not perfect. Recessions usually occur when consumers stop spending, which then drives down income growth. Looking solely at income growth, one may therefore miss the turning point when consumers stop spending. The income report also includes a section covering personal consumption expenditures, also known as PCE. PCE is comprised of three categories: durables, nondurables, and services. The retail sales report will provide a good read on durable and nondurable consumption, while service purchases tend to grow at a fairly steady pace, making this a relatively predictable report, and ranking it well below retail sales in terms of market importance. 28/08/09 12:30 Personal Consumption Exp. yy -0.4% Jul Country: US Source: The Bureau of Economic Analysis of the Department of Commerce. Raw Data Available At: http://www.bea.doc.gov/bea/rels.htm Release Time: 8:30 ET around the first business day of the month (data for two months prior). Personal income measures income from all sources. The largest component of total income is wages and salaries, a figure which can be estimated using payrolls and earnings data from the employment report. Beyond that, there are many other categories of income, including rental income, government subsidy payments, interest income, and dividend income. Personal income is a decent indicator of future consumer demand, but it is not perfect. Recessions usually occur when consumers stop spending, which then drives down income growth. Looking solely at income growth, one may therefore miss the turning point when consumers stop spending. The income report also includes a section covering personal consumption expenditures, also known as PCE. PCE is comprised of three categories: durables, nondurables, and services. The retail sales report will provide a good read on durable and nondurable consumption, while service purchases tend to grow at a fairly steady pace, making this a relatively predictable report, and ranking it well below retail sales in terms of market importance. 28/08/09 12:30 Personal Income 0.2% -1.3% Jul Country: US Source: The Bureau of Economic Analysis of the Department of Commerce. Raw Data Available At: http://www.bea.doc.gov/bea/rels.htm Release Time: 8:30 ET around the first business day of the month (data for two months prior). Personal income measures income from all sources. The largest component of total income is wages and salaries, a figure which can be estimated using payrolls and earnings data from the employment report. Beyond that, there are many other categories of income, including rental income, government subsidy payments, interest income, and dividend income. Personal income is a decent indicator of future consumer demand, but it is not perfect. Recessions usually occur when consumers stop spending, which then drives down income growth. Looking solely at income growth, one may therefore miss the turning point when consumers stop spending. The income report also includes a section covering personal consumption expenditures, also known as PCE. PCE is comprised of three categories: durables, nondurables, and services. The retail sales report will provide a good read on durable and nondurable consumption, while service purchases tend to grow at a fairly steady pace, making this a relatively predictable report, and ranking it well below retail sales in terms of market importance. 28/08/09 12:30 Current Account -9.06b Q2 Country: Canada 28/08/09 12:30 Producer Price Index (PPI) mm 0.7% Jul Country: Canada Source: Bureau of Labor statistics, U.S. Department of Labor. Raw Data Available At: http://stats.bls.gov/news.release/ppi.toc.htm Release Time: Around the 11th of each month at 8:30 ET for the prior month. The Producer Price Index measures prices of goods at the wholesale level. There are three broad subcategories within PPI: crude, intermediate, and finished. The market tracks the finished goods index most closely, as it represents prices for goods that are ready for sale to the end user. Goods prices at the crude and intermediate stages of production often provide an indication of coming (dis)inflationary pressures, but the closer you get to crude goods, the more that these prices track commodity prices which are already available in traded indexes such as the CRB (Commodity Research Bureau). At all stages of production, the market places more emphasis on the index excluding food and energy, referred to as the core rate. Food and energy prices tend to be quite volatile and obscure trends in the underlying inflation rate. Though the market reaction is determined by the month/month changes, year/year changes are also noted by analysts. The index is not revised on a monthly basis, but annual revisions to seasonal adjustment factors can produce small adjustments to past releases. 28/08/09 12:30 Producer Price Index (PPI) yy -5.4% Jul Country: Canada Source: Bureau of Labor statistics, U.S. Department of Labor. Raw Data Available At: http://stats.bls.gov/news.release/ppi.toc.htm Release Time: Around the 11th of each month at 8:30 ET for the prior month. The Producer Price Index measures prices of goods at the wholesale level. There are three broad subcategories within PPI: crude, intermediate, and finished. The market tracks the finished goods index most closely, as it represents prices for goods that are ready for sale to the end user. Goods prices at the crude and intermediate stages of production often provide an indication of coming (dis)inflationary pressures, but the closer you get to crude goods, the more that these prices track commodity prices which are already available in traded indexes such as the CRB (Commodity Research Bureau). At all stages of production, the market places more emphasis on the index excluding food and energy, referred to as the core rate. Food and energy prices tend to be quite volatile and obscure trends in the underlying inflation rate. Though the market reaction is determined by the month/month changes, year/year changes are also noted by analysts. The index is not revised on a monthly basis, but annual revisions to seasonal adjustment factors can produce small adjustments to past releases. 28/08/09 13:55 U.Michigan Consumer Sentiment 64.5 66.0 Aug Country: US Source: The University of Michigan. Release Time: Preliminary: 10:00 ET on the second Friday of the month (data for current month); Final: 10:00 ET on the fourth Friday of the month (data for current month). This survey measures the attitudes and expectations concerning both present and future economic conditions of 500 consumers. The Michigan index is almost identical to the Conference Board Consumer Confidence index, though there are two monthly releases, a preliminary and final reading. Like the Conference Board index, it has two subindexes - expectations and current conditions. The expectations index is a component of the Conference Board's Leading Indicators index. Consumer spending accounts for two-thirds of the economy, so the markets follow any indicator relating to consumer behavior and attitudes. The more confident consumers are about the economy and their own personal finances, the more likely they are to spend. It is interesting to note that changes in consumer sentiment and retail sales don't move in tandem. Results for the week of:16/08/09 - 21/08/09 16 August 2009 - 21 August 2009 Timezone GMT (Greenwich Mean Time) Date Time Importance Event Actual Forecast Previous Period 17/08/09 07:15 Retail Sales mm -1.4% Jun Country: Switzerland Source: The Census Bureau of the Department of Commerce. Raw Data Available At: http://www.census.gov/svsd/www/advtable.html Release Time: 8:30 ET around the 13th of the month (data for one month prior). The retail sales report is a measure of the total receipts of retail stores. The changes in retail sales are widely followed as the most timely indicator of broad consumer spending patterns. Retail sales are often viewed ex-autos, as auto sales can move sharply from month-to-month. It is also important to keep an eye on the gas and food components, where changes in sales are often a result of price changes rather than shifting consumer demand. Retail sales can be quite volatile and the advance reports are subject to rather large revisions. Retail sales do not include spending on services, which makes up over half of total consumption. Total personal consumption is not available until the personal income and consumption reports are released, typically two weeks after retail sales. 17/08/09 09:00 International Trade Balance yy 1.9b Jun Country: EMU Source: The Census Bureau and the Bureau of Economic Analysis of the Department of Commerce. Raw Data Available At: http://www.census.gov/foreign-trade/www/press.html Release Time: 8:30 ET around the 20th of the month (data for two months prior). The trade report is most widely watched for trends in the overall trade balance. But trends in both exports and imports of goods and services bear watching as well. The export data in particular are important to watch for indications that a strengthening competitive position at home and/or strengthening economies overseas are boosting U.S. growth. Imports provide an indication of domestic demand, but given the severe lag of this report relative to other consumption indicators, it is not particularly valuable for this purpose. The volatility in the monthly trade balance can play an important role in GDP forecasts. Net exports are a relatively volatile component of GDP, and the trade report provides the only early clues to the net export performance each quarter. 17/08/09 12:30 New-York Fed Survey 1.0 -0.55 Aug Country: US Source: Chicago Purchasing Managers Association. Raw Data Available At: http://www.phil.frb.org/ Release Time: Last business day of the month at 10 ET for the current month. In Brief There are many regional manufacturing surveys, and they tend to be ranked in order of timeliness and the importance of the region. The Philadelphia Fed's survey is first each month, actually coming out during the third week of the month for which it is reporting. Several smaller surveys are then released before the Chicago purchasing managers' report on the last day of each month. A few, such as the Atlanta and Richmond Fed surveys, are released after the NAPM and are of little value. The purchasing managers' reports are measured like the national NAPM - 50% marks the breakeven line between an expanding and contracting manufacturing sector. For the Philadelphia and Atlanta Fed indexes, 0 is the breakeven mark. These surveys can be of some help in forecasting the national NAPM - particularly the Philadelphia and Chicago surveys which are more closely watched due to their timeliness and the fact that these regions represent a reasonable cross section of national manufacturing activities. In Depth The market has been bombarded with a bevy of surveys purporting to measure manufacturing activity in every nook and cranny of the country. First it was Philadelphia, then Chicago, and Detroit, Milwaukee, New York, Cincinnati, Richmond, Atlanta, Boston, and there might as well have been a Nome survey. This hodge-podge of releases is begging for someone - namely us - to come along and cut this group down to a more manageable size. Nuts and Bolts Let's start with the issue of what these manufacturing surveys are trying to measure and how they go about doing it. The leader of this pack of regional surveys is the ISM index which comes from the Institute for Supply Management (formerly the National Association of Purchasing Managers). It has been around since 1931 (1948 on an uninterrupted basis), it is national, and it is one of the most timely measures of manufacturing activity available. In other words, it sets the standards by which its progeny are measured. The ISM index is actually a composite of five sub-indexes - new orders, production, supplier deliveries, inventories, and employment. In surveying over 300 companies each month, the ISM asks for positive, negative, or unchanged readings on each of these indicators. The positive responses are added to one half of the unchanged responses to produce the diffusion index. For example, if 50% of respondents reported stronger orders, 40% reported weaker, and 10% unchanged, the diffusion index for orders would be 55%, the 50% positive plus half of the 10% unchanged. To calculate the total index, the ISM uses weights for the five indicators, which are as follows: 30% new orders, 25% production, 20% employment, 15% supplier deliveries, and 10% inventories. The Selection Criteria Since this methodology has made the ISM index one of the better leading indicators of economic activity over the years, we will measure the usefulness of the regional indexes based on their ability to help in forecasting the national index. In our effort to arrive at the most important regional indices, these criteria make eliminating most of the candidates easy for one simple reason - they are released after the national index. While regional economic developments are of interest to those who live in the region, they are not particularly important to the markets. If a region cannot help in forecasting national trends, then its data are not particularly useful. So say adios to Atlanta, Richmond, Kansas City, and who knows how many others which have cropped up in recent years. And the Winner Is... Let's focus on the regional surveys which precede the release of the national index on the first business day of each month (with data for the prior month). The contestants are Philadelphia, Chicago, Milwaukee, Detroit, New York, and the most recent addition to the bunch - the APICS survey. We looked at the correlation of all of these indexes to the national NAPM and found substantial differences in their forecasting ability. The winners are...drum roll please...Chicago and Philadelphia, in that order. The Chicago PMI (officially known as the Business Barometer) is a monthly composite index based on opinion surveys of more than 200 Chicago purchasing managers regarding the manufacturing industry. The survey responses are limited to three options: slower, faster and same. As such, the index will not capture if a component is growing but at a much slower rate or vice versa. The index is a composite of seven similarly constructed indexes including: new orders, production, supplier delivery times, backlogs, inventories, prices paid, and employment. New orders and orders backlog indices indicate future production activity. It signals factory-sector expansion when it is above 50 and contraction when below it. The index is seasonally adjusted for the effects of variations within the year, differences due to holidays and institutional changes. Because it is an opinion survey, it is often influenced by respondents' perception of current events, as opposed to actual hard data. Also, it does not capture technological and production changes, which make it possible for production to expand, while employment contracts. Because the Chicago PMI is released the day before the ISM, it is watched in order to predict the more important ISM report (the Chicago PMI has an impressive 91% correlation with the ISM national NAPM), which is in itself a good leading indicator of overall economic activity. It frequently moves markets. The Philadelphia Fed index, which is released on the third Thursday of the month (with data for the same month), was a distant second at 76%. Philly Fed's performance improved slightly to 78% when Briefing measured its results using the NAPM methodology. The Philly index as released is not a composite of its subindexes, as the NAPM is. Instead, the Philly Fed survey asks many questions, but the total index is based on the general question "are business conditions better or worse than last month." It is often the case that a weighted measure of the individual questions on specifics such as new orders and production moves in a different direction than the index based on the general question. The rest of the regional indexes fared poorly, ranging from correlations as poor as 55% (APICS) to 73% (Milwaukee). Chicago was the clear winner, but the Philly Fed index definitely deserves recognition, particularly since it is released so much earlier than the rest. In the future, then, we would recommend setting aside most of the regional manufacturing surveys and focussing on just Philly and Chicago, which offer the best hope of predicting the national index. And when you look at the Philly index, improve your chances by looking at the Philly numbers calculated on an NAPM basis, which Briefing will be happy to provide. 17/08/09 13:00 Capital Flow 66.6b- Jun Country: US The Capital Account records a nation's incoming and outgoing investment flows such as payments for entire or parts of companies (direct or portfolio investment), stocks, bonds, bank accounts, real estate and factories. The balance of payments is influenced by many factors, including the financial and economic climate of other countries. Short-term capital movements Short-term flows into liquid assets such as bank deposits and Treasury bills are easily reversed and are sometimes characterised as "hot money". Since flows can change direction at the drop of an interest rate, they can cause severe volatility in the currency markets. Long-term capital movements Long-term capital includes portfolio investment (stocks and shares) and direct investment (such as building a factory overseas). However, it is perhaps increasingly unrealistic to distinguish between investment in stocks and shares (long-term capital) and the acquisition of Treasury bills (short-term capital). An outflow today implies current-account income in the future. Indeed, with global deregulation, it is easier for companies to raise their market share by setting up production facilities overseas. The initial direct investment shows as a capital-account outflow. Subsequently remitted profits add to current-account inflows and boost GNP relative to GDP. The value of goods sold, however, does not show up in external trade or increase GDP in the way that exports from home would. 18/08/09 01:40 Producer Price Index (PPI) yy 0.7%- 1.4%- Q2 Country: NewZealand Source: Bureau of Labor statistics, U.S. Department of Labor. Raw Data Available At: http://stats.bls.gov/news.release/ppi.toc.htm Release Time: Around the 11th of each month at 8:30 ET for the prior month. The Producer Price Index measures prices of goods at the wholesale level. There are three broad subcategories within PPI: crude, intermediate, and finished. The market tracks the finished goods index most closely, as it represents prices for goods that are ready for sale to the end user. Goods prices at the crude and intermediate stages of production often provide an indication of coming (dis)inflationary pressures, but the closer you get to crude goods, the more that these prices track commodity prices which are already available in traded indexes such as the CRB (Commodity Research Bureau). At all stages of production, the market places more emphasis on the index excluding food and energy, referred to as the core rate. Food and energy prices tend to be quite volatile and obscure trends in the underlying inflation rate. Though the market reaction is determined by the month/month changes, year/year changes are also noted by analysts. The index is not revised on a monthly basis, but annual revisions to seasonal adjustment factors can produce small adjustments to past releases. 18/08/09 01:45 Core PPI mm 0.1%- 2.5%- Q2 Country: NewZealand Source: Bureau of Labor statistics, U.S. Department of Labor. Raw Data Available At: http://stats.bls.gov/news.release/ppi.toc.htm Release Time: Around the 11th of each month at 8:30 ET for the prior month. The Producer Price Index measures prices of goods at the wholesale level. There are three broad subcategories within PPI: crude, intermediate, and finished. The market tracks the finished goods index most closely, as it represents prices for goods that are ready for sale to the end user. Goods prices at the crude and intermediate stages of production often provide an indication of coming (dis)inflationary pressures, but the closer you get to crude goods, the more that these prices track commodity prices which are already available in traded indexes such as the CRB (Commodity Research Bureau). At all stages of production, the market places more emphasis on the index excluding food and energy, referred to as the core rate. Food and energy prices tend to be quite volatile and obscure trends in the underlying inflation rate. Though the market reaction is determined by the month/month changes, year/year changes are also noted by analysts. The index is not revised on a monthly basis, but annual revisions to seasonal adjustment factors can produce small adjustments to past releases. 18/08/09 08:30 Consumer Price Index (CPI) yy 1.6% 1.8% Jul Country: UK Source: Bureau of Labor statistics, U.S. Department of Labor. Raw Data Available At: http://stats.bls.gov/news.release/cpi.toc.htm Release Time: 8:30 ET, about the 13th of each month for the prior month. The Consumer Price Index is a measure of the price level of a fixed market basket of goods and services purchased by consumers. CPI is the most widely cited inflation indicator, and it is used to calculate cost of living adjustments for government programs and it is the basis of COLAs for many private labor agreements as well. It has been criticized for overstating inflation, because it does not adjust for substitution effects and because the fixed basket does not reflect price changes in new technology goods which are often declining in price. Despite these criticisms, it remains the benchmark inflation index. 18/08/09 08:30 Retail Price Index (RPI) mm 0.2%- 0.3% Jul Country: UK The RPI Contains figures for the RPIX (RPI which excludes mortgage interest payments), until 10 December 2003 published as the UK main measure of inflation. Since then, the HICP in considered as the main measure of inflation for macroeconomic purposes. The harmonised indices of consumer prices (HICPs) are calculated in each member state of the European Union for the purposes of European comparisons, as required by the Maastricht Treaty. The RPI is often described in terms of a shopping basket containing some 650 goods and services, chosen as indicators of price movements for a range of similar items. Taking bread as an example, several different types of bread are priced (e.g. large white loaves (sliced and unsliced), small brown loaf, large wholemeal loaf, bread rolls, pitta bread and french stick/baguette). These are considered as representative of the majority of bread consumption by most households. Each price collector collects the price of a representative item (e.g. brand) for that price indicator in January and exactly the same item/ brand must be priced every month for a period of thirteen months. Each month price indices are constructed comparing the latest price with the price in the base month (January). Finally price indices for price indicators are aggregated to items and then to sections which is the published level and rescaled to a reference point of January 1987=100. This allows price changes to be compared to a year earlier (i.e. the annual inflation rate) and to previous years. How is it published? Every month data is published on either the second or third Tuesday in a month (depending on the month) in a Consumer Price Indices First Release along with Additional Briefing Notes, which give the stories behind the figures. Data is also published in the electronic publication Focus on Consumer Prices available on the National Statistics website. How often are the components reviewed? The Office for National Statistics reviews the components of the Retail Price Index once every year, to keep it as up to date as possible, reflecting changes in consumers' preferences and the establishment of new products. Each year the changes are announced in a News Release and published in an article. What are the origins of the Retail Prices? Although there were occasional official comparisons of prices for food in the nineteenth and early twentieth century, the Government first began a systematic, continuous check on the increase of the cost of living in 1914, but the coverage was very limited. After the Second World War a cost of living Advisory Committee was set up and an experimental price index known as the Interim Index of Retail Prices ran from 1947 to 1956. In January 1956, the first official Retail Prices Index began with various methodological changes implemented since then following reviews by RPI Advisory Committees. The latest Advisory Committees met in the early 1990s and made recommendations about the treatment of housing costs, holidays and car prices. RPIX, which excludes mortgage interest payments; RPIY, which excludes mortgage interest rates and indirect taxes (VAT, council tax, duties vehicle excise duty, insurance tax and air passenger duty); Quarterly Pensioner Indices, which use the same price data as RPI, weighted for the typical spending of one and two-pensioner households and excluding items such as school dinners, work place canteen meals and housing; and the Tax and Price Index, which measures how much the average person's gross income needs to change to purchase the RPI basket after allowing for the average amount of income tax and national insurance paid on earnings. 18/08/09 08:30 Retail Price Index (RPI) yy 1.6%- 1.6%- Jul Country: UK The RPI Contains figures for the RPIX (RPI which excludes mortgage interest payments), until 10 December 2003 published as the UK main measure of inflation. Since then, the HICP in considered as the main measure of inflation for macroeconomic purposes. The harmonised indices of consumer prices (HICPs) are calculated in each member state of the European Union for the purposes of European comparisons, as required by the Maastricht Treaty. The RPI is often described in terms of a shopping basket containing some 650 goods and services, chosen as indicators of price movements for a range of similar items. Taking bread as an example, several different types of bread are priced (e.g. large white loaves (sliced and unsliced), small brown loaf, large wholemeal loaf, bread rolls, pitta bread and french stick/baguette). These are considered as representative of the majority of bread consumption by most households. Each price collector collects the price of a representative item (e.g. brand) for that price indicator in January and exactly the same item/ brand must be priced every month for a period of thirteen months. Each month price indices are constructed comparing the latest price with the price in the base month (January). Finally price indices for price indicators are aggregated to items and then to sections which is the published level and rescaled to a reference point of January 1987=100. This allows price changes to be compared to a year earlier (i.e. the annual inflation rate) and to previous years. How is it published? Every month data is published on either the second or third Tuesday in a month (depending on the month) in a Consumer Price Indices First Release along with Additional Briefing Notes, which give the stories behind the figures. Data is also published in the electronic publication Focus on Consumer Prices available on the National Statistics website. How often are the components reviewed? The Office for National Statistics reviews the components of the Retail Price Index once every year, to keep it as up to date as possible, reflecting changes in consumers' preferences and the establishment of new products. Each year the changes are announced in a News Release and published in an article. What are the origins of the Retail Prices? Although there were occasional official comparisons of prices for food in the nineteenth and early twentieth century, the Government first began a systematic, continuous check on the increase of the cost of living in 1914, but the coverage was very limited. After the Second World War a cost of living Advisory Committee was set up and an experimental price index known as the Interim Index of Retail Prices ran from 1947 to 1956. In January 1956, the first official Retail Prices Index began with various methodological changes implemented since then following reviews by RPI Advisory Committees. The latest Advisory Committees met in the early 1990s and made recommendations about the treatment of housing costs, holidays and car prices. RPIX, which excludes mortgage interest payments; RPIY, which excludes mortgage interest rates and indirect taxes (VAT, council tax, duties vehicle excise duty, insurance tax and air passenger duty); Quarterly Pensioner Indices, which use the same price data as RPI, weighted for the typical spending of one and two-pensioner households and excluding items such as school dinners, work place canteen meals and housing; and the Tax and Price Index, which measures how much the average person's gross income needs to change to purchase the RPI basket after allowing for the average amount of income tax and national insurance paid on earnings. 18/08/09 08:30 Retail Price Index (RPI) mm - core 0.3% Jul Country: UK The RPI Contains figures for the RPIX (RPI which excludes mortgage interest payments), until 10 December 2003 published as the UK main measure of inflation. Since then, the HICP in considered as the main measure of inflation for macroeconomic purposes. The harmonised indices of consumer prices (HICPs) are calculated in each member state of the European Union for the purposes of European comparisons, as required by the Maastricht Treaty. The RPI is often described in terms of a shopping basket containing some 650 goods and services, chosen as indicators of price movements for a range of similar items. Taking bread as an example, several different types of bread are priced (e.g. large white loaves (sliced and unsliced), small brown loaf, large wholemeal loaf, bread rolls, pitta bread and french stick/baguette). These are considered as representative of the majority of bread consumption by most households. Each price collector collects the price of a representative item (e.g. brand) for that price indicator in January and exactly the same item/ brand must be priced every month for a period of thirteen months. Each month price indices are constructed comparing the latest price with the price in the base month (January). Finally price indices for price indicators are aggregated to items and then to sections which is the published level and rescaled to a reference point of January 1987=100. This allows price changes to be compared to a year earlier (i.e. the annual inflation rate) and to previous years. How is it published? Every month data is published on either the second or third Tuesday in a month (depending on the month) in a Consumer Price Indices First Release along with Additional Briefing Notes, which give the stories behind the figures. Data is also published in the electronic publication Focus on Consumer Prices available on the National Statistics website. How often are the components reviewed? The Office for National Statistics reviews the components of the Retail Price Index once every year, to keep it as up to date as possible, reflecting changes in consumers' preferences and the establishment of new products. Each year the changes are announced in a News Release and published in an article. What are the origins of the Retail Prices? Although there were occasional official comparisons of prices for food in the nineteenth and early twentieth century, the Government first began a systematic, continuous check on the increase of the cost of living in 1914, but the coverage was very limited. After the Second World War a cost of living Advisory Committee was set up and an experimental price index known as the Interim Index of Retail Prices ran from 1947 to 1956. In January 1956, the first official Retail Prices Index began with various methodological changes implemented since then following reviews by RPI Advisory Committees. The latest Advisory Committees met in the early 1990s and made recommendations about the treatment of housing costs, holidays and car prices. RPIX, which excludes mortgage interest payments; RPIY, which excludes mortgage interest rates and indirect taxes (VAT, council tax, duties vehicle excise duty, insurance tax and air passenger duty); Quarterly Pensioner Indices, which use the same price data as RPI, weighted for the typical spending of one and two-pensioner households and excluding items such as school dinners, work place canteen meals and housing; and the Tax and Price Index, which measures how much the average person's gross income needs to change to purchase the RPI basket after allowing for the average amount of income tax and national insurance paid on earnings. 18/08/09 08:30 Retail Price Index (RPI) yy - core 0.9% 1.0% Jul Country: UK The RPI Contains figures for the RPIX (RPI which excludes mortgage interest payments), until 10 December 2003 published as the UK main measure of inflation. Since then, the HICP in considered as the main measure of inflation for macroeconomic purposes. The harmonised indices of consumer prices (HICPs) are calculated in each member state of the European Union for the purposes of European comparisons, as required by the Maastricht Treaty. The RPI is often described in terms of a shopping basket containing some 650 goods and services, chosen as indicators of price movements for a range of similar items. Taking bread as an example, several different types of bread are priced (e.g. large white loaves (sliced and unsliced), small brown loaf, large wholemeal loaf, bread rolls, pitta bread and french stick/baguette). These are considered as representative of the majority of bread consumption by most households. Each price collector collects the price of a representative item (e.g. brand) for that price indicator in January and exactly the same item/ brand must be priced every month for a period of thirteen months. Each month price indices are constructed comparing the latest price with the price in the base month (January). Finally price indices for price indicators are aggregated to items and then to sections which is the published level and rescaled to a reference point of January 1987=100. This allows price changes to be compared to a year earlier (i.e. the annual inflation rate) and to previous years. How is it published? Every month data is published on either the second or third Tuesday in a month (depending on the month) in a Consumer Price Indices First Release along with Additional Briefing Notes, which give the stories behind the figures. Data is also published in the electronic publication Focus on Consumer Prices available on the National Statistics website. How often are the components reviewed? The Office for National Statistics reviews the components of the Retail Price Index once every year, to keep it as up to date as possible, reflecting changes in consumers' preferences and the establishment of new products. Each year the changes are announced in a News Release and published in an article. What are the origins of the Retail Prices? Although there were occasional official comparisons of prices for food in the nineteenth and early twentieth century, the Government first began a systematic, continuous check on the increase of the cost of living in 1914, but the coverage was very limited. After the Second World War a cost of living Advisory Committee was set up and an experimental price index known as the Interim Index of Retail Prices ran from 1947 to 1956. In January 1956, the first official Retail Prices Index began with various methodological changes implemented since then following reviews by RPI Advisory Committees. The latest Advisory Committees met in the early 1990s and made recommendations about the treatment of housing costs, holidays and car prices. RPIX, which excludes mortgage interest payments; RPIY, which excludes mortgage interest rates and indirect taxes (VAT, council tax, duties vehicle excise duty, insurance tax and air passenger duty); Quarterly Pensioner Indices, which use the same price data as RPI, weighted for the typical spending of one and two-pensioner households and excluding items such as school dinners, work place canteen meals and housing; and the Tax and Price Index, which measures how much the average person's gross income needs to change to purchase the RPI basket after allowing for the average amount of income tax and national insurance paid on earnings. 18/08/09 09:30 ZEW Economic Sentiment 45 39.5 Aug Country: Germany Source: ZEW - The Centre for European Economic Research. Raw Data Available At: http://www.zew.de/ The ZEW (Zentrum für Europäische Wirtschaftsforschung - Centre for European Economic Research) is a non-profit economic research institute with the legal form of a limited liability company (GmbH). It was founded in 1990 on the initiative of the government of the federal state Baden-Württemberg, trade and industry, and the Mannheim University. In April 1991 the institute took up work and has expanded rapidly since then. The ZEW Index measures investors' expectations of economic growth. The ZEW index has a good reputation of anticipating the results of the broader IFO index that is widely regarded as an important leading indicator of the economy. The IFO index is available later in each month. 18/08/09 12:30 Housing Starts yy 0.6m 0.582m Jul Country: US Source: The Census Bureau of the Department of Commerce. Raw Data Available At: http://www.census.gov/const/www/newresconstindex.html Release Time: 8:30 ET around the 16th of the month (data for one month prior). Housing Starts are a measure of the number of residential units on which construction is begun each month. A start in construction is defined as the beginning of excavation of the foundation for the building and is comprised primarily of residential housing. Building permits are permits taken out in order to allow excavation. An increase in building permits and starts usually occurs a few months after a reduction in mortgage rates. Permits lead starts, but permits are not required in all regions of the country, and the level of permits therefore tends to be less than the level of starts over time. The monthly national report is broken down by region: Northeast, Midwest, South, and West. Briefing recommends analyzing the regional data because they are subject to a high degree of volatility. The high volatility can be attributed to weather changes and/or natural disasters. For example, an unexpectedly high level of rain in South could delay housing starts for the region. 18/08/09 12:30 Producer Price Index (PPI) yy 5.9%- 4.6%- Jul Country: US Source: Bureau of Labor statistics, U.S. Department of Labor. Raw Data Available At: http://stats.bls.gov/news.release/ppi.toc.htm Release Time: Around the 11th of each month at 8:30 ET for the prior month. The Producer Price Index measures prices of goods at the wholesale level. There are three broad subcategories within PPI: crude, intermediate, and finished. The market tracks the finished goods index most closely, as it represents prices for goods that are ready for sale to the end user. Goods prices at the crude and intermediate stages of production often provide an indication of coming (dis)inflationary pressures, but the closer you get to crude goods, the more that these prices track commodity prices which are already available in traded indexes such as the CRB (Commodity Research Bureau). At all stages of production, the market places more emphasis on the index excluding food and energy, referred to as the core rate. Food and energy prices tend to be quite volatile and obscure trends in the underlying inflation rate. Though the market reaction is determined by the month/month changes, year/year changes are also noted by analysts. The index is not revised on a monthly basis, but annual revisions to seasonal adjustment factors can produce small adjustments to past releases. 18/08/09 12:30 Building Permits 0.58m 0.57m Jul Country: US Source: The Census Bureau of the Department of Commerce. Raw Data Available At: http://www.census.gov/const/www/newresconstindex.html Release Time: 8:30 ET around the 16th of the month (data for one month prior). Housing Starts are a measure of the number of residential units on which construction is begun each month. A start in construction is defined as the beginning of excavation of the foundation for the building and is comprised primarily of residential housing. Building permits are permits taken out in order to allow excavation. An increase in building permits and starts usually occurs a few months after a reduction in mortgage rates. Permits lead starts, but permits are not required in all regions of the country, and the level of permits therefore tends to be less than the level of starts over time. The monthly national report is broken down by region: Northeast, Midwest, South, and West. Briefing recommends analyzing the regional data because they are subject to a high degree of volatility. The high volatility can be attributed to weather changes and/or natural disasters. For example, an unexpectedly high level of rain in South could delay housing starts for the region. 18/08/09 12:30 Producer Price Index (PPI) mm 0.2%- 1.8%- Jul Country: US Source: Bureau of Labor statistics, U.S. Department of Labor. Raw Data Available At: http://stats.bls.gov/news.release/ppi.toc.htm Release Time: Around the 11th of each month at 8:30 ET for the prior month. The Producer Price Index measures prices of goods at the wholesale level. There are three broad subcategories within PPI: crude, intermediate, and finished. The market tracks the finished goods index most closely, as it represents prices for goods that are ready for sale to the end user. Goods prices at the crude and intermediate stages of production often provide an indication of coming (dis)inflationary pressures, but the closer you get to crude goods, the more that these prices track commodity prices which are already available in traded indexes such as the CRB (Commodity Research Bureau). At all stages of production, the market places more emphasis on the index excluding food and energy, referred to as the core rate. Food and energy prices tend to be quite volatile and obscure trends in the underlying inflation rate. Though the market reaction is determined by the month/month changes, year/year changes are also noted by analysts. The index is not revised on a monthly basis, but annual revisions to seasonal adjustment factors can produce small adjustments to past releases. 18/08/09 12:30 Core PPI mm 0.1% 0.5% Jul Country: US Source: Bureau of Labor statistics, U.S. Department of Labor. Raw Data Available At: http://stats.bls.gov/news.release/ppi.toc.htm Release Time: Around the 11th of each month at 8:30 ET for the prior month. The Producer Price Index measures prices of goods at the wholesale level. There are three broad subcategories within PPI: crude, intermediate, and finished. The market tracks the finished goods index most closely, as it represents prices for goods that are ready for sale to the end user. Goods prices at the crude and intermediate stages of production often provide an indication of coming (dis)inflationary pressures, but the closer you get to crude goods, the more that these prices track commodity prices which are already available in traded indexes such as the CRB (Commodity Research Bureau). At all stages of production, the market places more emphasis on the index excluding food and energy, referred to as the core rate. Food and energy prices tend to be quite volatile and obscure trends in the underlying inflation rate. Though the market reaction is determined by the month/month changes, year/year changes are also noted by analysts. The index is not revised on a monthly basis, but annual revisions to seasonal adjustment factors can produce small adjustments to past releases. 18/08/09 12:30 Core PPI yy 2.9% 3.3% Jul Country: US Source: Bureau of Labor statistics, U.S. Department of Labor. Raw Data Available At: http://stats.bls.gov/news.release/ppi.toc.htm Release Time: Around the 11th of each month at 8:30 ET for the prior month. The Producer Price Index measures prices of goods at the wholesale level. There are three broad subcategories within PPI: crude, intermediate, and finished. The market tracks the finished goods index most closely, as it represents prices for goods that are ready for sale to the end user. Goods prices at the crude and intermediate stages of production often provide an indication of coming (dis)inflationary pressures, but the closer you get to crude goods, the more that these prices track commodity prices which are already available in traded indexes such as the CRB (Commodity Research Bureau). At all stages of production, the market places more emphasis on the index excluding food and energy, referred to as the core rate. Food and energy prices tend to be quite volatile and obscure trends in the underlying inflation rate. Though the market reaction is determined by the month/month changes, year/year changes are also noted by analysts. The index is not revised on a monthly basis, but annual revisions to seasonal adjustment factors can produce small adjustments to past releases. 18/08/09 12:40 Consumer Price Index (CPI) mm 0.3%- 0.3% Jul Country: UK Source: Bureau of Labor statistics, U.S. Department of Labor. Raw Data Available At: http://stats.bls.gov/news.release/cpi.toc.htm Release Time: 8:30 ET, about the 13th of each month for the prior month. The Consumer Price Index is a measure of the price level of a fixed market basket of goods and services purchased by consumers. CPI is the most widely cited inflation indicator, and it is used to calculate cost of living adjustments for government programs and it is the basis of COLAs for many private labor agreements as well. It has been criticized for overstating inflation, because it does not adjust for substitution effects and because the fixed basket does not reflect price changes in new technology goods which are often declining in price. Despite these criticisms, it remains the benchmark inflation index. 19/08/09 06:00 Producer Price Index (PPI) mm 0.2%- 0.1%- Jul Country: Germany Source: Bureau of Labor statistics, U.S. Department of Labor. Raw Data Available At: http://stats.bls.gov/news.release/ppi.toc.htm Release Time: Around the 11th of each month at 8:30 ET for the prior month. The Producer Price Index measures prices of goods at the wholesale level. There are three broad subcategories within PPI: crude, intermediate, and finished. The market tracks the finished goods index most closely, as it represents prices for goods that are ready for sale to the end user. Goods prices at the crude and intermediate stages of production often provide an indication of coming (dis)inflationary pressures, but the closer you get to crude goods, the more that these prices track commodity prices which are already available in traded indexes such as the CRB (Commodity Research Bureau). At all stages of production, the market places more emphasis on the index excluding food and energy, referred to as the core rate. Food and energy prices tend to be quite volatile and obscure trends in the underlying inflation rate. Though the market reaction is determined by the month/month changes, year/year changes are also noted by analysts. The index is not revised on a monthly basis, but annual revisions to seasonal adjustment factors can produce small adjustments to past releases. 19/08/09 06:00 Producer Price Index (PPI) yy 6.5%- 4.6%- Jul Country: Germany Source: Bureau of Labor statistics, U.S. Department of Labor. Raw Data Available At: http://stats.bls.gov/news.release/ppi.toc.htm Release Time: Around the 11th of each month at 8:30 ET for the prior month. The Producer Price Index measures prices of goods at the wholesale level. There are three broad subcategories within PPI: crude, intermediate, and finished. The market tracks the finished goods index most closely, as it represents prices for goods that are ready for sale to the end user. Goods prices at the crude and intermediate stages of production often provide an indication of coming (dis)inflationary pressures, but the closer you get to crude goods, the more that these prices track commodity prices which are already available in traded indexes such as the CRB (Commodity Research Bureau). At all stages of production, the market places more emphasis on the index excluding food and energy, referred to as the core rate. Food and energy prices tend to be quite volatile and obscure trends in the underlying inflation rate. Though the market reaction is determined by the month/month changes, year/year changes are also noted by analysts. The index is not revised on a monthly basis, but annual revisions to seasonal adjustment factors can produce small adjustments to past releases. 19/08/09 08:00 Current Account 1.2b- Jun Country: EMU The most important part of international trade data. It is the broadest measure of sales and purchases of goods, services, interest payments. 19/08/09 08:00 Capital Flow 59.9b Jun Country: EMU The Capital Account records a nation's incoming and outgoing investment flows such as payments for entire or parts of companies (direct or portfolio investment), stocks, bonds, bank accounts, real estate and factories. The balance of payments is influenced by many factors, including the financial and economic climate of other countries. Short-term capital movements Short-term flows into liquid assets such as bank deposits and Treasury bills are easily reversed and are sometimes characterised as "hot money". Since flows can change direction at the drop of an interest rate, they can cause severe volatility in the currency markets. Long-term capital movements Long-term capital includes portfolio investment (stocks and shares) and direct investment (such as building a factory overseas). However, it is perhaps increasingly unrealistic to distinguish between investment in stocks and shares (long-term capital) and the acquisition of Treasury bills (short-term capital). An outflow today implies current-account income in the future. Indeed, with global deregulation, it is easier for companies to raise their market share by setting up production facilities overseas. The initial direct investment shows as a capital-account outflow. Subsequently remitted profits add to current-account inflows and boost GNP relative to GDP. The value of goods sold, however, does not show up in external trade or increase GDP in the way that exports from home would. 19/08/09 10:00 CBI Sales 59.9- Aug Country: UK Source: The Confederation of British Industry (CBI). Raw Data Available At: http://www.cbi.org.uk/home.html First introduced in 1983, this authoritative indicator of short-term trends in the UK retail and wholesale distribution sector carries significant weight in the formulation of economic policy at the Bank of England and within Government. Quarterly and monthly surveys Aimed at senior executives and sales managers and released on a monthly and quarterly basis, this quarterly survey tracks optimism, employment, prices, investment and stocks. The monthly issue provides a vital update on volume of sales, orders and stocks. A wealth of information This timely guide to retail and wholesale trade is published within seven days of its closing date and covers: 1. Total distribution 2. Retail, wholesale and motor trade activity 3. Employment 4. Type of outlet 5. Twenty-three individual sectors The importance of this survey's data is reflected in its regular supply to the European Commission's harmonised survey of retail trade. 19/08/09 11:00 Consumer Price Index (CPI) mm 0.3% Jul Country: Canada Source: Bureau of Labor statistics, U.S. Department of Labor. Raw Data Available At: http://stats.bls.gov/news.release/cpi.toc.htm Release Time: 8:30 ET, about the 13th of each month for the prior month. The Consumer Price Index is a measure of the price level of a fixed market basket of goods and services purchased by consumers. CPI is the most widely cited inflation indicator, and it is used to calculate cost of living adjustments for government programs and it is the basis of COLAs for many private labor agreements as well. It has been criticized for overstating inflation, because it does not adjust for substitution effects and because the fixed basket does not reflect price changes in new technology goods which are often declining in price. Despite these criticisms, it remains the benchmark inflation index. 19/08/09 11:00 Consumer Price Index (CPI) yy 0.3%- Jul Country: Canada Source: Bureau of Labor statistics, U.S. Department of Labor. Raw Data Available At: http://stats.bls.gov/news.release/cpi.toc.htm Release Time: 8:30 ET, about the 13th of each month for the prior month. The Consumer Price Index is a measure of the price level of a fixed market basket of goods and services purchased by consumers. CPI is the most widely cited inflation indicator, and it is used to calculate cost of living adjustments for government programs and it is the basis of COLAs for many private labor agreements as well. It has been criticized for overstating inflation, because it does not adjust for substitution effects and because the fixed basket does not reflect price changes in new technology goods which are often declining in price. Despite these criticisms, it remains the benchmark inflation index. 19/08/09 11:00 Leading Economic Indicators 0.1%- Jul Country: Canada Source: The Conference Board. Raw Data Available At: http://www.tcb-indicators.org/ Release Time: 8:30 ET around the third week of the month for the month prior. In Brief The Leading Indicators report is, for the most part, a compendium of previously announced economic indicators: new orders, jobless claims, money supply, average workweek, building permits, and stock prices. Therefore, the report is extremely predictable and of very little interest to the market. Though this series does have some predictive qualities, it is a common criticism that it has predicted "nine of the last six" recessions. The Commerce Department previously published the leading indicators series. The collection and publishing of these data is now done by the non-profit Conference Board, which also produces the Consumer Confidence index. In Depth Purpose The purpose of the leading index is straightforward: It is designed to signal turning points in the business cycle. Composition The index of leading indicators includes the ten economic statistics listed below. 1. The interest rate spread between 10-year Treasury notes and the federal funds rate. 2. The inflation-adjusted, M2 measure of the money supply. 3. The average manufacturing workweek. 4. Manufacturers' new orders for consumer goods and materials. 5. The S&P 500 measure of stock prices. 6. The vendor performance component of the NAPM index. 7. The average level of weekly initial claims for unemployment insurance. 8. Building permits. 9. The University of Michigan index of consumer expectations. 10. Manufacturers' new orders for nondefense capital goods. The Conference Board, the organization that produces the leading index, standardizes these variables according to their individual weights in order to construct a composite leading index. Note that we have listed the components in order of importance. The difference between 10-year Treasuries and the fed funds rate carries the most weight; historically, this approximation of the slope of the yield curve has proven relatively more successful than other components at predicting future economic activity. Along those same lines, orders for nondefense capital goods carry the smallest weight because they have typically proven relatively poorer at pointing to changes in the direction of economic growth at large. Performance The leading index receives plenty of criticism. Indeed, skeptics often joke that it has correctly signalled nine of the last six recessions. Meanwhile, in its literature, The Conference Board cites the lead times with which the leading index has correctly predicted economic downturns. It is thus fair to ask whether the leading index is useless or priceless. The answer lies somewhere in between. The charge that the index predicts recessions that do not come to fruition--and fails to warn of those that do--is hardly a fair criticism. No forecaster, even armed with an arsenal of economic statistics, has a perfect track record when it comes to predicting recessions. It is therefore unreasonable to assume that a ten-component index can do any better. That said, the index does have some reliability problems. For example, it failed to turn down prior to the 1990-91 recession, and in 1995 it signalled a downturn that never came to pass. Usefulness The leading index is more useful now that The Conference Board has taken control of it (the Department of Commerce stopped producing it at the end of 1996). Conference Board researchers quickly scrapped two of the old components--the change in sensitive materials prices and unfilled orders for durable goods--and added the interest-rate spread that appears in our list above. The index now lacks a wholesale price term, which some see as critical to determining future demand and inflation trends, but on net the new index emits less pronounced false signals and does a better job than it used to. Briefing finds the leading index most helpful when we can make a statement like this: The leading index has decreased only once during the past year. Of course, even a strong trend like that does not guarantee that a recession will not form over the coming six to nine months. But we can get additional help from looking at the leading index with the coincident index, which is also published by The Conference Board, and alongside a couple of other leading indices published by Columbia University. Indeed, there exists much research that deals with the criteria for determining recession warnings (i.e., the leading index must fall during four of seven months and the coincident index must fall for three straight months). 20/08/09 06:15 International Trade Balance mm 1571.7 Jul Country: Switzerland Source: The Census Bureau and the Bureau of Economic Analysis of the Department of Commerce. Raw Data Available At: http://www.census.gov/foreign-trade/www/press.html Release Time: 8:30 ET around the 20th of the month (data for two months prior). The trade report is most widely watched for trends in the overall trade balance. But trends in both exports and imports of goods and services bear watching as well. The export data in particular are important to watch for indications that a strengthening competitive position at home and/or strengthening economies overseas are boosting U.S. growth. Imports provide an indication of domestic demand, but given the severe lag of this report relative to other consumption indicators, it is not particularly valuable for this purpose. The volatility in the monthly trade balance can play an important role in GDP forecasts. Net exports are a relatively volatile component of GDP, and the trade report provides the only early clues to the net export performance each quarter. 20/08/09 08:30 Retail Sales mm 0.4% 1.2% Jul Country: UK Source: The Census Bureau of the Department of Commerce. Raw Data Available At: http://www.census.gov/svsd/www/advtable.html Release Time: 8:30 ET around the 13th of the month (data for one month prior). The retail sales report is a measure of the total receipts of retail stores. The changes in retail sales are widely followed as the most timely indicator of broad consumer spending patterns. Retail sales are often viewed ex-autos, as auto sales can move sharply from month-to-month. It is also important to keep an eye on the gas and food components, where changes in sales are often a result of price changes rather than shifting consumer demand. Retail sales can be quite volatile and the advance reports are subject to rather large revisions. Retail sales do not include spending on services, which makes up over half of total consumption. Total personal consumption is not available until the personal income and consumption reports are released, typically two weeks after retail sales. 20/08/09 08:30 Retail Sales yy 2.7% 2.9% Jul Country: UK Source: The Census Bureau of the Department of Commerce. Raw Data Available At: http://www.census.gov/svsd/www/advtable.html Release Time: 8:30 ET around the 13th of the month (data for one month prior). The retail sales report is a measure of the total receipts of retail stores. The changes in retail sales are widely followed as the most timely indicator of broad consumer spending patterns. Retail sales are often viewed ex-autos, as auto sales can move sharply from month-to-month. It is also important to keep an eye on the gas and food components, where changes in sales are often a result of price changes rather than shifting consumer demand. Retail sales can be quite volatile and the advance reports are subject to rather large revisions. Retail sales do not include spending on services, which makes up over half of total consumption. Total personal consumption is not available until the personal income and consumption reports are released, typically two weeks after retail sales. 20/08/09 09:00 ZEW Economic Sentiment 0.0 Aug Country: Switzerland Source: ZEW - The Centre for European Economic Research. Raw Data Available At: http://www.zew.de/ The ZEW (Zentrum für Europäische Wirtschaftsforschung - Centre for European Economic Research) is a non-profit economic research institute with the legal form of a limited liability company (GmbH). It was founded in 1990 on the initiative of the government of the federal state Baden-Württemberg, trade and industry, and the Mannheim University. In April 1991 the institute took up work and has expanded rapidly since then. The ZEW Index measures investors' expectations of economic growth. The ZEW index has a good reputation of anticipating the results of the broader IFO index that is widely regarded as an important leading indicator of the economy. The IFO index is available later in each month. 20/08/09 12:30 Initial Jobless Claims 558.0k L/W Country: US Source: The Employment and Training Administration of the Department of Labor. Raw Data Available At: http://www.dol.gov/opa/media/press/eta/main.htm Release Time: 8:30 ET each Thursday (data for week ended prior Saturday). This survey measures the attitudes and expectations concerning both present and future economic conditions of 500 consumers. The Michigan index is almost identical to the Conference Board Consumer Confidence index, though there are two monthly releases, a preliminary and final reading. Like the Conference Board index, it has two subindexes - expectations and current conditions. The expectations index is a component of the Conference Board's Leading Indicators index. 20/08/09 12:30 Initial Jobless Claims 6.202m L/W Country: US Source: The Employment and Training Administration of the Department of Labor. Raw Data Available At: http://www.dol.gov/opa/media/press/eta/main.htm Release Time: 8:30 ET each Thursday (data for week ended prior Saturday). This survey measures the attitudes and expectations concerning both present and future economic conditions of 500 consumers. The Michigan index is almost identical to the Conference Board Consumer Confidence index, though there are two monthly releases, a preliminary and final reading. Like the Conference Board index, it has two subindexes - expectations and current conditions. The expectations index is a component of the Conference Board's Leading Indicators index. 20/08/09 12:30 Wholesale Trade 0.3%- Jun Country: Canada Source: The Census Bureau of the Department of Commerce. Raw Data Available At: http://www.census.gov/svsd/www/mwts.html Release Time: 10:00 ET around the fifth business day of the month (data for two months prior). The wholesale trade report includes sales and inventory statistics from the second stage of the manufacturing process. The sales figures say close to nothing about personal consumption and therefore do not move the market. Wholesale inventories sometimes swing enough to change the aggregate inventory profile (aggregate inventory is the sum of inventory at the manufacturing, wholesale, and retail levels), which may affect the GDP outlook. In that event they can elicit a small market reaction. More often than not, however, this release goes unnoticed except by market economists. 21/08/09 07:30 Services PMI 48.8 48.1 Aug Country: Germany Source: Institute for Supply Management. Raw Data Available At: http://www.ism.ws/ISMReport/index.cfm Release Time: 10:00 ET on the first business day of the month for the prior month. ISM: Institute for Supply Management formerly NAPM: National Association of Purchasing Managers In Brief The ISM report is a national survey of purchasing managers which covers such indicators as new orders, production, employment, inventories, delivery times, prices, export orders, and import orders. Diffusion indexes are produced for each of these categories, with a reading over 50% indicating expansion relative to the prior month, and a sub-50% reading indicating contraction. The total index is calculated based on a weighted average of the following five sub-indexes, with weights in parentheses: new orders (30%), production (25%), employment (20%), deliveries (15%), and inventories (10%). The ISM is one of the first comprehensive economic releases of the month, typically preceding the employment report. Though it covers only the manufacturing sector, it can often provide accurate hints regarding the tone of subsequent releases. During periods of inflation concerns, the prices paid and vendor deliveries indexes often determine the bond market's reaction to the report. In Depth The Institute for Supply Management's monthly Report on Business is probably the most widely watched economic indicator produced by the private sector. There are two key reasons for the ISM's prominence. First, its longevity - the report was first produced in 1931, and after a break during World War II, it has produced continuously since 1948. Second , its leading quality - the ISM has been one of the better predictors of the business cycle over the years. More than 370 purchasing and supply management professionals in the non- manufacturing sector participate in the survey by completing a monthly questionnaire covering Business Activity, New Orders, Backlog of Orders, New Export Orders, Inventory Change, Inventory Sentiment, Imports, Prices, Employment, and Supplier Deliveries. The respondents are from more than 60 different sectors representing nine divisions from the Standard Industrial Code classification system including Agriculture, Forestry, & Fisheries; Mining; Construction; Transportation, Communications, Electric, Gas, and Sanitary Services; Wholesale Trade; Retail Trade; Finance, Insurance & Real Estate; Services; and Public Administration. Geographic location is also a consideration The results of the responses are compiled in the Non-Manufacturing NAPM Report on Business®by Ralph G. Kauffman, Ph.D., C.P.M, chair of the Non- Manufacturing Business Survey Committee. Following the initial release, this new report will be issued on the third business day of each month at 10:00 a.m. eastern Time via Business Wire and Xpedite Broadcast Fax. The National Association of Purchasing Management is a not-for-profit association that provides national and international leadership in purchasing and supply management research and education. NAPM provides its more than 44,000 members in its 180 affiliated associations with opportunities to expand their professional skills and knowledge. 21/08/09 07:30 Manufacturing PMI 47.0 45.7 Aug Country: Germany Source: Institute for Supply Management. Raw Data Available At: http://www.ism.ws/ISMReport/index.cfm Release Time: 10:00 ET on the first business day of the month for the prior month. ISM: Institute for Supply Management formerly NAPM: National Association of Purchasing Managers In Brief The ISM report is a national survey of purchasing managers which covers such indicators as new orders, production, employment, inventories, delivery times, prices, export orders, and import orders. Diffusion indexes are produced for each of these categories, with a reading over 50% indicating expansion relative to the prior month, and a sub-50% reading indicating contraction. The total index is calculated based on a weighted average of the following five sub-indexes, with weights in parentheses: new orders (30%), production (25%), employment (20%), deliveries (15%), and inventories (10%). The ISM is one of the first comprehensive economic releases of the month, typically preceding the employment report. Though it covers only the manufacturing sector, it can often provide accurate hints regarding the tone of subsequent releases. During periods of inflation concerns, the prices paid and vendor deliveries indexes often determine the bond market's reaction to the report. In Depth The Institute for Supply Management's monthly Report on Business is probably the most widely watched economic indicator produced by the private sector. There are two key reasons for the ISM's prominence. First, its longevity - the report was first produced in 1931, and after a break during World War II, it has produced continuously since 1948. Second , its leading quality - the ISM has been one of the better predictors of the business cycle over the years. Who and What It Surveys The ISM index is the result of a monthly survey of over 400 companies in 20 industries throughout the 50 states. The survey queries respondents on a number of monthly indicators, including orders, production, employment, inventories, delivery times, prices paid, export orders, and import orders. Respondents are asked to characterize each indicator as higher, lower, or unchanged for the month (or faster/slower in the case of delivery times). They are not asked for specific numbers - only a thumbs up or down. Presenting the Numbers Based on these responses, the ISM calculates diffusion indexes for each of the components. These diffusion indexes are calculated by adding half of the percentage of respondents answering "unchanged" to the percentage answering "higher" (or "slower" for deliveries). These diffusion indexes do not yield estimates of specific magnitudes of strength or weakness, but the more respondents who are indicating trends in the same direction - the better the chance that the magnitude of that move is larger. A diffusion index of 50% is the theoretical breakeven mark - with readings above indicating strength and below indicating weakness. The ISM only provides the raw data - the Department of Commerce produces the seasonal factors which are used to provide more meaningful, seasonally adjusted indexes. The total index is not the result of a separate question regarding general business conditions (as is the case with the Philadelphia Fed index). Instead, the index is calculated using the weighted sum of five of the subindexes. Orders account for 30% of the total; production - 25%; employment - 20%; deliveries - 15%; inventories - 10%. Prices, export orders, and import orders are not part of the total index. Breakevens in Theory and Practice Though 50% is the breakeven mark in theory, different readings have proved to be breakeven in practice. For new orders, 50.3% is the level consistent with breakeven readings in factory orders. For production, 49.4% has been the breakeven mark in theory and practice. For employment, 47.5% has been consistent with a steady level of manufacturing employment. For inventories, 41.3% has been consistent with steady business inventory readings. And finally, the 42.7% mark on the total index marks the point below which the overall economy is believed to be in recession. Between 42.7-50%, the manufacturing sector may be in decline, but the total economy is only seeing slower growth. No Services This observation highlights the important element which is missing from the ISM index - the service sector. With the manufacturing sector making up an ever-shrinking percentage of the total economy - the ISM might seem to be an indicator in decline. Not so, however - the manufacturing sector, while shrinking in relative terms, still tends to lead the total economy into and out of recessions. The ISM therefore remains a closely watched indicator despite its manufacturing focus. A Proven Performer The ISM's leading quality has been proven over time. Its bottom during a recession has preceded the turning point for the business cycle by an average of four months, and its worst performance in leading the turning point was on two occasions when the ISM trough occurred in the same month as the business cycle trough. The ISM index is released on the first business day of each at 10:00 ET, with data for the prior calendar month. 21/08/09 07:30 Services PMI 46.5 45.7 Aug Country: EMU Source: Institute for Supply Management. Raw Data Available At: http://www.ism.ws/ISMReport/index.cfm Release Time: 10:00 ET on the first business day of the month for the prior month. ISM: Institute for Supply Management formerly NAPM: National Association of Purchasing Managers In Brief The ISM report is a national survey of purchasing managers which covers such indicators as new orders, production, employment, inventories, delivery times, prices, export orders, and import orders. Diffusion indexes are produced for each of these categories, with a reading over 50% indicating expansion relative to the prior month, and a sub-50% reading indicating contraction. The total index is calculated based on a weighted average of the following five sub-indexes, with weights in parentheses: new orders (30%), production (25%), employment (20%), deliveries (15%), and inventories (10%). The ISM is one of the first comprehensive economic releases of the month, typically preceding the employment report. Though it covers only the manufacturing sector, it can often provide accurate hints regarding the tone of subsequent releases. During periods of inflation concerns, the prices paid and vendor deliveries indexes often determine the bond market's reaction to the report. In Depth The Institute for Supply Management's monthly Report on Business is probably the most widely watched economic indicator produced by the private sector. There are two key reasons for the ISM's prominence. First, its longevity - the report was first produced in 1931, and after a break during World War II, it has produced continuously since 1948. Second , its leading quality - the ISM has been one of the better predictors of the business cycle over the years. More than 370 purchasing and supply management professionals in the non- manufacturing sector participate in the survey by completing a monthly questionnaire covering Business Activity, New Orders, Backlog of Orders, New Export Orders, Inventory Change, Inventory Sentiment, Imports, Prices, Employment, and Supplier Deliveries. The respondents are from more than 60 different sectors representing nine divisions from the Standard Industrial Code classification system including Agriculture, Forestry, & Fisheries; Mining; Construction; Transportation, Communications, Electric, Gas, and Sanitary Services; Wholesale Trade; Retail Trade; Finance, Insurance & Real Estate; Services; and Public Administration. Geographic location is also a consideration The results of the responses are compiled in the Non-Manufacturing NAPM Report on Business®by Ralph G. Kauffman, Ph.D., C.P.M, chair of the Non- Manufacturing Business Survey Committee. Following the initial release, this new report will be issued on the third business day of each month at 10:00 a.m. eastern Time via Business Wire and Xpedite Broadcast Fax. The National Association of Purchasing Management is a not-for-profit association that provides national and international leadership in purchasing and supply management research and education. NAPM provides its more than 44,000 members in its 180 affiliated associations with opportunities to expand their professional skills and knowledge. 21/08/09 07:30 Manufacturing PMI 47.5 46.3 Aug Country: EMU Source: Institute for Supply Management. Raw Data Available At: http://www.ism.ws/ISMReport/index.cfm Release Time: 10:00 ET on the first business day of the month for the prior month. ISM: Institute for Supply Management formerly NAPM: National Association of Purchasing Managers In Brief The ISM report is a national survey of purchasing managers which covers such indicators as new orders, production, employment, inventories, delivery times, prices, export orders, and import orders. Diffusion indexes are produced for each of these categories, with a reading over 50% indicating expansion relative to the prior month, and a sub-50% reading indicating contraction. The total index is calculated based on a weighted average of the following five sub-indexes, with weights in parentheses: new orders (30%), production (25%), employment (20%), deliveries (15%), and inventories (10%). The ISM is one of the first comprehensive economic releases of the month, typically preceding the employment report. Though it covers only the manufacturing sector, it can often provide accurate hints regarding the tone of subsequent releases. During periods of inflation concerns, the prices paid and vendor deliveries indexes often determine the bond market's reaction to the report. In Depth The Institute for Supply Management's monthly Report on Business is probably the most widely watched economic indicator produced by the private sector. There are two key reasons for the ISM's prominence. First, its longevity - the report was first produced in 1931, and after a break during World War II, it has produced continuously since 1948. Second , its leading quality - the ISM has been one of the better predictors of the business cycle over the years. Who and What It Surveys The ISM index is the result of a monthly survey of over 400 companies in 20 industries throughout the 50 states. The survey queries respondents on a number of monthly indicators, including orders, production, employment, inventories, delivery times, prices paid, export orders, and import orders. Respondents are asked to characterize each indicator as higher, lower, or unchanged for the month (or faster/slower in the case of delivery times). They are not asked for specific numbers - only a thumbs up or down. Presenting the Numbers Based on these responses, the ISM calculates diffusion indexes for each of the components. These diffusion indexes are calculated by adding half of the percentage of respondents answering "unchanged" to the percentage answering "higher" (or "slower" for deliveries). These diffusion indexes do not yield estimates of specific magnitudes of strength or weakness, but the more respondents who are indicating trends in the same direction - the better the chance that the magnitude of that move is larger. A diffusion index of 50% is the theoretical breakeven mark - with readings above indicating strength and below indicating weakness. The ISM only provides the raw data - the Department of Commerce produces the seasonal factors which are used to provide more meaningful, seasonally adjusted indexes. The total index is not the result of a separate question regarding general business conditions (as is the case with the Philadelphia Fed index). Instead, the index is calculated using the weighted sum of five of the subindexes. Orders account for 30% of the total; production - 25%; employment - 20%; deliveries - 15%; inventories - 10%. Prices, export orders, and import orders are not part of the total index. Breakevens in Theory and Practice Though 50% is the breakeven mark in theory, different readings have proved to be breakeven in practice. For new orders, 50.3% is the level consistent with breakeven readings in factory orders. For production, 49.4% has been the breakeven mark in theory and practice. For employment, 47.5% has been consistent with a steady level of manufacturing employment. For inventories, 41.3% has been consistent with steady business inventory readings. And finally, the 42.7% mark on the total index marks the point below which the overall economy is believed to be in recession. Between 42.7-50%, the manufacturing sector may be in decline, but the total economy is only seeing slower growth. No Services This observation highlights the important element which is missing from the ISM index - the service sector. With the manufacturing sector making up an ever-shrinking percentage of the total economy - the ISM might seem to be an indicator in decline. Not so, however - the manufacturing sector, while shrinking in relative terms, still tends to lead the total economy into and out of recessions. The ISM therefore remains a closely watched indicator despite its manufacturing focus. A Proven Performer The ISM's leading quality has been proven over time. Its bottom during a recession has preceded the turning point for the business cycle by an average of four months, and its worst performance in leading the turning point was on two occasions when the ISM trough occurred in the same month as the business cycle trough. The ISM index is released on the first business day of each at 10:00 ET, with data for the prior calendar month. 21/08/09 14:00 Existing Home Sales (Units) 4.99M 4.89M Jul Country: US Source: The National Association of Realtors. Raw Data Available At: (USA): http://www.realtor.org/research.nsf/pages/EHSdata Release Time: 10:00 ET around the 25th of the month (data for month prior). The name speaks for itself - this report provides a measure of the level of sales of existing home sales. The report is considered a decent indicator of activity in the housing sector. Housing starts precede this report each month, but starts are a supply rather than demand-side indicator. Existing home sales precede the other key demand-side indicator of housing - new home sales - thus boosting the visibility of this report. Sales are highly dependent on mortgage rates, and will tend to react with a few months lag to changes in rates. Sales are also determined by the level of pent-up demand for housing - immediately after a recession, sales are typically quite strong due to the demand which accumulated through the recession. The survey sample for existing home sales is larger than that of new home sales, making it somewhat less susceptible to large revisions. Both reports can see huge month-to-month swings in winter, when bad weather can significantly affect sales. Aside from total sales, two other indicators are worth watching in this report -- the inventory of homes for sale and the median price. The inventory of homes for sale at the current sales pace is the inventory/sales ratio of the housing sector. For example, a 5.0 figure for inventory/sales indicates that the supply of homes for sale would be depleted within five months at the current sales pace. The lower this figure goes, the greater the need for new housing starts. The year/year change in the median price provides a good indication of inflation in home prices. Results for the week of: 09/08/09 - 14/08/09 9 August 2009 - 14 August 2009 Timezone GMT (Greenwich Mean Time) Date Time Importance Event Actual Forecast Previous Period 09/08/09 23:50 Machinery Orders mm 9.7% 2.9% -3.0% Jun Country: Japan The Japanese equivalent to Durable Goods Orders. 11/08/09 Interest Rate Decision 0.1% Aug Country: Japan Source (U.S.): The Federal Reserve Open Market Committee - FOMC. Source (World): The Central Bank Monetary Policy Committee - MPC. The Federal Open Market Committee is a twelve-member committee made up of the seven members of the Board of Governors and five Federal Reserve Bank presidents. It meets eight times per year to determine the near-term direction of monetary policy, such as setting guidelines for the purchase and sale of government securities and setting policy relating to System operations in the foreign exchange markets. These changes in monetary policy are now announced immediately after FOMC meetings. Most importantly, the Fed determines interest rate policy at FOMC meetings. Market participants speculate about the possibility of an interest rate change at these meetings, and if the outcome is different from expectations, the impact on the markets can be dramatic and far-reaching. The interest rate set by the Fed the federal funds rate serves as a benchmark for all other rates. A change in the fed funds rate, the lending rate banks charge each other for the use of overnight funds, translates directly through to all other interest rates from Treasury bonds to mortgage loans. It also changes the dynamics of competition for investor dollars: when bonds yield 10 percent, they will attract more money away from stocks then when they only yield 5 percent. The level of interest rates affects the economy­ higher rates tend to slow activity; lower rates stimulate activity, a ripple effect that expands into all sectors of the economy. 11/08/09 05:00 Consumer Confidence 37.6 Jul Country: Japan Source: The Conference Board. Raw Data Available At: http://www.tcb-indicators.org/ Release Time: 10:00 ET on the last Tuesday of the month (data for current month). This survey measures the level of confidence individual households have in the performance of the economy now and in the future. It is a leading indicator of future spending and the business cycle. 5000 consumers in the nine census divisions across the country are surveyed each month. The level of consumer confidence is directly correlated to the strength of consumer spending, which accounts for two-thirds of the economy. It also correlates closely with joblessness, inflation, and real incomes. The report can occasionally be helpful in predicting sudden shifts in consumption patterns, though most small changes in the index are just noise. Only index changes of at least five points should be considered significant. The index consists of two subindexes - consumers' appraisal of current conditions and their expectations for the future. Expectations make up 60% of the total index, with current conditions accounting for the other 40%. The expectations index is typically seen as having better leading indicator qualities than the current conditions index. The more confident consumers are about the economy and their own personal finances, the more likely they are to spend. Note, changes in consumer confidence and retail sales do not move in tandem month by month. If the economy experiences a long-term expansion, buying intentions may decline even while the jobless rate declines because of the satisfaction of pent-up demand. Conversely, if inflation begins to accelerate, spending plans may increase for the short-term as consumers buy now to avoid having to pay higher prices later. Regional differences in consumer confidence are an indication of differing business cycles across the nation. This has implications for spending on durable goods and, more importantly, for residential real estate markets. Financial markets interpret rising consumer confidence as a precursor to higher consumer spending. Higher consumer spending could in turn spark inflation. Look for a change in the direction of the six month moving average of the index. Consumers do not usually have the necessary information to accurately assess income and job growth six months in the future. The report provides information on planned spending, which does not necessarily turn into actual spending, although it is unlikely that increasing consumer confidence would be followed by a decline in spending. The Consumer Confidence survey is not useful for any type of forecasting. 11/08/09 05:00 Consumer Price Index (CPI) yy -0.6% 0.1% Jul Country: Germany Source: Bureau of Labor statistics, U.S. Department of Labor. Raw Data Available At: http://stats.bls.gov/news.release/cpi.toc.htm Release Time: 8:30 ET, about the 13th of each month for the prior month. The Consumer Price Index is a measure of the price level of a fixed market basket of goods and services purchased by consumers. CPI is the most widely cited inflation indicator, and it is used to calculate cost of living adjustments for government programs and it is the basis of COLAs for many private labor agreements as well. It has been criticized for overstating inflation, because it does not adjust for substitution effects and because the fixed basket does not reflect price changes in new technology goods which are often declining in price. Despite these criticisms, it remains the benchmark inflation index. 11/08/09 06:00 Consumer Price Index (CPI) mm -0.1% 0.4% Jul Country: Germany Source: Bureau of Labor statistics, U.S. Department of Labor. Raw Data Available At: http://stats.bls.gov/news.release/cpi.toc.htm Release Time: 8:30 ET, about the 13th of each month for the prior month. The Consumer Price Index is a measure of the price level of a fixed market basket of goods and services purchased by consumers. CPI is the most widely cited inflation indicator, and it is used to calculate cost of living adjustments for government programs and it is the basis of COLAs for many private labor agreements as well. It has been criticized for overstating inflation, because it does not adjust for substitution effects and because the fixed basket does not reflect price changes in new technology goods which are often declining in price. Despite these criticisms, it remains the benchmark inflation index. 11/08/09 06:00 Harm. Index of Consumer Prices mm 0.0% 0.4% Jul Country: Germany Source: EU Eurostat. Raw Data Available At: ttp://europa.eu.int/comm/eurostat/ HICP is the inflation indicator used by the European Central Bank: The method for calculating the CPI varies in different countries and can cause problems for international comparisons. To address this problem, a harmonized index of consumer prices (HICP) have been developed within EU, based on coordinated methodology. HICP is a fundamental indicator for the European Central Bank (ECB) in evaluating EMU's monetary policy goals. HICP is also used to follow up the convergence criteria for price stability with regards to membership in EMU. 1996 is the base year and the index is calculated starting in 1995. Certain entries that are currently treated particularly differently in the calculation of national CPIs have been excluded. One particular difference compared with the CPI is that interest costs for owner-occupied homes are not included in the HICP. In addition, certain costs of owner-occupied homes (repairs, real-estate taxes, write-offs, insurance and ground rents), fees for tenant-owned flats, as well as lotteries, pools and tote betting are excluded. Some entries are included in the HICP but not in the CPI. These include childcare, elder care, hospital care and certain financial services (services where the fee is proportional to the size of the transaction). HICP is based on a completely harmonized product classification, COICOP (Classification Of Individual Consumption by Purpose). Harmonized rules for coverage, consideration of new products, updating the product sample, adjustments for changes in quality, and index formulas for the calculations are also used in calculating the HICP. The methods for calculating the index numbers and price changes for the HICP differ to a certain extent from the CPI. Similar to the CPI, the HICP is a chained index with yearly links but a long-term index is not calculated. Instead, yearly links in the HICP are calculated in the same way as the CPI's short-term index. 11/08/09 06:00 Harm. Index of Consumer Prices yy -0.6% 0.0% Jul Country: Germany Source: EU Eurostat. Raw Data Available At: ttp://europa.eu.int/comm/eurostat/ HICP is the inflation indicator used by the European Central Bank: The method for calculating the CPI varies in different countries and can cause problems for international comparisons. To address this problem, a harmonized index of consumer prices (HICP) have been developed within EU, based on coordinated methodology. HICP is a fundamental indicator for the European Central Bank (ECB) in evaluating EMU's monetary policy goals. HICP is also used to follow up the convergence criteria for price stability with regards to membership in EMU. 1996 is the base year and the index is calculated starting in 1995. Certain entries that are currently treated particularly differently in the calculation of national CPIs have been excluded. One particular difference compared with the CPI is that interest costs for owner-occupied homes are not included in the HICP. In addition, certain costs of owner-occupied homes (repairs, real-estate taxes, write-offs, insurance and ground rents), fees for tenant-owned flats, as well as lotteries, pools and tote betting are excluded. Some entries are included in the HICP but not in the CPI. These include childcare, elder care, hospital care and certain financial services (services where the fee is proportional to the size of the transaction). HICP is based on a completely harmonized product classification, COICOP (Classification Of Individual Consumption by Purpose). Harmonized rules for coverage, consideration of new products, updating the product sample, adjustments for changes in quality, and index formulas for the calculations are also used in calculating the HICP. The methods for calculating the index numbers and price changes for the HICP differ to a certain extent from the CPI. Similar to the CPI, the HICP is a chained index with yearly links but a long-term index is not calculated. Instead, yearly links in the HICP are calculated in the same way as the CPI's short-term index. 11/08/09 06:00 Wholesale Price Index (WPI) mm 0.9% Jul Country: Germany Purpose and use The Wholesale Price Index (WPI) focuses on the prices of goods traded among corporations. The main purpose of the index is to investigate price movements that sensitively reflect the supply and demand condition of individual goods, with the view to facilitating the analysis of both macro- and micro- economic conditions. The indexes of less aggregated levels also have a role as a "deflator" that transforms nominal output values into real quantities. It follows from these characteristics of the index that gross transaction values of individual goods, if available, would be the most suitable data for its weight calculation. Unfortunately, such statistics are not regularly available, and hence, WPI has relied instead upon regularly published data such as manufacturer's shipments and custom clearance since its adaptation of weighted averages in 1933. Structure The WPI is composed of the Domestic Wholesale Price Index (DWPI), the Export Price Index (EPI), the Import Price Index (IPI), and the Overall Wholesale Price Index (OWPI). The first three indexes cover different types of products as indicated below, while the OWPI is a weighted average of these three indexes. Publication The WPI is released on a paper basis and through the BOJ website (http://www.boj.or.jp/en/index.htm) according to the following schedule: Ten-day index On the fifth working day of the following ten-day period, in principle. Monthly index On the sixth working day of the following month, in principle. Annual average index (calendar or fiscal year) The day when the index of the last month of the year (December or March) is released, in principle. 11/08/09 06:00 Wholesale Price Index (WPI) yy -8.8% Jul Country: Germany Purpose and use The Wholesale Price Index (WPI) focuses on the prices of goods traded among corporations. The main purpose of the index is to investigate price movements that sensitively reflect the supply and demand condition of individual goods, with the view to facilitating the analysis of both macro- and micro- economic conditions. The indexes of less aggregated levels also have a role as a "deflator" that transforms nominal output values into real quantities. It follows from these characteristics of the index that gross transaction values of individual goods, if available, would be the most suitable data for its weight calculation. Unfortunately, such statistics are not regularly available, and hence, WPI has relied instead upon regularly published data such as manufacturer's shipments and custom clearance since its adaptation of weighted averages in 1933. Structure The WPI is composed of the Domestic Wholesale Price Index (DWPI), the Export Price Index (EPI), the Import Price Index (IPI), and the Overall Wholesale Price Index (OWPI). The first three indexes cover different types of products as indicated below, while the OWPI is a weighted average of these three indexes. Publication The WPI is released on a paper basis and through the BOJ website (http://www.boj.or.jp/en/index.htm) according to the following schedule: Ten-day index On the fifth working day of the following ten-day period, in principle. Monthly index On the sixth working day of the following month, in principle. Annual average index (calendar or fiscal year) The day when the index of the last month of the year (December or March) is released, in principle. 11/08/09 08:30 International Trade Balance mm -6.1b -6.263 Jun Country: UK Source: The Census Bureau and the Bureau of Economic Analysis of the Department of Commerce. Raw Data Available At: http://www.census.gov/foreign-trade/www/press.html Release Time: 8:30 ET around the 20th of the month (data for two months prior). The trade report is most widely watched for trends in the overall trade balance. But trends in both exports and imports of goods and services bear watching as well. The export data in particular are important to watch for indications that a strengthening competitive position at home and/or strengthening economies overseas are boosting U.S. growth. Imports provide an indication of domestic demand, but given the severe lag of this report relative to other consumption indicators, it is not particularly valuable for this purpose. The volatility in the monthly trade balance can play an important role in GDP forecasts. Net exports are a relatively volatile component of GDP, and the trade report provides the only early clues to the net export performance each quarter. 11/08/09 12:15 Housing Starts yy 140.7k Jul Country: Canada Source: The Census Bureau of the Department of Commerce. Raw Data Available At: http://www.census.gov/const/www/newresconstindex.html Release Time: 8:30 ET around the 16th of the month (data for one month prior). Housing Starts are a measure of the number of residential units on which construction is begun each month. A start in construction is defined as the beginning of excavation of the foundation for the building and is comprised primarily of residential housing. Building permits are permits taken out in order to allow excavation. An increase in building permits and starts usually occurs a few months after a reduction in mortgage rates. Permits lead starts, but permits are not required in all regions of the country, and the level of permits therefore tends to be less than the level of starts over time. The monthly national report is broken down by region: Northeast, Midwest, South, and West. Briefing recommends analyzing the regional data because they are subject to a high degree of volatility. The high volatility can be attributed to weather changes and/or natural disasters. For example, an unexpectedly high level of rain in South could delay housing starts for the region. 11/08/09 12:30 Productivity and Costs 3.7% 1.6% Q2 Country: US Source: The Bureau of Labor Statistics of the Department of Labor. Raw Data Available At: http://stats.bls.gov/news.release/prod2.toc.htm Release Time: 8:30 ET around the 7th of the second month of the quarter (data for quarter prior). Nonfarm productivity and costs provide measures of the productivity of workers and the costs associated with producing a unit of output. During times of inflationary concern, the unit labor cost index in this report can move the market. If productivity is falling, unit labor costs may be rising faster than hourly earnings and other labor cost measures. Because productivity can be quite volatile from one quarter to the next and because the previously released GDP report will give a good indication of productivity growth, this report seldom has a significant impact on the market. In addition to the preliminary report, a revision to the productivity data is released in the third month of each quarter. As with the preliminary report, the GDP data released prior to the productivity data provide a clear indication of the direction of the productivity revision. 11/08/09 14:00 IBD Consumer Sentiment 46.3 Aug Country: US Source: The Conference Board. Raw Data Available At: http://www.tcb-indicators.org/ Release Time: 10:00 ET on the last Tuesday of the month (data for current month). This survey measures the level of confidence individual households have in the performance of the economy now and in the future. It is a leading indicator of future spending and the business cycle. 5000 consumers in the nine census divisions across the country are surveyed each month. The level of consumer confidence is directly correlated to the strength of consumer spending, which accounts for two-thirds of the economy. It also correlates closely with joblessness, inflation, and real incomes. The report can occasionally be helpful in predicting sudden shifts in consumption patterns, though most small changes in the index are just noise. Only index changes of at least five points should be considered significant. The index consists of two subindexes - consumers' appraisal of current conditions and their expectations for the future. Expectations make up 60% of the total index, with current conditions accounting for the other 40%. The expectations index is typically seen as having better leading indicator qualities than the current conditions index. The more confident consumers are about the economy and their own personal finances, the more likely they are to spend. Note, changes in consumer confidence and retail sales do not move in tandem month by month. If the economy experiences a long-term expansion, buying intentions may decline even while the jobless rate declines because of the satisfaction of pent-up demand. Conversely, if inflation begins to accelerate, spending plans may increase for the short-term as consumers buy now to avoid having to pay higher prices later. Regional differences in consumer confidence are an indication of differing business cycles across the nation. This has implications for spending on durable goods and, more importantly, for residential real estate markets. Financial markets interpret rising consumer confidence as a precursor to higher consumer spending. Higher consumer spending could in turn spark inflation. Look for a change in the direction of the six month moving average of the index. Consumers do not usually have the necessary information to accurately assess income and job growth six months in the future. The report provides information on planned spending, which does not necessarily turn into actual spending, although it is unlikely that increasing consumer confidence would be followed by a decline in spending. The Consumer Confidence survey is not useful for any type of forecasting. 11/08/09 14:00 Wholsale Inventories -0.8% -0.8% Jun Country: US 11/08/09 14:00 Wholesale Trade 0.2% 0.2% Jun Country: US Source: The Census Bureau of the Department of Commerce. Raw Data Available At: http://www.census.gov/svsd/www/mwts.html Release Time: 10:00 ET around the fifth business day of the month (data for two months prior). The wholesale trade report includes sales and inventory statistics from the second stage of the manufacturing process. The sales figures say close to nothing about personal consumption and therefore do not move the market. Wholesale inventories sometimes swing enough to change the aggregate inventory profile (aggregate inventory is the sum of inventory at the manufacturing, wholesale, and retail levels), which may affect the GDP outlook. In that event they can elicit a small market reaction. More often than not, however, this release goes unnoticed except by market economists. 12/08/09 01:00 Consumer Confidence 9.3% Aug Country: Australia Source: The Conference Board. Raw Data Available At: http://www.tcb-indicators.org/ Release Time: 10:00 ET on the last Tuesday of the month (data for current month). This survey measures the level of confidence individual households have in the performance of the economy now and in the future. It is a leading indicator of future spending and the business cycle. 5000 consumers in the nine census divisions across the country are surveyed each month. The level of consumer confidence is directly correlated to the strength of consumer spending, which accounts for two-thirds of the economy. It also correlates closely with joblessness, inflation, and real incomes. The report can occasionally be helpful in predicting sudden shifts in consumption patterns, though most small changes in the index are just noise. Only index changes of at least five points should be considered significant. The index consists of two subindexes - consumers' appraisal of current conditions and their expectations for the future. Expectations make up 60% of the total index, with current conditions accounting for the other 40%. The expectations index is typically seen as having better leading indicator qualities than the current conditions index. The more confident consumers are about the economy and their own personal finances, the more likely they are to spend. Note, changes in consumer confidence and retail sales do not move in tandem month by month. If the economy experiences a long-term expansion, buying intentions may decline even while the jobless rate declines because of the satisfaction of pent-up demand. Conversely, if inflation begins to accelerate, spending plans may increase for the short-term as consumers buy now to avoid having to pay higher prices later. Regional differences in consumer confidence are an indication of differing business cycles across the nation. This has implications for spending on durable goods and, more importantly, for residential real estate markets. Financial markets interpret rising consumer confidence as a precursor to higher consumer spending. Higher consumer spending could in turn spark inflation. Look for a change in the direction of the six month moving average of the index. Consumers do not usually have the necessary information to accurately assess income and job growth six months in the future. The report provides information on planned spending, which does not necessarily turn into actual spending, although it is unlikely that increasing consumer confidence would be followed by a decline in spending. The Consumer Confidence survey is not useful for any type of forecasting. 12/08/09 08:30 ILO Unemployment 7.8% 7.6% Jun Country: UK Source: Bureau of Labor Statistics, U.S. Department of Labor. Raw Data Available At: http://stats.bls.gov/news.release/empsit.toc.htm Release Time: First Friday of the month at 8:30 ET for the prior month. In Brief The employment report is actually two separate reports which are the results of two separate surveys. The household survey is a survey of roughly 60,000 households. This survey produces the unemployment rate. The establishment survey is a survey of 375,000 businesses. This survey produces the nonfarm payrolls, average workweek, and average hourly earnings figures, to name a few. Both surveys cover the payroll period which includes the 12th of each month. The reports both measure employment levels, just from different angles. Due to the vastly different size of the survey samples (the establishment survey not only surveys more businesses, but each business employs many individuals), the measures of employment may differ markedly from month to month. The household survey is used only for the unemployment measure - the market focusses primarily on the more comprehensive establishment survey. Together, these two surveys make up the employment report, the most timely and broad indicator of economic activity released each month. Total payrolls are broken down into sectors such as manufacturing, mining, construction, services, and government. The markets follows these components closely as indicators of the trends in sectors of the economy; the manufacturing sector is watched the most closely as it often leads the business cycle. The data also include breakdowns of hours worked, overtime, and average hourly earnings. The average workweek (also known as hours worked) is important for two reasons. First, it is a critical determinant of such monthly indicators as industrial production and personal income. Second, it is considered a useful indicator of labor market conditions: a rising workweek early in the business cycle may be the first indication that employers are preparing to boost their payrolls, while late in the cycle a rising workweek may indicate that employers are having difficulty finding qualified applicants for open positions. Average earnings are closely followed as an indicator of potential inflation. Like the price of any good or service, the price of labor reacts to an overly accommodative monetary policy. If the price of labor is rising sharply, it may be an indication that too much money is chasing too few goods, or in this case employees. In Depth The employment report is really two reports - the household survey and the establishment survey. These two surveys contain a wealth of timely information which justify this report's status as the most important economic release of the month. This same wealth of information can nevertheless turn into a dearth of knowledge if it is not placed in the proper context. Household and Establishment Surveys The household and establishment surveys differ due to the source of the data, as the names suggest. The household survey is a survey of households and the establishment survey is a surveys of businesses. The establishment survey, which is sometimes referred to as the payrolls survey, is favored by the market for a simple reason - it is far more comprehensive. Both surveys attempt to measure employment conditions at the roughly the same point in time - the household survey covers the calendar week which includes the 12th of the month while the establishment survey covers the pay period (be it a week, two weeks, or longer) which includes the 12th. But the establishment survey covers 390,000 businesses which employ 47 million people, while the household survey covers just 50,000 individuals. With a sample size which is 940 times larger than the household survey, it is hardly surprising that the market is more interested in the establishment survey. Aside from the sample size, the surveys differ in other significant ways. The household survey counts farm workers, the self-employed, unpaid family workers, and private household workers as employed; the establishment survey does not. The household survey can only count one individual as employed once, even if that person holds two jobs. The establishment survey will double count an individual who appears on the payrolls of two companies. There are other, less significant differences, but let's turn now to the statistics produced by the two surveys. The Household Survey The Unemployment Rate As we noted earlier, the household survey is not nearly as reliable as the establishment survey due to the small size of the survey sample. This survey nevertheless receives attention, primarily because it is responsible for the one figure which is guaranteed to lead the nightly news - the unemployment rate. The unemployment rate demands little explanation, though it is worth noting that the rate can occasionally sees significant monthly changes which are due to flukes in the data. The rate is simply the result of dividing the number of people unemployed (labor force less employed) by the number of people in the labor force. The problem is that the employment and labor force measures in the household survey are far more volatile than even nonfarm payrolls. The reason, of course, is the small survey sample size. It is therefore useful to look at the labor force and employment figures themselves to determine if changes in the unemployment rate are due to aberrant swings in one or both of these series. Beyond the basics of tallying up the labor force and employment, the household survey breaks down these totals in every way imaginable - by gender, race, age, type of job, duration of unemployment, and on and on. These breakdowns seldom are of interest to the financial markets. Perhaps the only two exceptions are the discouraged worker and part-time worker measures. Discouraged Workers Discouraged workers are people who have dropped out of the labor force because they have become discouraged about their job prospects. During hard times, this statistic is often watched alongside the unemployment rate. If the job situation gets exceptionally bleak, it is possible to see the unemployment rate remaining stable not because people are finding jobs, but because they have given up looking and dropped out of the labor force. Part-Time Workers The issue of part time employment has arisen in recent years as many analysts have argued that strong payroll growth reflected the increase in the number of workers holding multiple part-time jobs. Since the payroll data do not differentiate between full and part-time workers, it is possible that a sudden surge in part-time employment which reflected poor full-time job prospects would actually boost payroll growth. In reality, it does not appear that this has happened, as part-time employment has been relatively steady in recent years. This figure nevertheless receives attention from time to time. The Big Picture Given the wealth of data contained in the employment report, it is important to take all of these indicators into account when passing judgment on the report. Looking at payrolls along is often misleading, as the workweek, earnings, and household employment measures may be telling a different story. Taken together, however, and taken with the caveats concerning monthly volatility and revisions, the employment report offers the best monthly glimpse of the economy. 12/08/09 08:30 Initial Jobless Claims 20.0k 23.8k Jul Country: UK Source: The Employment and Training Administration of the Department of Labor. Raw Data Available At: http://www.dol.gov/opa/media/press/eta/main.htm Release Time: 8:30 ET each Thursday (data for week ended prior Saturday). This survey measures the attitudes and expectations concerning both present and future economic conditions of 500 consumers. The Michigan index is almost identical to the Conference Board Consumer Confidence index, though there are two monthly releases, a preliminary and final reading. Like the Conference Board index, it has two subindexes - expectations and current conditions. The expectations index is a component of the Conference Board's Leading Indicators index. 12/08/09 09:00 Industrial Production mm 0.2% 0.5% Jun Country: EMU Source: Federal Reserve. Raw Data Available At: http://www.federalreserve.gov/releases/G17/Current/g17.txt Release Time: 9:15 ET around the 15th of the month (data for month prior). The index of Industrial Production is a fixed-weight measure of the physical output of the nation's factories, mines, and utilities. Manufacturing production, the largest component of the total, can be accurately predicted using total manufacturing hours worked from the employment report. One of the bigger wildcards in this report is utility production, which can be quite volatile due to swings in the weather. Severe hot or cold spells can boost production as increased heating/cooling needs drive utility production up. In addition to production, this monthly report also provides a measure of capacity utilization. Though the rate of capacity utilization is seen as a critical gauge of the slack available in the economy, the market does not completely trust this measure. Capacity is very difficult to measure, and the Fed essentially assumes that growth in capacity in any given year follows a straight line. One can therefore predict the capacity utilization rate quite accurately based on the assumption for production growth. The 85% mark is seen as a key barrier over which inflationary pressures are generated, but given revisions to these data and the difficulties with capacity measurement, the 85% mark should be viewed cautiously. It would be appropriate to look for corroborating inflation indications from commodity prices and vendor deliveries. 12/08/09 09:00 Industrial Production yy -16.1% -17.0% Jun Country: EMU Source: Federal Reserve. Raw Data Available At: http://www.federalreserve.gov/releases/G17/Current/g17.txt Release Time: 9:15 ET around the 15th of the month (data for month prior). The index of Industrial Production is a fixed-weight measure of the physical output of the nation's factories, mines, and utilities. Manufacturing production, the largest component of the total, can be accurately predicted using total manufacturing hours worked from the employment report. One of the bigger wildcards in this report is utility production, which can be quite volatile due to swings in the weather. Severe hot or cold spells can boost production as increased heating/cooling needs drive utility production up. In addition to production, this monthly report also provides a measure of capacity utilization. Though the rate of capacity utilization is seen as a critical gauge of the slack available in the economy, the market does not completely trust this measure. Capacity is very difficult to measure, and the Fed essentially assumes that growth in capacity in any given year follows a straight line. One can therefore predict the capacity utilization rate quite accurately based on the assumption for production growth. The 85% mark is seen as a key barrier over which inflationary pressures are generated, but given revisions to these data and the difficulties with capacity measurement, the 85% mark should be viewed cautiously. It would be appropriate to look for corroborating inflation indications from commodity prices and vendor deliveries. 12/08/09 09:30 Bank of England Quarterly Inflation Report Country: UK 12/08/09 11:30 International Trade Balance mm -28.45b -25.96 Jun Country: US Source: The Census Bureau and the Bureau of Economic Analysis of the Department of Commerce. Raw Data Available At: http://www.census.gov/foreign-trade/www/press.html Release Time: 8:30 ET around the 20th of the month (data for two months prior). The trade report is most widely watched for trends in the overall trade balance. But trends in both exports and imports of goods and services bear watching as well. The export data in particular are important to watch for indications that a strengthening competitive position at home and/or strengthening economies overseas are boosting U.S. growth. Imports provide an indication of domestic demand, but given the severe lag of this report relative to other consumption indicators, it is not particularly valuable for this purpose. The volatility in the monthly trade balance can play an important role in GDP forecasts. Net exports are a relatively volatile component of GDP, and the trade report provides the only early clues to the net export performance each quarter. 12/08/09 12:30 House Prices -0.1% Jun Country: Canada 12/08/09 12:30 International Trade Balance mm -1.42b Jun Country: Canada Source: The Census Bureau and the Bureau of Economic Analysis of the Department of Commerce. Raw Data Available At: http://www.census.gov/foreign-trade/www/press.html Release Time: 8:30 ET around the 20th of the month (data for two months prior). The trade report is most widely watched for trends in the overall trade balance. But trends in both exports and imports of goods and services bear watching as well. The export data in particular are important to watch for indications that a strengthening competitive position at home and/or strengthening economies overseas are boosting U.S. growth. Imports provide an indication of domestic demand, but given the severe lag of this report relative to other consumption indicators, it is not particularly valuable for this purpose. The volatility in the monthly trade balance can play an important role in GDP forecasts. Net exports are a relatively volatile component of GDP, and the trade report provides the only early clues to the net export performance each quarter. 12/08/09 18:00 Budget -166.0b -102.77 Jul Country: US Source: U.S. Treasury Department. Raw Data Available At: http://www.fms.treas.gov/mts/index.html Release Time: 14:00 ET, about the third week of the month for the prior month. In Brief The monthly Treasury budget data follow strong seasonal patterns which produce huge month-to-month fluctuations in the deficit. These fluctuations tell us little about long term budget trends. To the extent that the market analyses the monthly Treasury data, the focus is on year/year changes in receipts and outlays, since the data are not seasonally adjusted. Only in April, the most important month for tax inflows to the Treasury, does the market pay any attention to this report. The data can be predicted with reasonable accuracy by using daily data in the Daily Treasury Statement. In Depth The President's Budget The annual budget process begins in late January or early February with the presentation of the President's budget for the coming fiscal year. The President's proposals serve as an outline for Congress, particularly when the White House and Congress are controlled by the same party. In the 1980s, the conflicting agendas of the President and Congress often resulted in a final budget which bore little resemblance to the President's budget. After a quiet budget year in 1994 when Democrats controlled Congress and the White House, the Republican takeover of the House and Senate has produced more contentious budget battles in 1995 and 1996. One of the most common misperceptions about the budget process is that the annual budgeting actually covers all federal spending. Though the President's proposed budget will include projections for all federal government outlays, less than half of all spending is actually controlled by the annual budget legislation. Roughly 67% of federal outlays are mandated by "permanent" law. Unless these laws are changed, no legislative review of spending programs funded by permanent law is required in the appropriations process. The same is true of federal receipts, where permanent law does not require annual review of taxation. Permanent law should not by any means be construed as suggesting true permanence. Permanent laws are changed frequently, with the 1990 and 1993 budget deals being the most recent examples. These recent efforts to reduce the deficit have incorporated both changes in discretionary spending and changes in permanent laws affecting taxes and spending. Such deficit reduction efforts are usually packaged into a so-called Omnibus Budget Reconciliation Act (OBRA). In the absence of these comprehensive deficit reduction efforts, the annual budget review will only deal with discretionary spending which makes up roughly 33% of the budget. It is perhaps one of the better kept secrets in Washington that the annual budget review which seems at the core of the democratic process does not in fact review even half of all federal spending. The Budget Resolution Once the President has submitted his budget to Congress, the legislative process begins. Within six weeks of the date that the President presents his budget, each Congressional committee must report to the House and Senate Budget Committees regarding budget estimates for programs overseen by their committee. The Budget Committees then approve a budget resolution based on these estimates. After full House and Senate approval of these resolutions, any differences between the House and Senate versions are worked out in conference committee and then a final resolution is approved by each house. This process is scheduled to be completed by April 15, but is often delayed, as was the case this year. As the budget resolution is only a blueprint for the budget and not actual legislation, it does not require presidential approval. Appropriations Bills The real job of budgeting begins after the budget resolution is adopted. The appropriations process is when actual budget authority for discretionary programs is legislated. We have already noted that annual budgeting only covers discretionary programs, which are responsible for just 33% of total spending. Even these discretionary programs are not bundled into one budget package. The annual budget for discretionary spending is actually comprised of 13 separate appropriations bills. The House and Senate Appropriations Committees each include 13 subcommittees which are responsible for the 13 bills. The 13 subcommittees are listed below. Subcommittees of the House and Senate Committees Agriculture Commerce Justice Defense Dis. of Columbia Energy Water Foreign Ops. Interior Labor Health Legislative Military Const. Transportation Treasury Postal Service Veterans HUD Agencies As all tax and spending bills must originate in the House, the House Appropriations subcommittees will see the first action in the appropriations process. The 13 bills are crafted individually and do not work their way through the House and Senate on the same timetable. The goal is of course to complete legislation on all 13 bills by the beginning of the fiscal year on October 1. Yet these bills proceed and are approved of on their own, and are not packaged into one comprehensive bill known simply as the budget. Once a House Appropriations subcommittee approves its bill, the legislation proceeds to the full Committee and then to the House floor. Approval by the House sets in motion the same process in the Senate. Upon approval by the full Senate, differences between the House and Senate versions of the bill are reconciled in conference committee and then a final version of the bill is sent back to the House and Senate floors. Presidential approval of each of the 13 appropriations bills completes the process. When work on the 13 bills is delayed past the start of the fiscal year, Congress and the President must approve of continuing resolutions which fund government programs at the prior year's level until the relevant appropriations bill is signed into law. One final note about the appropriations process is that the appropriations bills do not set actual outlays for the coming fiscal year, but instead legislate "budget authority." The Office of Management and Budget (OMB) defines budget authority as "the authority to incur legally binding obligations of the Government that will result in immediate or future outlays." Actual outlays may exceed or fall short of budget authority in any given year depending on past budget authority and the duration of a program. Omnibus Budget Reconciliation Act In years such as 1985, 1987, 1990, and 1993, Congress has enacted legislation aimed at long term deficit reduction. These legislative efforts occur separately from the annual appropriations process. They may change permanent laws and set caps which affect discretionary spending, but the regular budget process will nevertheless be unchanged. OBRA legislation affects permanent law and is not a substitute for annual budgets. OBRA legislation packages changes in permanent laws which will typically affect both taxation and mandatory spending. The legislative process for OBRA is completely different than the appropriations process. Legislation is still initiated in the House, but is not limited to work by the Appropriations Committee. The House Ways and Means Committee oversees tax law, and thus plays a critical role in OBRA legislation, as does its Senate counterpart, the Finance Committee. Legislation affecting entitlement programs also falls under the jurisdiction of committees other than Appropriations, i.e. proposed Medicare changes would be considered by a House Ways and Means subcommittee on health care. Supplemental Appropriations The 13 appropriations bills are not necessarily the last word for the year on federal spending. Supplemental appropriations bills may be approved at any time to provide additional funding for government programs. Tight caps on discretionary spending set by the 1990 and 1993 budget acts require a pay-as-you- go approach to such funding, thus limiting the number of supplemental appropriations. "Emergency" spending circumvents the pay-as-you-go mandate, however, allowing for a variety of supplemental appropriations. Past "emergencies" have covered everything from the Gulf War to extended unemployment insurance to natural disaster relief. 12/08/09 18:15 Interest Rate Decision 0.25% Aug Country: US Source (U.S.): The Federal Reserve Open Market Committee - FOMC. Source (World): The Central Bank Monetary Policy Committee - MPC. The Federal Open Market Committee is a twelve-member committee made up of the seven members of the Board of Governors and five Federal Reserve Bank presidents. It meets eight times per year to determine the near-term direction of monetary policy, such as setting guidelines for the purchase and sale of government securities and setting policy relating to System operations in the foreign exchange markets. These changes in monetary policy are now announced immediately after FOMC meetings. Most importantly, the Fed determines interest rate policy at FOMC meetings. Market participants speculate about the possibility of an interest rate change at these meetings, and if the outcome is different from expectations, the impact on the markets can be dramatic and far-reaching. The interest rate set by the Fed the federal funds rate serves as a benchmark for all other rates. A change in the fed funds rate, the lending rate banks charge each other for the use of overnight funds, translates directly through to all other interest rates from Treasury bonds to mortgage loans. It also changes the dynamics of competition for investor dollars: when bonds yield 10 percent, they will attract more money away from stocks then when they only yield 5 percent. The level of interest rates affects the economy­ higher rates tend to slow activity; lower rates stimulate activity, a ripple effect that expands into all sectors of the economy. 13/08/09 06:00 Gross Domestic Product (GDP) qq -0.4% -3.8% Q2 Country: Germany Source: Bureau of Economic Analysis, U.S. Department of Commerce. Raw Data Available At: http://www.bea.doc.gov/bea/dn1.htm Release Time: Third or fourth week of the month at 8:30 ET for the prior quarter, with subsequent revisions released in the second and third months of the quarter. Gross Domestic Product (GDP) is the broadest measure of economic activity. Annualized quarterly percent changes in GDP reflect the growth rate of total economic output. The figures can be quite volatile from quarter to quarter. Inventory and net export swings in particular can produce significant volatility in GDP. The final sales figure, which excludes inventories, can sometimes be helpful in identifying underlying growth trends as inventories represent unsold goods, and a large inventory increase will boost GDP but might be indicative of weakness rather than strength. The broad components of GDP are: consumption, investment, net exports, government purchases, and inventories. Consumption is by far the largest component, totalling roughly 2/3rds of GDP. In addition to the GDP figures, there are GDP deflators, which measure the change in prices in total GDP and for each component. Though the consumer price index is a more closely watched inflation indicator, the GDP deflator is another key inflation measure. Unlike CPI, it has the advantage of not being a fixed basket of goods and services, so that changes in consumption patterns or the introduction of new goods and services will be reflected in the deflator. With both GDP and the deflator, the market tends to focus on the quarter/quarter change. Year/year changes are also cited frequently, though they do not provide the most timely indications of economic activity or inflation. The bond market often reacts to GDP, though the price moves are typically small, as much of the GDP data is easily predicted using monthly economic releases such as personal consumption, durable goods shipments, construction spending, international trade, and inventories. Quarterly GDP reports are broken down into three announcements: advance, preliminary, and final. After the final revision, GDP is not revised again until the annual benchmark revisions each July. These revisions can be quite large and usually affect the past five years of data. 13/08/09 06:00 Gross Domestic Product (GDP) yy -6.8% -6.7% Q2 Country: Germany Source: Bureau of Economic Analysis, U.S. Department of Commerce. Raw Data Available At: http://www.bea.doc.gov/bea/dn1.htm Release Time: Third or fourth week of the month at 8:30 ET for the prior quarter, with subsequent revisions released in the second and third months of the quarter. Gross Domestic Product (GDP) is the broadest measure of economic activity. Annualized quarterly percent changes in GDP reflect the growth rate of total economic output. The figures can be quite volatile from quarter to quarter. Inventory and net export swings in particular can produce significant volatility in GDP. The final sales figure, which excludes inventories, can sometimes be helpful in identifying underlying growth trends as inventories represent unsold goods, and a large inventory increase will boost GDP but might be indicative of weakness rather than strength. The broad components of GDP are: consumption, investment, net exports, government purchases, and inventories. Consumption is by far the largest component, totalling roughly 2/3rds of GDP. In addition to the GDP figures, there are GDP deflators, which measure the change in prices in total GDP and for each component. Though the consumer price index is a more closely watched inflation indicator, the GDP deflator is another key inflation measure. Unlike CPI, it has the advantage of not being a fixed basket of goods and services, so that changes in consumption patterns or the introduction of new goods and services will be reflected in the deflator. With both GDP and the deflator, the market tends to focus on the quarter/quarter change. Year/year changes are also cited frequently, though they do not provide the most timely indications of economic activity or inflation. The bond market often reacts to GDP, though the price moves are typically small, as much of the GDP data is easily predicted using monthly economic releases such as personal consumption, durable goods shipments, construction spending, international trade, and inventories. Quarterly GDP reports are broken down into three announcements: advance, preliminary, and final. After the final revision, GDP is not revised again until the annual benchmark revisions each July. These revisions can be quite large and usually affect the past five years of data. 13/08/09 09:00 Gross Domestic Product (GDP) qq -0.6% -2.5% Aug Country: EMU Source: Bureau of Economic Analysis, U.S. Department of Commerce. Raw Data Available At: http://www.bea.doc.gov/bea/dn1.htm Release Time: Third or fourth week of the month at 8:30 ET for the prior quarter, with subsequent revisions released in the second and third months of the quarter. Gross Domestic Product (GDP) is the broadest measure of economic activity. Annualized quarterly percent changes in GDP reflect the growth rate of total economic output. The figures can be quite volatile from quarter to quarter. Inventory and net export swings in particular can produce significant volatility in GDP. The final sales figure, which excludes inventories, can sometimes be helpful in identifying underlying growth trends as inventories represent unsold goods, and a large inventory increase will boost GDP but might be indicative of weakness rather than strength. The broad components of GDP are: consumption, investment, net exports, government purchases, and inventories. Consumption is by far the largest component, totalling roughly 2/3rds of GDP. In addition to the GDP figures, there are GDP deflators, which measure the change in prices in total GDP and for each component. Though the consumer price index is a more closely watched inflation indicator, the GDP deflator is another key inflation measure. Unlike CPI, it has the advantage of not being a fixed basket of goods and services, so that changes in consumption patterns or the introduction of new goods and services will be reflected in the deflator. With both GDP and the deflator, the market tends to focus on the quarter/quarter change. Year/year changes are also cited frequently, though they do not provide the most timely indications of economic activity or inflation. The bond market often reacts to GDP, though the price moves are typically small, as much of the GDP data is easily predicted using monthly economic releases such as personal consumption, durable goods shipments, construction spending, international trade, and inventories. Quarterly GDP reports are broken down into three announcements: advance, preliminary, and final. After the final revision, GDP is not revised again until the annual benchmark revisions each July. These revisions can be quite large and usually affect the past five years of data. 13/08/09 09:00 Gross Domestic Product (GDP) yy -5.1% -4.9% Q2 Country: EMU Source: Bureau of Economic Analysis, U.S. Department of Commerce. Raw Data Available At: http://www.bea.doc.gov/bea/dn1.htm Release Time: Third or fourth week of the month at 8:30 ET for the prior quarter, with subsequent revisions released in the second and third months of the quarter. Gross Domestic Product (GDP) is the broadest measure of economic activity. Annualized quarterly percent changes in GDP reflect the growth rate of total economic output. The figures can be quite volatile from quarter to quarter. Inventory and net export swings in particular can produce significant volatility in GDP. The final sales figure, which excludes inventories, can sometimes be helpful in identifying underlying growth trends as inventories represent unsold goods, and a large inventory increase will boost GDP but might be indicative of weakness rather than strength. The broad components of GDP are: consumption, investment, net exports, government purchases, and inventories. Consumption is by far the largest component, totalling roughly 2/3rds of GDP. In addition to the GDP figures, there are GDP deflators, which measure the change in prices in total GDP and for each component. Though the consumer price index is a more closely watched inflation indicator, the GDP deflator is another key inflation measure. Unlike CPI, it has the advantage of not being a fixed basket of goods and services, so that changes in consumption patterns or the introduction of new goods and services will be reflected in the deflator. With both GDP and the deflator, the market tends to focus on the quarter/quarter change. Year/year changes are also cited frequently, though they do not provide the most timely indications of economic activity or inflation. The bond market often reacts to GDP, though the price moves are typically small, as much of the GDP data is easily predicted using monthly economic releases such as personal consumption, durable goods shipments, construction spending, international trade, and inventories. Quarterly GDP reports are broken down into three announcements: advance, preliminary, and final. After the final revision, GDP is not revised again until the annual benchmark revisions each July. These revisions can be quite large and usually affect the past five years of data. 13/08/09 12:30 Export Prices 0.4% 1.1% Jul Country: US 13/08/09 12:30 Initial Jobless Claims 550k L/W Country: US Source: The Employment and Training Administration of the Department of Labor. Raw Data Available At: http://www.dol.gov/opa/media/press/eta/main.htm Release Time: 8:30 ET each Thursday (data for week ended prior Saturday). This survey measures the attitudes and expectations concerning both present and future economic conditions of 500 consumers. The Michigan index is almost identical to the Conference Board Consumer Confidence index, though there are two monthly releases, a preliminary and final reading. Like the Conference Board index, it has two subindexes - expectations and current conditions. The expectations index is a component of the Conference Board's Leading Indicators index. 13/08/09 12:30 Import Prices 0.1% 3.2% Jul Country: US 13/08/09 12:30 Core Retail Sales mm 0.3% 0.3% Jul Country: US Source: The Census Bureau of the Department of Commerce. Raw Data Available At: http://www.census.gov/svsd/www/advtable.html Release Time: 8:30 ET around the 13th of the month (data for one month prior). The retail sales report is a measure of the total receipts of retail stores. The changes in retail sales are widely followed as the most timely indicator of broad consumer spending patterns. Retail sales are often viewed ex-autos, as auto sales can move sharply from month-to-month. It is also important to keep an eye on the gas and food components, where changes in sales are often a result of price changes rather than shifting consumer demand. 13/08/09 12:30 Retail Sales mm 0.3% 0.6% Jul Country: US Source: The Census Bureau of the Department of Commerce. Raw Data Available At: http://www.census.gov/svsd/www/advtable.html Release Time: 8:30 ET around the 13th of the month (data for one month prior). The retail sales report is a measure of the total receipts of retail stores. The changes in retail sales are widely followed as the most timely indicator of broad consumer spending patterns. Retail sales are often viewed ex-autos, as auto sales can move sharply from month-to-month. It is also important to keep an eye on the gas and food components, where changes in sales are often a result of price changes rather than shifting consumer demand. Retail sales can be quite volatile and the advance reports are subject to rather large revisions. Retail sales do not include spending on services, which makes up over half of total consumption. Total personal consumption is not available until the personal income and consumption reports are released, typically two weeks after retail sales. 13/08/09 14:00 Business Inventories -0.9% -1.0% Jun Country: US Source: The Census Bureau of the Department of Commerce. Raw Data Available At: http://www.census.gov/mtis/www/current.html Release Time: 08:30 ET around the 15th of the month (data for two months prior). The business inventories report includes sales and inventory statistics from all three stages of the manufacturing process (manufacturing, wholesale, and retail). But by the time it is released all three of its sales components and two of its inventory components have already been reported. Because retail inventory is the only new piece of information it contains, the market usually ignores the business inventories report. However, sometimes retail inventories swing enough to change the aggregate inventory profile. This may affect the GDP outlook. When it does, the report can elicit a small market reaction. The aggregate sales figures are dated and they say little about personal consumption. They are actually a good coincident indicator, but the market is far more interested in forward-looking statistics. The inventory-to-sales (I/S) ratio measures the number of months it would take to deplete existing inventory at current sales rates. A relatively low (high) I/S ratio may mean that manufacturers will have to build up (draw down) inventory levels. Depending on the strength of final demand and the degree to which recent inventory changes have been intended or unintended, this can have an effect on the industrial production outlook. Note that this information is much more useful to market economists than it is to other market participants. 13/08/09 22:45 Core Retail Sales mm 1.6% Jun Country: NewZealand Source: The Census Bureau of the Department of Commerce. Raw Data Available At: http://www.census.gov/svsd/www/advtable.html Release Time: 8:30 ET around the 13th of the month (data for one month prior). The retail sales report is a measure of the total receipts of retail stores. The changes in retail sales are widely followed as the most timely indicator of broad consumer spending patterns. Retail sales are often viewed ex-autos, as auto sales can move sharply from month-to-month. It is also important to keep an eye on the gas and food components, where changes in sales are often a result of price changes rather than shifting consumer demand. 13/08/09 22:45 Retail Sales mm 0.8$ Jun Country: NewZealand Source: The Census Bureau of the Department of Commerce. Raw Data Available At: http://www.census.gov/svsd/www/advtable.html Release Time: 8:30 ET around the 13th of the month (data for one month prior). The retail sales report is a measure of the total receipts of retail stores. The changes in retail sales are widely followed as the most timely indicator of broad consumer spending patterns. Retail sales are often viewed ex-autos, as auto sales can move sharply from month-to-month. It is also important to keep an eye on the gas and food components, where changes in sales are often a result of price changes rather than shifting consumer demand. Retail sales can be quite volatile and the advance reports are subject to rather large revisions. Retail sales do not include spending on services, which makes up over half of total consumption. Total personal consumption is not available until the personal income and consumption reports are released, typically two weeks after retail sales. 13/08/09 22:45 Retail Sales yy -2.4% Jun Country: NewZealand Source: The Census Bureau of the Department of Commerce. Raw Data Available At: http://www.census.gov/svsd/www/advtable.html Release Time: 8:30 ET around the 13th of the month (data for one month prior). The retail sales report is a measure of the total receipts of retail stores. The changes in retail sales are widely followed as the most timely indicator of broad consumer spending patterns. Retail sales are often viewed ex-autos, as auto sales can move sharply from month-to-month. It is also important to keep an eye on the gas and food components, where changes in sales are often a result of price changes rather than shifting consumer demand. Retail sales can be quite volatile and the advance reports are subject to rather large revisions. Retail sales do not include spending on services, which makes up over half of total consumption. Total personal consumption is not available until the personal income and consumption reports are released, typically two weeks after retail sales. 13/08/09 23:30 Tankan Survey -43.0 Aug Country: Japan Source: Bank of Japan. Raw Data Available At: http://www2.boj.or.jp/en/dlong/tk/faqtk.htm When in December the Bank of Japan is publishing the latest results of its Tankan, once again the world will take them as an indicator of the state of the Japanese economy and as signal in which direction future monetary policy may go. The Tankan is a short-term economic survey of Japanese enterprises published four times a year. Figures for several series are available from 1957 onward, but the coverage of firms varied over time. For example, while in the early 1990s more than 8,000 enterprises were included, nowadays the survey covers about 9,000. Those are divided into four major groups: Large, small and medium-sized as well as principal enterprises. The survey contains questions about quantitative data as well as qualitative judgements concerning the following developments: 1. Business conditions 2. Supply and demand conditions for products and inventories as well as prices 3. Sales 4. Corporate profits 5. Fixed investments and production capacity 6. Employment conditions 7. Corporate finance as well as the lending attitude of financial institutions and changes in interest rates on loans. The qualitative judgements are the basis on which the Bank of Japan calculates so-called diffusion indexes. Firms choose between several alternatives, for example 1. favourable/non-favourable for business conditions 2. excessive/insufficient for demand conditions, inventory levels, production capacity and employment 3. easy/tight for corporate finance 4. accommodative/severe for the lending attitude of financial institutions. The diffusion indexes are constructed by subtracting the portion of responses with a negative tone from those with a positive one. The Tankan may give an overall impression of the business climate in Japan, but its reliance is weakened by at least two aspects: First, the construction of data from qualitative judgements somewhat disguises the fact that these only describe a rough tendency of momentary views of parts of the business community - soft information which can be no substitute for strong numbers. Second, as far as the firms are aware of the role of the Tankan as an indicator not only for the general public but also for policy decisions they may be tempted to influence it in one direction or the other by choosing their responses respectively. 13/08/09 23:30 Reserve Bank of Australia Governor Speech Country: Australia 13/08/09 23:50 Protocol of last interest rate meeting Jul Country: Japan 14/08/09 09:00 Core HICP mm -0.5% 0.0% Jul Country: EMU Source: EU Eurostat. Raw Data Available At: http://europa.eu.int/comm/eurostat/ HICP is the inflation indicator used by the European Central Bank: The method for calculating the CPI varies in different countries and can cause problems for international comparisons. To address this problem, a harmonized index of consumer prices (HICP) have been developed within EU, based on coordinated methodology. HICP is a fundamental indicator for the European Central Bank (ECB) in evaluating EMU's monetary policy goals. HICP is also used to follow up the convergence criteria for price stability with regards to membership in EMU. HICP can be greatly influenced in any given month by a movement in volatile food and energy prices. Therefore, it is important to look at HICP excluding food and energy, commonly called the "core rate" of inflation. Within the core rate, some of the more volatile and closely watched components are apparel, tobacco, airfares, and new cars. In addition to tracking the month/month changes in core HICP, the year/year change in core HICP is seen by most economists as the best measure of the underlying inflation rate. 14/08/09 09:00 Core HICP yy 1.3% 1.3% Jul Country: EMU Source: EU Eurostat. Raw Data Available At: http://europa.eu.int/comm/eurostat/ HICP is the inflation indicator used by the European Central Bank: The method for calculating the CPI varies in different countries and can cause problems for international comparisons. To address this problem, a harmonized index of consumer prices (HICP) have been developed within EU, based on coordinated methodology. HICP is a fundamental indicator for the European Central Bank (ECB) in evaluating EMU's monetary policy goals. HICP is also used to follow up the convergence criteria for price stability with regards to membership in EMU. HICP can be greatly influenced in any given month by a movement in volatile food and energy prices. Therefore, it is important to look at HICP excluding food and energy, commonly called the "core rate" of inflation. Within the core rate, some of the more volatile and closely watched components are apparel, tobacco, airfares, and new cars. In addition to tracking the month/month changes in core HICP, the year/year change in core HICP is seen by most economists as the best measure of the underlying inflation rate. 14/08/09 09:00 Harm. Index of Consumer Prices mm -0.6% 0.2% Jul Country: EMU Source: EU Eurostat. Raw Data Available At: ttp://europa.eu.int/comm/eurostat/ HICP is the inflation indicator used by the European Central Bank: The method for calculating the CPI varies in different countries and can cause problems for international comparisons. To address this problem, a harmonized index of consumer prices (HICP) have been developed within EU, based on coordinated methodology. HICP is a fundamental indicator for the European Central Bank (ECB) in evaluating EMU's monetary policy goals. HICP is also used to follow up the convergence criteria for price stability with regards to membership in EMU. 1996 is the base year and the index is calculated starting in 1995. Certain entries that are currently treated particularly differently in the calculation of national CPIs have been excluded. One particular difference compared with the CPI is that interest costs for owner-occupied homes are not included in the HICP. In addition, certain costs of owner-occupied homes (repairs, real-estate taxes, write-offs, insurance and ground rents), fees for tenant-owned flats, as well as lotteries, pools and tote betting are excluded. Some entries are included in the HICP but not in the CPI. These include childcare, elder care, hospital care and certain financial services (services where the fee is proportional to the size of the transaction). HICP is based on a completely harmonized product classification, COICOP (Classification Of Individual Consumption by Purpose). Harmonized rules for coverage, consideration of new products, updating the product sample, adjustments for changes in quality, and index formulas for the calculations are also used in calculating the HICP. The methods for calculating the index numbers and price changes for the HICP differ to a certain extent from the CPI. Similar to the CPI, the HICP is a chained index with yearly links but a long-term index is not calculated. Instead, yearly links in the HICP are calculated in the same way as the CPI's short-term index. 14/08/09 09:00 Harm. Index of Consumer Prices yy -0.6% -0.1% Jul Country: EMU Source: EU Eurostat. Raw Data Available At: ttp://europa.eu.int/comm/eurostat/ HICP is the inflation indicator used by the European Central Bank: The method for calculating the CPI varies in different countries and can cause problems for international comparisons. To address this problem, a harmonized index of consumer prices (HICP) have been developed within EU, based on coordinated methodology. HICP is a fundamental indicator for the European Central Bank (ECB) in evaluating EMU's monetary policy goals. HICP is also used to follow up the convergence criteria for price stability with regards to membership in EMU. 1996 is the base year and the index is calculated starting in 1995. Certain entries that are currently treated particularly differently in the calculation of national CPIs have been excluded. One particular difference compared with the CPI is that interest costs for owner-occupied homes are not included in the HICP. In addition, certain costs of owner-occupied homes (repairs, real-estate taxes, write-offs, insurance and ground rents), fees for tenant-owned flats, as well as lotteries, pools and tote betting are excluded. Some entries are included in the HICP but not in the CPI. These include childcare, elder care, hospital care and certain financial services (services where the fee is proportional to the size of the transaction). HICP is based on a completely harmonized product classification, COICOP (Classification Of Individual Consumption by Purpose). Harmonized rules for coverage, consideration of new products, updating the product sample, adjustments for changes in quality, and index formulas for the calculations are also used in calculating the HICP. The methods for calculating the index numbers and price changes for the HICP differ to a certain extent from the CPI. Similar to the CPI, the HICP is a chained index with yearly links but a long-term index is not calculated. Instead, yearly links in the HICP are calculated in the same way as the CPI's short-term index. 14/08/09 12:15 Industrial Production mm 0.0% -0.4% Jul Country: US Source: Federal Reserve. Raw Data Available At: http://www.federalreserve.gov/releases/G17/Current/g17.txt Release Time: 9:15 ET around the 15th of the month (data for month prior). The index of Industrial Production is a fixed-weight measure of the physical output of the nation's factories, mines, and utilities. Manufacturing production, the largest component of the total, can be accurately predicted using total manufacturing hours worked from the employment report. One of the bigger wildcards in this report is utility production, which can be quite volatile due to swings in the weather. Severe hot or cold spells can boost production as increased heating/cooling needs drive utility production up. In addition to production, this monthly report also provides a measure of capacity utilization. Though the rate of capacity utilization is seen as a critical gauge of the slack available in the economy, the market does not completely trust this measure. Capacity is very difficult to measure, and the Fed essentially assumes that growth in capacity in any given year follows a straight line. One can therefore predict the capacity utilization rate quite accurately based on the assumption for production growth. The 85% mark is seen as a key barrier over which inflationary pressures are generated, but given revisions to these data and the difficulties with capacity measurement, the 85% mark should be viewed cautiously. It would be appropriate to look for corroborating inflation indications from commodity prices and vendor deliveries. 14/08/09 12:30 Consumer Price Index (CPI) mm 0.1% 0.7% Jul Country: US Source: Bureau of Labor statistics, U.S. Department of Labor. Raw Data Available At: http://stats.bls.gov/news.release/cpi.toc.htm Release Time: 8:30 ET, about the 13th of each month for the prior month. The Consumer Price Index is a measure of the price level of a fixed market basket of goods and services purchased by consumers. CPI is the most widely cited inflation indicator, and it is used to calculate cost of living adjustments for government programs and it is the basis of COLAs for many private labor agreements as well. It has been criticized for overstating inflation, because it does not adjust for substitution effects and because the fixed basket does not reflect price changes in new technology goods which are often declining in price. Despite these criticisms, it remains the benchmark inflation index. 14/08/09 12:30 Consumer Price Index (CPI) yy -1.8% -1.4% Jul Country: US Source: Bureau of Labor statistics, U.S. Department of Labor. Raw Data Available At: http://stats.bls.gov/news.release/cpi.toc.htm Release Time: 8:30 ET, about the 13th of each month for the prior month. The Consumer Price Index is a measure of the price level of a fixed market basket of goods and services purchased by consumers. CPI is the most widely cited inflation indicator, and it is used to calculate cost of living adjustments for government programs and it is the basis of COLAs for many private labor agreements as well. It has been criticized for overstating inflation, because it does not adjust for substitution effects and because the fixed basket does not reflect price changes in new technology goods which are often declining in price. Despite these criticisms, it remains the benchmark inflation index. 14/08/09 13:15 Capacity Utilization 68.1% 68.0 Jul Country: US Source: Federal Reserve. Raw Data Available At: http://www.federalreserve.gov/releases/G17/Current/g17.txt Release Time: 9:15 ET around the 15th of the month (data for month prior). The index of Industrial Production is a fixed-weight measure of the physical output of the nation's factories, mines, and utilities. Manufacturing production, the largest component of the total, can be accurately predicted using total manufacturing hours worked from the employment report. One of the bigger wildcards in this report is utility production, which can be quite volatile due to swings in the weather. Severe hot or cold spells can boost production as increased heating/cooling needs drive utility production up. In addition to production, this monthly report also provides a measure of capacity utilization. Though the rate of capacity utilization is seen as a critical gauge of the slack available in the economy, the market does not completely trust this measure. Capacity is very difficult to measure, and the Fed essentially assumes that growth in capacity in any given year follows a straight line. One can therefore predict the capacity utilization rate quite accurately based on the assumption for production growth. The 85% mark is seen as a key barrier over which inflationary pressures are generated, but given revisions to these data and the difficulties with capacity measurement, the 85% mark should be viewed cautiously. It would be appropriate to look for corroborating inflation indications from commodity prices and vendor deliveries. 14/08/09 13:55 U.Michigan Consumer Sentiment 68.0 66.0 Aug Country: US Source: The University of Michigan. Release Time: Preliminary: 10:00 ET on the second Friday of the month (data for current month); Final: 10:00 ET on the fourth Friday of the month (data for current month). This survey measures the attitudes and expectations concerning both present and future economic conditions of 500 consumers. The Michigan index is almost identical to the Conference Board Consumer Confidence index, though there are two monthly releases, a preliminary and final reading. Like the Conference Board index, it has two subindexes - expectations and current conditions. The expectations index is a component of the Conference Board's Leading Indicators index. Consumer spending accounts for two-thirds of the economy, so the markets follow any indicator relating to consumer behavior and attitudes. The more confident consumers are about the economy and their own personal finances, the more likely they are to spend. It is interesting to note that changes in consumer sentiment and retail sales don't move in tandem. Results for the week of: 03/08/09 - 07/08/09 3 August 2009 - 7 August 2009 * Timezone: GMT Date Time Importance Event Actual Forecast Previous Period 03/08/09 00:00 Market Holiday Country: Canada 03/08/09 07:30 Manufacturing PMI 41.8 Jul Country: Switzerland Source: Institute for Supply Management. Raw Data Available At: http://www.ism.ws/ISMReport/index.cfm Release Time: 10:00 ET on the first business day of the month for the prior month. ISM: Institute for Supply Management formerly NAPM: National Association of Purchasing Managers In Brief The ISM report is a national survey of purchasing managers which covers such indicators as new orders, production, employment, inventories, delivery times, prices, export orders, and import orders. Diffusion indexes are produced for each of these categories, with a reading over 50% indicating expansion relative to the prior month, and a sub-50% reading indicating contraction. The total index is calculated based on a weighted average of the following five sub-indexes, with weights in parentheses: new orders (30%), production (25%), employment (20%), deliveries (15%), and inventories (10%). The ISM is one of the first comprehensive economic releases of the month, typically preceding the employment report. Though it covers only the manufacturing sector, it can often provide accurate hints regarding the tone of subsequent releases. During periods of inflation concerns, the prices paid and vendor deliveries indexes often determine the bond market's reaction to the report. In Depth The Institute for Supply Management's monthly Report on Business is probably the most widely watched economic indicator produced by the private sector. There are two key reasons for the ISM's prominence. First, its longevity - the report was first produced in 1931, and after a break during World War II, it has produced continuously since 1948. Second , its leading quality - the ISM has been one of the better predictors of the business cycle over the years. Who and What It Surveys The ISM index is the result of a monthly survey of over 400 companies in 20 industries throughout the 50 states. The survey queries respondents on a number of monthly indicators, including orders, production, employment, inventories, delivery times, prices paid, export orders, and import orders. Respondents are asked to characterize each indicator as higher, lower, or unchanged for the month (or faster/slower in the case of delivery times). They are not asked for specific numbers - only a thumbs up or down. Presenting the Numbers Based on these responses, the ISM calculates diffusion indexes for each of the components. These diffusion indexes are calculated by adding half of the percentage of respondents answering "unchanged" to the percentage answering "higher" (or "slower" for deliveries). These diffusion indexes do not yield estimates of specific magnitudes of strength or weakness, but the more respondents who are indicating trends in the same direction - the better the chance that the magnitude of that move is larger. A diffusion index of 50% is the theoretical breakeven mark - with readings above indicating strength and below indicating weakness. The ISM only provides the raw data - the Department of Commerce produces the seasonal factors which are used to provide more meaningful, seasonally adjusted indexes. The total index is not the result of a separate question regarding general business conditions (as is the case with the Philadelphia Fed index). Instead, the index is calculated using the weighted sum of five of the subindexes. Orders account for 30% of the total; production - 25%; employment - 20%; deliveries - 15%; inventories - 10%. Prices, export orders, and import orders are not part of the total index. Breakevens in Theory and Practice Though 50% is the breakeven mark in theory, different readings have proved to be breakeven in practice. For new orders, 50.3% is the level consistent with breakeven readings in factory orders. For production, 49.4% has been the breakeven mark in theory and practice. For employment, 47.5% has been consistent with a steady level of manufacturing employment. For inventories, 41.3% has been consistent with steady business inventory readings. And finally, the 42.7% mark on the total index marks the point below which the overall economy is believed to be in recession. Between 42.7-50%, the manufacturing sector may be in decline, but the total economy is only seeing slower growth. No Services This observation highlights the important element which is missing from the ISM index - the service sector. With the manufacturing sector making up an ever- shrinking percentage of the total economy - the ISM might seem to be an indicator in decline. Not so, however - the manufacturing sector, while shrinking in relative terms, still tends to lead the total economy into and out of recessions. The ISM therefore remains a closely watched indicator despite its manufacturing focus. A Proven Performer The ISM's leading quality has been proven over time. Its bottom during a recession has preceded the turning point for the business cycle by an average of four months, and its worst performance in leading the turning point was on two occasions when the ISM trough occurred in the same month as the business cycle trough. The ISM index is released on the first business day of each at 10:00 ET, with data for the prior calendar month. 03/08/09 07:50 Manufacturing PMI 45.2 40.9 Jul Country: Germany Source: Institute for Supply Management. Raw Data Available At: http://www.ism.ws/ISMReport/index.cfm Release Time: 10:00 ET on the first business day of the month for the prior month. ISM: Institute for Supply Management formerly NAPM: National Association of Purchasing Managers In Brief The ISM report is a national survey of purchasing managers which covers such indicators as new orders, production, employment, inventories, delivery times, prices, export orders, and import orders. Diffusion indexes are produced for each of these categories, with a reading over 50% indicating expansion relative to the prior month, and a sub-50% reading indicating contraction. The total index is calculated based on a weighted average of the following five sub-indexes, with weights in parentheses: new orders (30%), production (25%), employment (20%), deliveries (15%), and inventories (10%). The ISM is one of the first comprehensive economic releases of the month, typically preceding the employment report. Though it covers only the manufacturing sector, it can often provide accurate hints regarding the tone of subsequent releases. During periods of inflation concerns, the prices paid and vendor deliveries indexes often determine the bond market's reaction to the report. In Depth The Institute for Supply Management's monthly Report on Business is probably the most widely watched economic indicator produced by the private sector. There are two key reasons for the ISM's prominence. First, its longevity - the report was first produced in 1931, and after a break during World War II, it has produced continuously since 1948. Second , its leading quality - the ISM has been one of the better predictors of the business cycle over the years. Who and What It Surveys The ISM index is the result of a monthly survey of over 400 companies in 20 industries throughout the 50 states. The survey queries respondents on a number of monthly indicators, including orders, production, employment, inventories, delivery times, prices paid, export orders, and import orders. Respondents are asked to characterize each indicator as higher, lower, or unchanged for the month (or faster/slower in the case of delivery times). They are not asked for specific numbers - only a thumbs up or down. Presenting the Numbers Based on these responses, the ISM calculates diffusion indexes for each of the components. These diffusion indexes are calculated by adding half of the percentage of respondents answering "unchanged" to the percentage answering "higher" (or "slower" for deliveries). These diffusion indexes do not yield estimates of specific magnitudes of strength or weakness, but the more respondents who are indicating trends in the same direction - the better the chance that the magnitude of that move is larger. A diffusion index of 50% is the theoretical breakeven mark - with readings above indicating strength and below indicating weakness. The ISM only provides the raw data - the Department of Commerce produces the seasonal factors which are used to provide more meaningful, seasonally adjusted indexes. The total index is not the result of a separate question regarding general business conditions (as is the case with the Philadelphia Fed index). Instead, the index is calculated using the weighted sum of five of the subindexes. Orders account for 30% of the total; production - 25%; employment - 20%; deliveries - 15%; inventories - 10%. Prices, export orders, and import orders are not part of the total index. Breakevens in Theory and Practice Though 50% is the breakeven mark in theory, different readings have proved to be breakeven in practice. For new orders, 50.3% is the level consistent with breakeven readings in factory orders. For production, 49.4% has been the breakeven mark in theory and practice. For employment, 47.5% has been consistent with a steady level of manufacturing employment. For inventories, 41.3% has been consistent with steady business inventory readings. And finally, the 42.7% mark on the total index marks the point below which the overall economy is believed to be in recession. Between 42.7-50%, the manufacturing sector may be in decline, but the total economy is only seeing slower growth. No Services This observation highlights the important element which is missing from the ISM index - the service sector. With the manufacturing sector making up an ever- shrinking percentage of the total economy - the ISM might seem to be an indicator in decline. Not so, however - the manufacturing sector, while shrinking in relative terms, still tends to lead the total economy into and out of recessions. The ISM therefore remains a closely watched indicator despite its manufacturing focus. A Proven Performer The ISM's leading quality has been proven over time. Its bottom during a recession has preceded the turning point for the business cycle by an average of four months, and its worst performance in leading the turning point was on two occasions when the ISM trough occurred in the same month as the business cycle trough. The ISM index is released on the first business day of each at 10:00 ET, with data for the prior calendar month. 03/08/09 07:55 Manufacturing PMI 46.0 42.6 Jul Country: EMU Source: Institute for Supply Management. Raw Data Available At: http://www.ism.ws/ISMReport/index.cfm Release Time: 10:00 ET on the first business day of the month for the prior month. ISM: Institute for Supply Management formerly NAPM: National Association of Purchasing Managers In Brief The ISM report is a national survey of purchasing managers which covers such indicators as new orders, production, employment, inventories, delivery times, prices, export orders, and import orders. Diffusion indexes are produced for each of these categories, with a reading over 50% indicating expansion relative to the prior month, and a sub-50% reading indicating contraction. The total index is calculated based on a weighted average of the following five sub-indexes, with weights in parentheses: new orders (30%), production (25%), employment (20%), deliveries (15%), and inventories (10%). The ISM is one of the first comprehensive economic releases of the month, typically preceding the employment report. Though it covers only the manufacturing sector, it can often provide accurate hints regarding the tone of subsequent releases. During periods of inflation concerns, the prices paid and vendor deliveries indexes often determine the bond market's reaction to the report. In Depth The Institute for Supply Management's monthly Report on Business is probably the most widely watched economic indicator produced by the private sector. There are two key reasons for the ISM's prominence. First, its longevity - the report was first produced in 1931, and after a break during World War II, it has produced continuously since 1948. Second , its leading quality - the ISM has been one of the better predictors of the business cycle over the years. Who and What It Surveys The ISM index is the result of a monthly survey of over 400 companies in 20 industries throughout the 50 states. The survey queries respondents on a number of monthly indicators, including orders, production, employment, inventories, delivery times, prices paid, export orders, and import orders. Respondents are asked to characterize each indicator as higher, lower, or unchanged for the month (or faster/slower in the case of delivery times). They are not asked for specific numbers - only a thumbs up or down. Presenting the Numbers Based on these responses, the ISM calculates diffusion indexes for each of the components. These diffusion indexes are calculated by adding half of the percentage of respondents answering "unchanged" to the percentage answering "higher" (or "slower" for deliveries). These diffusion indexes do not yield estimates of specific magnitudes of strength or weakness, but the more respondents who are indicating trends in the same direction - the better the chance that the magnitude of that move is larger. A diffusion index of 50% is the theoretical breakeven mark - with readings above indicating strength and below indicating weakness. The ISM only provides the raw data - the Department of Commerce produces the seasonal factors which are used to provide more meaningful, seasonally adjusted indexes. The total index is not the result of a separate question regarding general business conditions (as is the case with the Philadelphia Fed index). Instead, the index is calculated using the weighted sum of five of the subindexes. Orders account for 30% of the total; production - 25%; employment - 20%; deliveries - 15%; inventories - 10%. Prices, export orders, and import orders are not part of the total index. Breakevens in Theory and Practice Though 50% is the breakeven mark in theory, different readings have proved to be breakeven in practice. For new orders, 50.3% is the level consistent with breakeven readings in factory orders. For production, 49.4% has been the breakeven mark in theory and practice. For employment, 47.5% has been consistent with a steady level of manufacturing employment. For inventories, 41.3% has been consistent with steady business inventory readings. And finally, the 42.7% mark on the total index marks the point below which the overall economy is believed to be in recession. Between 42.7-50%, the manufacturing sector may be in decline, but the total economy is only seeing slower growth. No Services This observation highlights the important element which is missing from the ISM index - the service sector. With the manufacturing sector making up an ever- shrinking percentage of the total economy - the ISM might seem to be an indicator in decline. Not so, however - the manufacturing sector, while shrinking in relative terms, still tends to lead the total economy into and out of recessions. The ISM therefore remains a closely watched indicator despite its manufacturing focus. A Proven Performer The ISM's leading quality has been proven over time. Its bottom during a recession has preceded the turning point for the business cycle by an average of four months, and its worst performance in leading the turning point was on two occasions when the ISM trough occurred in the same month as the business cycle trough. The ISM index is released on the first business day of each at 10:00 ET, with data for the prior calendar month. 03/08/09 08:28 Manufacturing PMI 47.7 47.0 Jul Country: UK Source: Institute for Supply Management. Raw Data Available At: http://www.ism.ws/ISMReport/index.cfm Release Time: 10:00 ET on the first business day of the month for the prior month. ISM: Institute for Supply Management formerly NAPM: National Association of Purchasing Managers In Brief The ISM report is a national survey of purchasing managers which covers such indicators as new orders, production, employment, inventories, delivery times, prices, export orders, and import orders. Diffusion indexes are produced for each of these categories, with a reading over 50% indicating expansion relative to the prior month, and a sub-50% reading indicating contraction. The total index is calculated based on a weighted average of the following five sub-indexes, with weights in parentheses: new orders (30%), production (25%), employment (20%), deliveries (15%), and inventories (10%). The ISM is one of the first comprehensive economic releases of the month, typically preceding the employment report. Though it covers only the manufacturing sector, it can often provide accurate hints regarding the tone of subsequent releases. During periods of inflation concerns, the prices paid and vendor deliveries indexes often determine the bond market's reaction to the report. In Depth The Institute for Supply Management's monthly Report on Business is probably the most widely watched economic indicator produced by the private sector. There are two key reasons for the ISM's prominence. First, its longevity - the report was first produced in 1931, and after a break during World War II, it has produced continuously since 1948. Second , its leading quality - the ISM has been one of the better predictors of the business cycle over the years. Who and What It Surveys The ISM index is the result of a monthly survey of over 400 companies in 20 industries throughout the 50 states. The survey queries respondents on a number of monthly indicators, including orders, production, employment, inventories, delivery times, prices paid, export orders, and import orders. Respondents are asked to characterize each indicator as higher, lower, or unchanged for the month (or faster/slower in the case of delivery times). They are not asked for specific numbers - only a thumbs up or down. Presenting the Numbers Based on these responses, the ISM calculates diffusion indexes for each of the components. These diffusion indexes are calculated by adding half of the percentage of respondents answering "unchanged" to the percentage answering "higher" (or "slower" for deliveries). These diffusion indexes do not yield estimates of specific magnitudes of strength or weakness, but the more respondents who are indicating trends in the same direction - the better the chance that the magnitude of that move is larger. A diffusion index of 50% is the theoretical breakeven mark - with readings above indicating strength and below indicating weakness. The ISM only provides the raw data - the Department of Commerce produces the seasonal factors which are used to provide more meaningful, seasonally adjusted indexes. The total index is not the result of a separate question regarding general business conditions (as is the case with the Philadelphia Fed index). Instead, the index is calculated using the weighted sum of five of the subindexes. Orders account for 30% of the total; production - 25%; employment - 20%; deliveries - 15%; inventories - 10%. Prices, export orders, and import orders are not part of the total index. Breakevens in Theory and Practice Though 50% is the breakeven mark in theory, different readings have proved to be breakeven in practice. For new orders, 50.3% is the level consistent with breakeven readings in factory orders. For production, 49.4% has been the breakeven mark in theory and practice. For employment, 47.5% has been consistent with a steady level of manufacturing employment. For inventories, 41.3% has been consistent with steady business inventory readings. And finally, the 42.7% mark on the total index marks the point below which the overall economy is believed to be in recession. Between 42.7-50%, the manufacturing sector may be in decline, but the total economy is only seeing slower growth. No Services This observation highlights the important element which is missing from the ISM index - the service sector. With the manufacturing sector making up an ever- shrinking percentage of the total economy - the ISM might seem to be an indicator in decline. Not so, however - the manufacturing sector, while shrinking in relative terms, still tends to lead the total economy into and out of recessions. The ISM therefore remains a closely watched indicator despite its manufacturing focus. A Proven Performer The ISM's leading quality has been proven over time. Its bottom during a recession has preceded the turning point for the business cycle by an average of four months, and its worst performance in leading the turning point was on two occasions when the ISM trough occurred in the same month as the business cycle trough. The ISM index is released on the first business day of each at 10:00 ET, with data for the prior calendar month. 03/08/09 14:00 Construction Spending -0.6% -0.9% Jun Country: US Source: The Census Bureau of the Department of Commerce. Raw Data Available At: http://www.census.gov/const/www/c30index.html Release Time: 10:00 ET on the first business day of the month (data for two months prior). The construction spending report is broken down between residential, non- residential, and public expenditures on new construction. The monthly changes are both volatile and subject to huge revisions, so this report rarely has any market impact. Only trends extending over three months or more can be viewed as significant. The spending figures are in both nominal and real (inflation adjusted) dollars. The real figures for residential and nonresidential spending are used by economists to forecast the investment component of quarterly GDP. The annualized percent changes between the quarterly averages of these two components match up well with residential investment and commercial structure changes in the GDP accounts. 03/08/09 14:00 Manufacturing PMI 46.2 44.8 Jul Country: US Source: Institute for Supply Management. Raw Data Available At: http://www.ism.ws/ISMReport/index.cfm Release Time: 10:00 ET on the first business day of the month for the prior month. ISM: Institute for Supply Management formerly NAPM: National Association of Purchasing Managers In Brief The ISM report is a national survey of purchasing managers which covers such indicators as new orders, production, employment, inventories, delivery times, prices, export orders, and import orders. Diffusion indexes are produced for each of these categories, with a reading over 50% indicating expansion relative to the prior month, and a sub-50% reading indicating contraction. The total index is calculated based on a weighted average of the following five sub-indexes, with weights in parentheses: new orders (30%), production (25%), employment (20%), deliveries (15%), and inventories (10%). The ISM is one of the first comprehensive economic releases of the month, typically preceding the employment report. Though it covers only the manufacturing sector, it can often provide accurate hints regarding the tone of subsequent releases. During periods of inflation concerns, the prices paid and vendor deliveries indexes often determine the bond market's reaction to the report. In Depth The Institute for Supply Management's monthly Report on Business is probably the most widely watched economic indicator produced by the private sector. There are two key reasons for the ISM's prominence. First, its longevity - the report was first produced in 1931, and after a break during World War II, it has produced continuously since 1948. Second , its leading quality - the ISM has been one of the better predictors of the business cycle over the years. Who and What It Surveys The ISM index is the result of a monthly survey of over 400 companies in 20 industries throughout the 50 states. The survey queries respondents on a number of monthly indicators, including orders, production, employment, inventories, delivery times, prices paid, export orders, and import orders. Respondents are asked to characterize each indicator as higher, lower, or unchanged for the month (or faster/slower in the case of delivery times). They are not asked for specific numbers - only a thumbs up or down. Presenting the Numbers Based on these responses, the ISM calculates diffusion indexes for each of the components. These diffusion indexes are calculated by adding half of the percentage of respondents answering "unchanged" to the percentage answering "higher" (or "slower" for deliveries). These diffusion indexes do not yield estimates of specific magnitudes of strength or weakness, but the more respondents who are indicating trends in the same direction - the better the chance that the magnitude of that move is larger. A diffusion index of 50% is the theoretical breakeven mark - with readings above indicating strength and below indicating weakness. The ISM only provides the raw data - the Department of Commerce produces the seasonal factors which are used to provide more meaningful, seasonally adjusted indexes. The total index is not the result of a separate question regarding general business conditions (as is the case with the Philadelphia Fed index). Instead, the index is calculated using the weighted sum of five of the subindexes. Orders account for 30% of the total; production - 25%; employment - 20%; deliveries - 15%; inventories - 10%. Prices, export orders, and import orders are not part of the total index. Breakevens in Theory and Practice Though 50% is the breakeven mark in theory, different readings have proved to be breakeven in practice. For new orders, 50.3% is the level consistent with breakeven readings in factory orders. For production, 49.4% has been the breakeven mark in theory and practice. For employment, 47.5% has been consistent with a steady level of manufacturing employment. For inventories, 41.3% has been consistent with steady business inventory readings. And finally, the 42.7% mark on the total index marks the point below which the overall economy is believed to be in recession. Between 42.7-50%, the manufacturing sector may be in decline, but the total economy is only seeing slower growth. No Services This observation highlights the important element which is missing from the ISM index - the service sector. With the manufacturing sector making up an ever- shrinking percentage of the total economy - the ISM might seem to be an indicator in decline. Not so, however - the manufacturing sector, while shrinking in relative terms, still tends to lead the total economy into and out of recessions. The ISM therefore remains a closely watched indicator despite its manufacturing focus. A Proven Performer The ISM's leading quality has been proven over time. Its bottom during a recession has preceded the turning point for the business cycle by an average of four months, and its worst performance in leading the turning point was on two occasions when the ISM trough occurred in the same month as the business cycle trough. The ISM index is released on the first business day of each at 10:00 ET, with data for the prior calendar month. 04/08/09 01:30 House Prices 2.0% -2.2% Q2 Country: Australia 04/08/09 01:30 Retail Sales mm 0.6% 1.0% Jun Country: Australia Source: The Census Bureau of the Department of Commerce. Raw Data Available At: http://www.census.gov/svsd/www/advtable.html Release Time: 8:30 ET around the 13th of the month (data for one month prior). The retail sales report is a measure of the total receipts of retail stores. The changes in retail sales are widely followed as the most timely indicator of broad consumer spending patterns. Retail sales are often viewed ex-autos, as auto sales can move sharply from month-to-month. It is also important to keep an eye on the gas and food components, where changes in sales are often a result of price changes rather than shifting consumer demand. Retail sales can be quite volatile and the advance reports are subject to rather large revisions. Retail sales do not include spending on services, which makes up over half of total consumption. Total personal consumption is not available until the personal income and consumption reports are released, typically two weeks after retail sales. 04/08/09 04:30 Interest Rate Decision 3.00% 3.00% Aug Country: Australia Source (U.S.): The Federal Reserve Open Market Committee - FOMC. Source (World): The Central Bank Monetary Policy Committee - MPC. The Federal Open Market Committee is a twelve-member committee made up of the seven members of the Board of Governors and five Federal Reserve Bank presidents. It meets eight times per year to determine the near-term direction of monetary policy, such as setting guidelines for the purchase and sale of government securities and setting policy relating to System operations in the foreign exchange markets. These changes in monetary policy are now announced immediately after FOMC meetings. Most importantly, the Fed determines interest rate policy at FOMC meetings. Market participants speculate about the possibility of an interest rate change at these meetings, and if the outcome is different from expectations, the impact on the markets can be dramatic and far-reaching. The interest rate set by the Fed the federal funds rate serves as a benchmark for all other rates. A change in the fed funds rate, the lending rate banks charge each other for the use of overnight funds, translates directly through to all other interest rates from Treasury bonds to mortgage loans. It also changes the dynamics of competition for investor dollars: when bonds yield 10 percent, they will attract more money away from stocks then when they only yield 5 percent. The level of interest rates affects the economy­ higher rates tend to slow activity; lower rates stimulate activity, a ripple effect that expands into all sectors of the economy. 04/08/09 07:15 Consumer Price Index (CPI) mm -0.5% 0.2% Jul Country: Switzerland Source: Bureau of Labor statistics, U.S. Department of Labor. Raw Data Available At: http://stats.bls.gov/news.release/cpi.toc.htm Release Time: 8:30 ET, about the 13th of each month for the prior month. The Consumer Price Index is a measure of the price level of a fixed market basket of goods and services purchased by consumers. CPI is the most widely cited inflation indicator, and it is used to calculate cost of living adjustments for government programs and it is the basis of COLAs for many private labor agreements as well. It has been criticized for overstating inflation, because it does not adjust for substitution effects and because the fixed basket does not reflect price changes in new technology goods which are often declining in price. Despite these criticisms, it remains the benchmark inflation index. 04/08/09 07:15 Consumer Price Index (CPI) mm -1.0% -1.0% Jul Country: Switzerland Source: Bureau of Labor statistics, U.S. Department of Labor. Raw Data Available At: http://stats.bls.gov/news.release/cpi.toc.htm Release Time: 8:30 ET, about the 13th of each month for the prior month. The Consumer Price Index is a measure of the price level of a fixed market basket of goods and services purchased by consumers. CPI is the most widely cited inflation indicator, and it is used to calculate cost of living adjustments for government programs and it is the basis of COLAs for many private labor agreements as well. It has been criticized for overstating inflation, because it does not adjust for substitution effects and because the fixed basket does not reflect price changes in new technology goods which are often declining in price. Despite these criticisms, it remains the benchmark inflation index. 04/08/09 09:00 Core PPI mm 0.2% -0.2% Jun Country: EMU Source: Bureau of Labor statistics, U.S. Department of Labor. Raw Data Available At: http://stats.bls.gov/news.release/ppi.toc.htm Release Time: Around the 11th of each month at 8:30 ET for the prior month. The Producer Price Index measures prices of goods at the wholesale level. There are three broad subcategories within PPI: crude, intermediate, and finished. The market tracks the finished goods index most closely, as it represents prices for goods that are ready for sale to the end user. Goods prices at the crude and intermediate stages of production often provide an indication of coming (dis)inflationary pressures, but the closer you get to crude goods, the more that these prices track commodity prices which are already available in traded indexes such as the CRB (Commodity Research Bureau). At all stages of production, the market places more emphasis on the index excluding food and energy, referred to as the core rate. Food and energy prices tend to be quite volatile and obscure trends in the underlying inflation rate. Though the market reaction is determined by the month/month changes, year/year changes are also noted by analysts. The index is not revised on a monthly basis, but annual revisions to seasonal adjustment factors can produce small adjustments to past releases. 04/08/09 09:00 Core PPI yy -6.6% -5.8% Jun Country: EMU Source: Bureau of Labor statistics, U.S. Department of Labor. Raw Data Available At: http://stats.bls.gov/news.release/ppi.toc.htm Release Time: Around the 11th of each month at 8:30 ET for the prior month. The Producer Price Index measures prices of goods at the wholesale level. There are three broad subcategories within PPI: crude, intermediate, and finished. The market tracks the finished goods index most closely, as it represents prices for goods that are ready for sale to the end user. Goods prices at the crude and intermediate stages of production often provide an indication of coming (dis)inflationary pressures, but the closer you get to crude goods, the more that these prices track commodity prices which are already available in traded indexes such as the CRB (Commodity Research Bureau). At all stages of production, the market places more emphasis on the index excluding food and energy, referred to as the core rate. Food and energy prices tend to be quite volatile and obscure trends in the underlying inflation rate. Though the market reaction is determined by the month/month changes, year/year changes are also noted by analysts. The index is not revised on a monthly basis, but annual revisions to seasonal adjustment factors can produce small adjustments to past releases. 04/08/09 12:30 Core PCE mm 0.2% 0.1% Jun Country: US Source: The Bureau of Economic Analysis of the Department of Commerce. Raw Data Available At: http://www.bea.doc.gov/bea/rels.htm Release Time: 8:30 ET around the first business day of the month (data for two months prior). Personal income measures income from all sources. The largest component of total income is wages and salaries, a figure which can be estimated using payrolls and earnings data from the employment report. Beyond that, there are many other categories of income, including rental income, government subsidy payments, interest income, and dividend income. Personal income is a decent indicator of future consumer demand, but it is not perfect. Recessions usually occur when consumers stop spending, which then drives down income growth. Looking solely at income growth, one may therefore miss the turning point when consumers stop spending. The income report also includes a section covering personal consumption expenditures, also known as PCE. PCE is comprised of three categories: durables, nondurables, and services. The retail sales report will provide a good read on durable and nondurable consumption, while service purchases tend to grow at a fairly steady pace, making this a relatively predictable report, and ranking it well below retail sales in terms of market importance. 04/08/09 12:30 Core PCE yy 1.8% Jun Country: US Source: The Bureau of Economic Analysis of the Department of Commerce. Raw Data Available At: http://www.bea.doc.gov/bea/rels.htm Release Time: 8:30 ET around the first business day of the month (data for two months prior). Personal income measures income from all sources. The largest component of total income is wages and salaries, a figure which can be estimated using payrolls and earnings data from the employment report. Beyond that, there are many other categories of income, including rental income, government subsidy payments, interest income, and dividend income. Personal income is a decent indicator of future consumer demand, but it is not perfect. Recessions usually occur when consumers stop spending, which then drives down income growth. Looking solely at income growth, one may therefore miss the turning point when consumers stop spending. The income report also includes a section covering personal consumption expenditures, also known as PCE. PCE is comprised of three categories: durables, nondurables, and services. The retail sales report will provide a good read on durable and nondurable consumption, while service purchases tend to grow at a fairly steady pace, making this a relatively predictable report, and ranking it well below retail sales in terms of market importance. 04/08/09 12:30 Personal Consumption Exp. mm 0.1% Jun Country: US Source: The Bureau of Economic Analysis of the Department of Commerce. Raw Data Available At: http://www.bea.doc.gov/bea/rels.htm Release Time: 8:30 ET around the first business day of the month (data for two months prior). Personal income measures income from all sources. The largest component of total income is wages and salaries, a figure which can be estimated using payrolls and earnings data from the employment report. Beyond that, there are many other categories of income, including rental income, government subsidy payments, interest income, and dividend income. Personal income is a decent indicator of future consumer demand, but it is not perfect. Recessions usually occur when consumers stop spending, which then drives down income growth. Looking solely at income growth, one may therefore miss the turning point when consumers stop spending. The income report also includes a section covering personal consumption expenditures, also known as PCE. PCE is comprised of three categories: durables, nondurables, and services. The retail sales report will provide a good read on durable and nondurable consumption, while service purchases tend to grow at a fairly steady pace, making this a relatively predictable report, and ranking it well below retail sales in terms of market importance. 04/08/09 12:30 Personal Consumption Exp. yy 0.1% Jun Country: US Source: The Bureau of Economic Analysis of the Department of Commerce. Raw Data Available At: http://www.bea.doc.gov/bea/rels.htm Release Time: 8:30 ET around the first business day of the month (data for two months prior). Personal income measures income from all sources. The largest component of total income is wages and salaries, a figure which can be estimated using payrolls and earnings data from the employment report. Beyond that, there are many other categories of income, including rental income, government subsidy payments, interest income, and dividend income. Personal income is a decent indicator of future consumer demand, but it is not perfect. Recessions usually occur when consumers stop spending, which then drives down income growth. Looking solely at income growth, one may therefore miss the turning point when consumers stop spending. The income report also includes a section covering personal consumption expenditures, also known as PCE. PCE is comprised of three categories: durables, nondurables, and services. The retail sales report will provide a good read on durable and nondurable consumption, while service purchases tend to grow at a fairly steady pace, making this a relatively predictable report, and ranking it well below retail sales in terms of market importance. 04/08/09 12:30 Personal Consumption 0.3% 0.3% Jun Country: US 04/08/09 12:30 Personal Income -1.0% 1.4% Jun Country: US Source: The Bureau of Economic Analysis of the Department of Commerce. Raw Data Available At: http://www.bea.doc.gov/bea/rels.htm Release Time: 8:30 ET around the first business day of the month (data for two months prior). Personal income measures income from all sources. The largest component of total income is wages and salaries, a figure which can be estimated using payrolls and earnings data from the employment report. Beyond that, there are many other categories of income, including rental income, government subsidy payments, interest income, and dividend income. Personal income is a decent indicator of future consumer demand, but it is not perfect. Recessions usually occur when consumers stop spending, which then drives down income growth. Looking solely at income growth, one may therefore miss the turning point when consumers stop spending. The income report also includes a section covering personal consumption expenditures, also known as PCE. PCE is comprised of three categories: durables, nondurables, and services. The retail sales report will provide a good read on durable and nondurable consumption, while service purchases tend to grow at a fairly steady pace, making this a relatively predictable report, and ranking it well below retail sales in terms of market importance. 04/08/09 14:00 Pending Homes Sales 0.2% 0.1% Jun Country: US 04/08/09 23:00 Consumer Confidence 58.0 Jul Country: UK Source: The Conference Board. Raw Data Available At: http://www.tcb-indicators.org/ Release Time: 10:00 ET on the last Tuesday of the month (data for current month). This survey measures the level of confidence individual households have in the performance of the economy now and in the future. It is a leading indicator of future spending and the business cycle. 5000 consumers in the nine census divisions across the country are surveyed each month. The level of consumer confidence is directly correlated to the strength of consumer spending, which accounts for two-thirds of the economy. It also correlates closely with joblessness, inflation, and real incomes. The report can occasionally be helpful in predicting sudden shifts in consumption patterns, though most small changes in the index are just noise. Only index changes of at least five points should be considered significant. The index consists of two subindexes - consumers' appraisal of current conditions and their expectations for the future. Expectations make up 60% of the total index, with current conditions accounting for the other 40%. The expectations index is typically seen as having better leading indicator qualities than the current conditions index. The more confident consumers are about the economy and their own personal finances, the more likely they are to spend. Note, changes in consumer confidence and retail sales do not move in tandem month by month. If the economy experiences a long-term expansion, buying intentions may decline even while the jobless rate declines because of the satisfaction of pent-up demand. Conversely, if inflation begins to accelerate, spending plans may increase for the short-term as consumers buy now to avoid having to pay higher prices later. Regional differences in consumer confidence are an indication of differing business cycles across the nation. This has implications for spending on durable goods and, more importantly, for residential real estate markets. Financial markets interpret rising consumer confidence as a precursor to higher consumer spending. Higher consumer spending could in turn spark inflation. Look for a change in the direction of the six month moving average of the index. Consumers do not usually have the necessary information to accurately assess income and job growth six months in the future. The report provides information on planned spending, which does not necessarily turn into actual spending, although it is unlikely that increasing consumer confidence would be followed by a decline in spending. The Consumer Confidence survey is not useful for any type of forecasting. 05/08/09 01:30 International Trade Balance yy -800m -556m Jun Country: Australia Source: The Census Bureau and the Bureau of Economic Analysis of the Department of Commerce. Raw Data Available At: http://www.census.gov/foreign-trade/www/press.html Release Time: 8:30 ET around the 20th of the month (data for two months prior). The trade report is most widely watched for trends in the overall trade balance. But trends in both exports and imports of goods and services bear watching as well. The export data in particular are important to watch for indications that a strengthening competitive position at home and/or strengthening economies overseas are boosting U.S. growth. Imports provide an indication of domestic demand, but given the severe lag of this report relative to other consumption indicators, it is not particularly valuable for this purpose. The volatility in the monthly trade balance can play an important role in GDP forecasts. Net exports are a relatively volatile component of GDP, and the trade report provides the only early clues to the net export performance each quarter. 05/08/09 07:53 Services PMI 48.4 45.2 Jul Country: Germany Source: Institute for Supply Management. Raw Data Available At: http://www.ism.ws/ISMReport/index.cfm Release Time: 10:00 ET on the first business day of the month for the prior month. ISM: Institute for Supply Management formerly NAPM: National Association of Purchasing Managers In Brief The ISM report is a national survey of purchasing managers which covers such indicators as new orders, production, employment, inventories, delivery times, prices, export orders, and import orders. Diffusion indexes are produced for each of these categories, with a reading over 50% indicating expansion relative to the prior month, and a sub-50% reading indicating contraction. The total index is calculated based on a weighted average of the following five sub-indexes, with weights in parentheses: new orders (30%), production (25%), employment (20%), deliveries (15%), and inventories (10%). The ISM is one of the first comprehensive economic releases of the month, typically preceding the employment report. Though it covers only the manufacturing sector, it can often provide accurate hints regarding the tone of subsequent releases. During periods of inflation concerns, the prices paid and vendor deliveries indexes often determine the bond market's reaction to the report. In Depth The Institute for Supply Management's monthly Report on Business is probably the most widely watched economic indicator produced by the private sector. There are two key reasons for the ISM's prominence. First, its longevity - the report was first produced in 1931, and after a break during World War II, it has produced continuously since 1948. Second , its leading quality - the ISM has been one of the better predictors of the business cycle over the years. More than 370 purchasing and supply management professionals in the non- manufacturing sector participate in the survey by completing a monthly questionnaire covering Business Activity, New Orders, Backlog of Orders, New Export Orders, Inventory Change, Inventory Sentiment, Imports, Prices, Employment, and Supplier Deliveries. The respondents are from more than 60 different sectors representing nine divisions from the Standard Industrial Code classification system including Agriculture, Forestry, & Fisheries; Mining; Construction; Transportation, Communications, Electric, Gas, and Sanitary Services; Wholesale Trade; Retail Trade; Finance, Insurance & Real Estate; Services; and Public Administration. Geographic location is also a consideration The results of the responses are compiled in the Non-Manufacturing NAPM Report on Business®by Ralph G. Kauffman, Ph.D., C.P.M, chair of the Non- Manufacturing Business Survey Committee. Following the initial release, this new report will be issued on the third business day of each month at 10:00 a.m. eastern Time via Business Wire and Xpedite Broadcast Fax. The National Association of Purchasing Management is a not-for-profit association that provides national and international leadership in purchasing and supply management research and education. NAPM provides its more than 44,000 members in its 180 affiliated associations with opportunities to expand their professional skills and knowledge. 05/08/09 07:58 Services PMI 45.6 44.7 Jul Country: EMU Source: Institute for Supply Management. Raw Data Available At: http://www.ism.ws/ISMReport/index.cfm Release Time: 10:00 ET on the first business day of the month for the prior month. ISM: Institute for Supply Management formerly NAPM: National Association of Purchasing Managers In Brief The ISM report is a national survey of purchasing managers which covers such indicators as new orders, production, employment, inventories, delivery times, prices, export orders, and import orders. Diffusion indexes are produced for each of these categories, with a reading over 50% indicating expansion relative to the prior month, and a sub-50% reading indicating contraction. The total index is calculated based on a weighted average of the following five sub-indexes, with weights in parentheses: new orders (30%), production (25%), employment (20%), deliveries (15%), and inventories (10%). The ISM is one of the first comprehensive economic releases of the month, typically preceding the employment report. Though it covers only the manufacturing sector, it can often provide accurate hints regarding the tone of subsequent releases. During periods of inflation concerns, the prices paid and vendor deliveries indexes often determine the bond market's reaction to the report. In Depth The Institute for Supply Management's monthly Report on Business is probably the most widely watched economic indicator produced by the private sector. There are two key reasons for the ISM's prominence. First, its longevity - the report was first produced in 1931, and after a break during World War II, it has produced continuously since 1948. Second , its leading quality - the ISM has been one of the better predictors of the business cycle over the years. More than 370 purchasing and supply management professionals in the non- manufacturing sector participate in the survey by completing a monthly questionnaire covering Business Activity, New Orders, Backlog of Orders, New Export Orders, Inventory Change, Inventory Sentiment, Imports, Prices, Employment, and Supplier Deliveries. The respondents are from more than 60 different sectors representing nine divisions from the Standard Industrial Code classification system including Agriculture, Forestry, & Fisheries; Mining; Construction; Transportation, Communications, Electric, Gas, and Sanitary Services; Wholesale Trade; Retail Trade; Finance, Insurance & Real Estate; Services; and Public Administration. Geographic location is also a consideration The results of the responses are compiled in the Non-Manufacturing NAPM Report on Business®by Ralph G. Kauffman, Ph.D., C.P.M, chair of the Non- Manufacturing Business Survey Committee. Following the initial release, this new report will be issued on the third business day of each month at 10:00 a.m. eastern Time via Business Wire and Xpedite Broadcast Fax. The National Association of Purchasing Management is a not-for-profit association that provides national and international leadership in purchasing and supply management research and education. NAPM provides its more than 44,000 members in its 180 affiliated associations with opportunities to expand their professional skills and knowledge. 05/08/09 08:28 Services PMI 51.8 51.6 Jul Country: UK Source: Institute for Supply Management. Raw Data Available At: http://www.ism.ws/ISMReport/index.cfm Release Time: 10:00 ET on the first business day of the month for the prior month. ISM: Institute for Supply Management formerly NAPM: National Association of Purchasing Managers In Brief The ISM report is a national survey of purchasing managers which covers such indicators as new orders, production, employment, inventories, delivery times, prices, export orders, and import orders. Diffusion indexes are produced for each of these categories, with a reading over 50% indicating expansion relative to the prior month, and a sub-50% reading indicating contraction. The total index is calculated based on a weighted average of the following five sub-indexes, with weights in parentheses: new orders (30%), production (25%), employment (20%), deliveries (15%), and inventories (10%). The ISM is one of the first comprehensive economic releases of the month, typically preceding the employment report. Though it covers only the manufacturing sector, it can often provide accurate hints regarding the tone of subsequent releases. During periods of inflation concerns, the prices paid and vendor deliveries indexes often determine the bond market's reaction to the report. In Depth The Institute for Supply Management's monthly Report on Business is probably the most widely watched economic indicator produced by the private sector. There are two key reasons for the ISM's prominence. First, its longevity - the report was first produced in 1931, and after a break during World War II, it has produced continuously since 1948. Second , its leading quality - the ISM has been one of the better predictors of the business cycle over the years. More than 370 purchasing and supply management professionals in the non- manufacturing sector participate in the survey by completing a monthly questionnaire covering Business Activity, New Orders, Backlog of Orders, New Export Orders, Inventory Change, Inventory Sentiment, Imports, Prices, Employment, and Supplier Deliveries. The respondents are from more than 60 different sectors representing nine divisions from the Standard Industrial Code classification system including Agriculture, Forestry, & Fisheries; Mining; Construction; Transportation, Communications, Electric, Gas, and Sanitary Services; Wholesale Trade; Retail Trade; Finance, Insurance & Real Estate; Services; and Public Administration. Geographic location is also a consideration The results of the responses are compiled in the Non-Manufacturing NAPM Report on Business®by Ralph G. Kauffman, Ph.D., C.P.M, chair of the Non- Manufacturing Business Survey Committee. Following the initial release, this new report will be issued on the third business day of each month at 10:00 a.m. eastern Time via Business Wire and Xpedite Broadcast Fax. The National Association of Purchasing Management is a not-for-profit association that provides national and international leadership in purchasing and supply management research and education. NAPM provides its more than 44,000 members in its 180 affiliated associations with opportunities to expand their professional skills and knowledge. 05/08/09 08:30 Industrial Production mm 0.0% -0.6% Jun Country: UK Source: Federal Reserve. Raw Data Available At: http://www.federalreserve.gov/releases/G17/Current/g17.txt Release Time: 9:15 ET around the 15th of the month (data for month prior). The index of Industrial Production is a fixed-weight measure of the physical output of the nation's factories, mines, and utilities. Manufacturing production, the largest component of the total, can be accurately predicted using total manufacturing hours worked from the employment report. One of the bigger wildcards in this report is utility production, which can be quite volatile due to swings in the weather. Severe hot or cold spells can boost production as increased heating/cooling needs drive utility production up. In addition to production, this monthly report also provides a measure of capacity utilization. Though the rate of capacity utilization is seen as a critical gauge of the slack available in the economy, the market does not completely trust this measure. Capacity is very difficult to measure, and the Fed essentially assumes that growth in capacity in any given year follows a straight line. One can therefore predict the capacity utilization rate quite accurately based on the assumption for production growth. The 85% mark is seen as a key barrier over which inflationary pressures are generated, but given revisions to these data and the difficulties with capacity measurement, the 85% mark should be viewed cautiously. It would be appropriate to look for corroborating inflation indications from commodity prices and vendor deliveries. 05/08/09 08:30 Industrial Production yy -11.4% 11.9% Jun Country: UK Source: Federal Reserve. Raw Data Available At: http://www.federalreserve.gov/releases/G17/Current/g17.txt Release Time: 9:15 ET around the 15th of the month (data for month prior). The index of Industrial Production is a fixed-weight measure of the physical output of the nation's factories, mines, and utilities. Manufacturing production, the largest component of the total, can be accurately predicted using total manufacturing hours worked from the employment report. One of the bigger wildcards in this report is utility production, which can be quite volatile due to swings in the weather. Severe hot or cold spells can boost production as increased heating/cooling needs drive utility production up. In addition to production, this monthly report also provides a measure of capacity utilization. Though the rate of capacity utilization is seen as a critical gauge of the slack available in the economy, the market does not completely trust this measure. Capacity is very difficult to measure, and the Fed essentially assumes that growth in capacity in any given year follows a straight line. One can therefore predict the capacity utilization rate quite accurately based on the assumption for production growth. The 85% mark is seen as a key barrier over which inflationary pressures are generated, but given revisions to these data and the difficulties with capacity measurement, the 85% mark should be viewed cautiously. It would be appropriate to look for corroborating inflation indications from commodity prices and vendor deliveries. 05/08/09 09:00 Core Retail Sales mm 0.4% -0.4% Jun Country: EMU Source: The Census Bureau of the Department of Commerce. Raw Data Available At: http://www.census.gov/svsd/www/advtable.html Release Time: 8:30 ET around the 13th of the month (data for one month prior). The retail sales report is a measure of the total receipts of retail stores. The changes in retail sales are widely followed as the most timely indicator of broad consumer spending patterns. Retail sales are often viewed ex-autos, as auto sales can move sharply from month-to-month. It is also important to keep an eye on the gas and food components, where changes in sales are often a result of price changes rather than shifting consumer demand. 05/08/09 09:00 Core Retail Sales yy -3.3% -2.0% Jun Country: EMU Source: The Census Bureau of the Department of Commerce. Raw Data Available At: http://www.census.gov/svsd/www/advtable.html Release Time: 8:30 ET around the 13th of the month (data for one month prior). The retail sales report is a measure of the total receipts of retail stores. The changes in retail sales are widely followed as the most timely indicator of broad consumer spending patterns. Retail sales are often viewed ex-autos, as auto sales can move sharply from month-to-month. It is also important to keep an eye on the gas and food components, where changes in sales are often a result of price changes rather than shifting consumer demand. 05/08/09 12:15 ADP employment -340k -473k Jun Country: US 05/08/09 12:30 Factory Orders yy 0.2% 1.2% Jun Country: US Source: The Census Bureau of the Department of Commerce. Raw Data Available At: http://www.census.gov/ftp/pub/indicator/www/m3/index.htm Release Time: 10:00 ET around the first business day of the month (data for two months prior). Factory orders consist of the earlier announced durable goods report plus non- durable goods orders. The report is very predictable with nondurables the only new component. Nondurables consist of such items as food and tobacco products which grow at a fairly consistent monthly rate, so that market forecasts for this report are far more accurate than for the durable orders report. In addition to seeing nondurables for the first time, the market also watches for revisions to the durable orders data, which can be significant. At present, durable goods orders sum to about 54% of total orders. The final piece of new information in this report is factory inventories -- the first glimpse at the inventory picture each month (wholesales inventories are typically released a week later, with retail inventories released a few days after wholesale inventories). Though the inventory figure is not a market-mover, economists use this number to help forecast inventories in the quarterly GDP report. 05/08/09 14:00 Durable Goods Orders -2.5% Jun Country: US Source: The Census Bureau of the Department of Commerce. Raw Data Available At: http://www.census.gov/ftp/pub/indicator/www/m3/index.htm Release Time: 8:30 ET around the 26th of the month (data for month prior). The durable orders release measures the dollar volume of orders, shipments, and unfilled orders of durable goods (defined as goods whose intended lifespan is three years or more). Orders are considered a leading indicator of manufacturing activity, and the market often moves on this report despite the volatility and large revisions that make it a less than perfect indicator. These problems can be minimized by looking at the breakdown of orders. The total number is often skewed by huge increases in aircraft and defense orders. An increase based solely on strength in one sector tends to be discounted, while the market is more impressed with broadbased increases in orders. Also notable in this report is the narrow category of nondefense capital goods. These goods mirror the GDP category producers' durable equipment (PDE) -- the largest component of business investment. Shipments of nondefense capital goods are a good proxy for PDE in the current quarter, while nondefense capital goods orders provide an indication of PDE growth in the quarters ahead. 05/08/09 14:00 New orders XD -0.7% Jun Country: US Source: The Census Bureau of the Department of Commerce. Raw Data Available At: http://www.census.gov/ftp/pub/indicator/www/m3/index.htm Release Time: 8:30 ET around the 26th of the month (data for month prior). The durable orders release measures the dollar volume of orders, shipments, and unfilled orders of durable goods (defined as goods whose intended lifespan is three years or more). Orders are considered a leading indicator of manufacturing activity, and the market often moves on this report despite the volatility and large revisions that make it a less than perfect indicator. These problems can be minimized by looking at the breakdown of orders. The total number is often skewed by huge increases in aircraft and defense orders. An increase based solely on strength in one sector tends to be discounted, while the market is more impressed with broadbased increases in orders. Also notable in this report is the narrow category of nondefense capital goods. These goods mirror the GDP category producers' durable equipment (PDE) -- the largest component of business investment. Shipments of nondefense capital goods are a good proxy for PDE in the current quarter, while nondefense capital goods orders provide an indication of PDE growth in the quarters ahead. 05/08/09 14:00 Manufacturing PMI 48.2 47.0 Jul Country: US Source: Institute for Supply Management. Raw Data Available At: http://www.ism.ws/ISMReport/index.cfm Release Time: 10:00 ET on the first business day of the month for the prior month. ISM: Institute for Supply Management formerly NAPM: National Association of Purchasing Managers In Brief The ISM report is a national survey of purchasing managers which covers such indicators as new orders, production, employment, inventories, delivery times, prices, export orders, and import orders. Diffusion indexes are produced for each of these categories, with a reading over 50% indicating expansion relative to the prior month, and a sub-50% reading indicating contraction. The total index is calculated based on a weighted average of the following five sub-indexes, with weights in parentheses: new orders (30%), production (25%), employment (20%), deliveries (15%), and inventories (10%). The ISM is one of the first comprehensive economic releases of the month, typically preceding the employment report. Though it covers only the manufacturing sector, it can often provide accurate hints regarding the tone of subsequent releases. During periods of inflation concerns, the prices paid and vendor deliveries indexes often determine the bond market's reaction to the report. In Depth The Institute for Supply Management's monthly Report on Business is probably the most widely watched economic indicator produced by the private sector. There are two key reasons for the ISM's prominence. First, its longevity - the report was first produced in 1931, and after a break during World War II, it has produced continuously since 1948. Second , its leading quality - the ISM has been one of the better predictors of the business cycle over the years. Who and What It Surveys The ISM index is the result of a monthly survey of over 400 companies in 20 industries throughout the 50 states. The survey queries respondents on a number of monthly indicators, including orders, production, employment, inventories, delivery times, prices paid, export orders, and import orders. Respondents are asked to characterize each indicator as higher, lower, or unchanged for the month (or faster/slower in the case of delivery times). They are not asked for specific numbers - only a thumbs up or down. Presenting the Numbers Based on these responses, the ISM calculates diffusion indexes for each of the components. These diffusion indexes are calculated by adding half of the percentage of respondents answering "unchanged" to the percentage answering "higher" (or "slower" for deliveries). These diffusion indexes do not yield estimates of specific magnitudes of strength or weakness, but the more respondents who are indicating trends in the same direction - the better the chance that the magnitude of that move is larger. A diffusion index of 50% is the theoretical breakeven mark - with readings above indicating strength and below indicating weakness. The ISM only provides the raw data - the Department of Commerce produces the seasonal factors which are used to provide more meaningful, seasonally adjusted indexes. The total index is not the result of a separate question regarding general business conditions (as is the case with the Philadelphia Fed index). Instead, the index is calculated using the weighted sum of five of the subindexes. Orders account for 30% of the total; production - 25%; employment - 20%; deliveries - 15%; inventories - 10%. Prices, export orders, and import orders are not part of the total index. Breakevens in Theory and Practice Though 50% is the breakeven mark in theory, different readings have proved to be breakeven in practice. For new orders, 50.3% is the level consistent with breakeven readings in factory orders. For production, 49.4% has been the breakeven mark in theory and practice. For employment, 47.5% has been consistent with a steady level of manufacturing employment. For inventories, 41.3% has been consistent with steady business inventory readings. And finally, the 42.7% mark on the total index marks the point below which the overall economy is believed to be in recession. Between 42.7-50%, the manufacturing sector may be in decline, but the total economy is only seeing slower growth. No Services This observation highlights the important element which is missing from the ISM index - the service sector. With the manufacturing sector making up an ever- shrinking percentage of the total economy - the ISM might seem to be an indicator in decline. Not so, however - the manufacturing sector, while shrinking in relative terms, still tends to lead the total economy into and out of recessions. The ISM therefore remains a closely watched indicator despite its manufacturing focus. A Proven Performer The ISM's leading quality has been proven over time. Its bottom during a recession has preceded the turning point for the business cycle by an average of four months, and its worst performance in leading the turning point was on two occasions when the ISM trough occurred in the same month as the business cycle trough. The ISM index is released on the first business day of each at 10:00 ET, with data for the prior calendar month. 05/08/09 22:45 Unemployment Rate 5.6% 5.0% Q2 Country: NewZealand Source: Bureau of Labor Statistics, U.S. Department of Labor. Raw Data Available At: http://stats.bls.gov/news.release/empsit.toc.htm Release Time: First Friday of the month at 8:30 ET for the prior month. In Brief The employment report is actually two separate reports which are the results of two separate surveys. The household survey is a survey of roughly 60,000 households. This survey produces the unemployment rate. The establishment survey is a survey of 375,000 businesses. This survey produces the nonfarm payrolls, average workweek, and average hourly earnings figures, to name a few. Both surveys cover the payroll period which includes the 12th of each month. The reports both measure employment levels, just from different angles. Due to the vastly different size of the survey samples (the establishment survey not only surveys more businesses, but each business employs many individuals), the measures of employment may differ markedly from month to month. The household survey is used only for the unemployment measure - the market focusses primarily on the more comprehensive establishment survey. Together, these two surveys make up the employment report, the most timely and broad indicator of economic activity released each month. Total payrolls are broken down into sectors such as manufacturing, mining, construction, services, and government. The markets follows these components closely as indicators of the trends in sectors of the economy; the manufacturing sector is watched the most closely as it often leads the business cycle. The data also include breakdowns of hours worked, overtime, and average hourly earnings. The average workweek (also known as hours worked) is important for two reasons. First, it is a critical determinant of such monthly indicators as industrial production and personal income. Second, it is considered a useful indicator of labor market conditions: a rising workweek early in the business cycle may be the first indication that employers are preparing to boost their payrolls, while late in the cycle a rising workweek may indicate that employers are having difficulty finding qualified applicants for open positions. Average earnings are closely followed as an indicator of potential inflation. Like the price of any good or service, the price of labor reacts to an overly accommodative monetary policy. If the price of labor is rising sharply, it may be an indication that too much money is chasing too few goods, or in this case employees. In Depth The employment report is really two reports - the household survey and the establishment survey. These two surveys contain a wealth of timely information which justify this report's status as the most important economic release of the month. This same wealth of information can nevertheless turn into a dearth of knowledge if it is not placed in the proper context. Household and Establishment Surveys The household and establishment surveys differ due to the source of the data, as the names suggest. The household survey is a survey of households and the establishment survey is a surveys of businesses. The establishment survey, which is sometimes referred to as the payrolls survey, is favored by the market for a simple reason - it is far more comprehensive. Both surveys attempt to measure employment conditions at the roughly the same point in time - the household survey covers the calendar week which includes the 12th of the month while the establishment survey covers the pay period (be it a week, two weeks, or longer) which includes the 12th. But the establishment survey covers 390,000 businesses which employ 47 million people, while the household survey covers just 50,000 individuals. With a sample size which is 940 times larger than the household survey, it is hardly surprising that the market is more interested in the establishment survey. Aside from the sample size, the surveys differ in other significant ways. The household survey counts farm workers, the self-employed, unpaid family workers, and private household workers as employed; the establishment survey does not. The household survey can only count one individual as employed once, even if that person holds two jobs. The establishment survey will double count an individual who appears on the payrolls of two companies. There are other, less significant differences, but let's turn now to the statistics produced by the two surveys. The Household Survey The Unemployment Rate As we noted earlier, the household survey is not nearly as reliable as the establishment survey due to the small size of the survey sample. This survey nevertheless receives attention, primarily because it is responsible for the one figure which is guaranteed to lead the nightly news - the unemployment rate. The unemployment rate demands little explanation, though it is worth noting that the rate can occasionally sees significant monthly changes which are due to flukes in the data. The rate is simply the result of dividing the number of people unemployed (labor force less employed) by the number of people in the labor force. The problem is that the employment and labor force measures in the household survey are far more volatile than even nonfarm payrolls. The reason, of course, is the small survey sample size. It is therefore useful to look at the labor force and employment figures themselves to determine if changes in the unemployment rate are due to aberrant swings in one or both of these series. Beyond the basics of tallying up the labor force and employment, the household survey breaks down these totals in every way imaginable - by gender, race, age, type of job, duration of unemployment, and on and on. These breakdowns seldom are of interest to the financial markets. Perhaps the only two exceptions are the discouraged worker and part-time worker measures. Discouraged Workers Discouraged workers are people who have dropped out of the labor force because they have become discouraged about their job prospects. During hard times, this statistic is often watched alongside the unemployment rate. If the job situation gets exceptionally bleak, it is possible to see the unemployment rate remaining stable not because people are finding jobs, but because they have given up looking and dropped out of the labor force. Part-Time Workers The issue of part time employment has arisen in recent years as many analysts have argued that strong payroll growth reflected the increase in the number of workers holding multiple part-time jobs. Since the payroll data do not differentiate between full and part-time workers, it is possible that a sudden surge in part-time employment which reflected poor full-time job prospects would actually boost payroll growth. In reality, it does not appear that this has happened, as part-time employment has been relatively steady in recent years. This figure nevertheless receives attention from time to time. The Big Picture Given the wealth of data contained in the employment report, it is important to take all of these indicators into account when passing judgment on the report. Looking at payrolls along is often misleading, as the workweek, earnings, and household employment measures may be telling a different story. Taken together, however, and taken with the caveats concerning monthly volatility and revisions, the employment report offers the best monthly glimpse of the economy. 06/08/09 01:30 Non-Farm Payroll -20000 -21400 Jul Country: Australia Source: Bureau of Labor Statistics, U.S. Department of Labor. Raw Data Available At: http://stats.bls.gov/news.release/empsit.toc.htm Release Time: First Friday of the month at 8:30 ET for the prior month. In Brief The employment report is actually two separate reports which are the results of two separate surveys. The household survey is a survey of roughly 60,000 households. This survey produces the unemployment rate. The establishment survey is a survey of 375,000 businesses. This survey produces the nonfarm payrolls, average workweek, and average hourly earnings figures, to name a few. Both surveys cover the payroll period which includes the 12th of each month. The reports both measure employment levels, just from different angles. Due to the vastly different size of the survey samples (the establishment survey not only surveys more businesses, but each business employs many individuals), the measures of employment may differ markedly from month to month. The household survey is used only for the unemployment measure - the market focusses primarily on the more comprehensive establishment survey. Together, these two surveys make up the employment report, the most timely and broad indicator of economic activity released each month. Total payrolls are broken down into sectors such as manufacturing, mining, construction, services, and government. The markets follows these components closely as indicators of the trends in sectors of the economy; the manufacturing sector is watched the most closely as it often leads the business cycle. The data also include breakdowns of hours worked, overtime, and average hourly earnings. The average workweek (also known as hours worked) is important for two reasons. First, it is a critical determinant of such monthly indicators as industrial production and personal income. Second, it is considered a useful indicator of labor market conditions: a rising workweek early in the business cycle may be the first indication that employers are preparing to boost their payrolls, while late in the cycle a rising workweek may indicate that employers are having difficulty finding qualified applicants for open positions. Average earnings are closely followed as an indicator of potential inflation. Like the price of any good or service, the price of labor reacts to an overly accommodative monetary policy. If the price of labor is rising sharply, it may be an indication that too much money is chasing too few goods, or in this case employees. In Depth The employment report is really two reports - the household survey and the establishment survey. These two surveys contain a wealth of timely information which justify this report's status as the most important economic release of the month. This same wealth of information can nevertheless turn into a dearth of knowledge if it is not placed in the proper context. Household and Establishment Surveys The household and establishment surveys differ due to the source of the data, as the names suggest. The household survey is a survey of households and the establishment survey is a surveys of businesses. The establishment survey, which is sometimes referred to as the payrolls survey, is favored by the market for a simple reason - it is far more comprehensive. Both surveys attempt to measure employment conditions at the roughly the same point in time - the household survey covers the calendar week which includes the 12th of the month while the establishment survey covers the pay period (be it a week, two weeks, or longer) which includes the 12th. But the establishment survey covers 390,000 businesses which employ 47 million people, while the household survey covers just 50,000 individuals. With a sample size which is 940 times larger than the household survey, it is hardly surprising that the market is more interested in the establishment survey. Aside from the sample size, the surveys differ in other significant ways. The household survey counts farm workers, the self-employed, unpaid family workers, and private household workers as employed; the establishment survey does not. The household survey can only count one individual as employed once, even if that person holds two jobs. The establishment survey will double count an individual who appears on the payrolls of two companies. There are other, less significant differences, but let's turn now to the statistics produced by the two surveys. The Establishment Survey Nonfarm Payrolls Without question, the single most important piece of data contained in the employment report generally and the establishment survey specifically is nonfarm payrolls. As the name implies, nonfarm payrolls measure the number of people on the payrolls of all non-agricultural businesses. The monthly changes in payrolls can be quite volatile, occasionally varying by better than 200K from one month to the next. Even with this volatility and the possibility of large revisions to past data, the payrolls figures offer the most timely and comprehensive snapshot of the economy. Average Workweek The workweek, also referred to as hours worked, is an often underrated indicator in the establishment survey. The average number of hours worked by employees on nonfarm payrolls is an important determinant of both industrial production and personal income in any given month. The workweek typically sees changes of a tenth or two each month, but can see much larger swings, such as the four tenth decline reported for October. To understand the importance of these changes in the workweek, note that a one tenth decline in the average workweek of 120 mln workers (roughly the current level of employment) results in 12 mln fewer hours worked. To create a similar decline in manhours through a change in employment, payrolls would have to fall 340K. For the purposes of production and income calculations, a one tenth of an hour change in the workweek is equivalent to a 340K change in employment. Needless to say, the workweek data are therefore critical in judging the overall strength or weakness of the employment report. Aggregate Hours Worked The aggregate hours worked index simply brings together the two series we just noted. By calculating an index which looks at both employment and the workweek, we get a complete picture of the total hours worked each month. This indicator is seen as a monthly proxy for GDP. By definition, the quarterly change in the amount of goods produced is equal to the change in manhours plus the change in productivity. As productivity is somewhat predictable from quarter to quarter, the aggregate hours worked index provides a helpful monthly read on the overall economy. Average Hourly Earnings The last indicator from the establishment survey which is worthy of close inspection is average hourly earnings, which is important for two reasons. Alongside total manhours, the average earnings figure gives us a good indication of personal income growth during the month. Second, the earnings figures are closely watched during periods of strong economic growth for evidence of increasing wage pressures. Such has certainly been the case over the past year, as the market's reaction to the employment data has often turned on the change in hourly earnings and its implications for the inflation outlook. 06/08/09 01:30 Unemployment Rate 6.0% 5.8% Jul Country: Australia Source: Bureau of Labor Statistics, U.S. Department of Labor. Raw Data Available At: http://stats.bls.gov/news.release/empsit.toc.htm Release Time: First Friday of the month at 8:30 ET for the prior month. In Brief The employment report is actually two separate reports which are the results of two separate surveys. The household survey is a survey of roughly 60,000 households. This survey produces the unemployment rate. The establishment survey is a survey of 375,000 businesses. This survey produces the nonfarm payrolls, average workweek, and average hourly earnings figures, to name a few. Both surveys cover the payroll period which includes the 12th of each month. The reports both measure employment levels, just from different angles. Due to the vastly different size of the survey samples (the establishment survey not only surveys more businesses, but each business employs many individuals), the measures of employment may differ markedly from month to month. The household survey is used only for the unemployment measure - the market focusses primarily on the more comprehensive establishment survey. Together, these two surveys make up the employment report, the most timely and broad indicator of economic activity released each month. Total payrolls are broken down into sectors such as manufacturing, mining, construction, services, and government. The markets follows these components closely as indicators of the trends in sectors of the economy; the manufacturing sector is watched the most closely as it often leads the business cycle. The data also include breakdowns of hours worked, overtime, and average hourly earnings. The average workweek (also known as hours worked) is important for two reasons. First, it is a critical determinant of such monthly indicators as industrial production and personal income. Second, it is considered a useful indicator of labor market conditions: a rising workweek early in the business cycle may be the first indication that employers are preparing to boost their payrolls, while late in the cycle a rising workweek may indicate that employers are having difficulty finding qualified applicants for open positions. Average earnings are closely followed as an indicator of potential inflation. Like the price of any good or service, the price of labor reacts to an overly accommodative monetary policy. If the price of labor is rising sharply, it may be an indication that too much money is chasing too few goods, or in this case employees. In Depth The employment report is really two reports - the household survey and the establishment survey. These two surveys contain a wealth of timely information which justify this report's status as the most important economic release of the month. This same wealth of information can nevertheless turn into a dearth of knowledge if it is not placed in the proper context. Household and Establishment Surveys The household and establishment surveys differ due to the source of the data, as the names suggest. The household survey is a survey of households and the establishment survey is a surveys of businesses. The establishment survey, which is sometimes referred to as the payrolls survey, is favored by the market for a simple reason - it is far more comprehensive. Both surveys attempt to measure employment conditions at the roughly the same point in time - the household survey covers the calendar week which includes the 12th of the month while the establishment survey covers the pay period (be it a week, two weeks, or longer) which includes the 12th. But the establishment survey covers 390,000 businesses which employ 47 million people, while the household survey covers just 50,000 individuals. With a sample size which is 940 times larger than the household survey, it is hardly surprising that the market is more interested in the establishment survey. Aside from the sample size, the surveys differ in other significant ways. The household survey counts farm workers, the self-employed, unpaid family workers, and private household workers as employed; the establishment survey does not. The household survey can only count one individual as employed once, even if that person holds two jobs. The establishment survey will double count an individual who appears on the payrolls of two companies. There are other, less significant differences, but let's turn now to the statistics produced by the two surveys. The Household Survey The Unemployment Rate As we noted earlier, the household survey is not nearly as reliable as the establishment survey due to the small size of the survey sample. This survey nevertheless receives attention, primarily because it is responsible for the one figure which is guaranteed to lead the nightly news - the unemployment rate. The unemployment rate demands little explanation, though it is worth noting that the rate can occasionally sees significant monthly changes which are due to flukes in the data. The rate is simply the result of dividing the number of people unemployed (labor force less employed) by the number of people in the labor force. The problem is that the employment and labor force measures in the household survey are far more volatile than even nonfarm payrolls. The reason, of course, is the small survey sample size. It is therefore useful to look at the labor force and employment figures themselves to determine if changes in the unemployment rate are due to aberrant swings in one or both of these series. Beyond the basics of tallying up the labor force and employment, the household survey breaks down these totals in every way imaginable - by gender, race, age, type of job, duration of unemployment, and on and on. These breakdowns seldom are of interest to the financial markets. Perhaps the only two exceptions are the discouraged worker and part-time worker measures. Discouraged Workers Discouraged workers are people who have dropped out of the labor force because they have become discouraged about their job prospects. During hard times, this statistic is often watched alongside the unemployment rate. If the job situation gets exceptionally bleak, it is possible to see the unemployment rate remaining stable not because people are finding jobs, but because they have given up looking and dropped out of the labor force. Part-Time Workers The issue of part time employment has arisen in recent years as many analysts have argued that strong payroll growth reflected the increase in the number of workers holding multiple part-time jobs. Since the payroll data do not differentiate between full and part-time workers, it is possible that a sudden surge in part-time employment which reflected poor full-time job prospects would actually boost payroll growth. In reality, it does not appear that this has happened, as part-time employment has been relatively steady in recent years. This figure nevertheless receives attention from time to time. The Big Picture Given the wealth of data contained in the employment report, it is important to take all of these indicators into account when passing judgment on the report. Looking at payrolls along is often misleading, as the workweek, earnings, and household employment measures may be telling a different story. Taken together, however, and taken with the caveats concerning monthly volatility and revisions, the employment report offers the best monthly glimpse of the economy. 06/08/09 05:00 Leading Economic Indicators 0.8 Jun Country: Japan Source: The Conference Board. Raw Data Available At: http://www.tcb-indicators.org/ Release Time: 8:30 ET around the third week of the month for the month prior. In Brief The Leading Indicators report is, for the most part, a compendium of previously announced economic indicators: new orders, jobless claims, money supply, average workweek, building permits, and stock prices. Therefore, the report is extremely predictable and of very little interest to the market. Though this series does have some predictive qualities, it is a common criticism that it has predicted "nine of the last six" recessions. The Commerce Department previously published the leading indicators series. The collection and publishing of these data is now done by the non-profit Conference Board, which also produces the Consumer Confidence index. In Depth Purpose The purpose of the leading index is straightforward: It is designed to signal turning points in the business cycle. Composition The index of leading indicators includes the ten economic statistics listed below. 1. The interest rate spread between 10-year Treasury notes and the federal funds rate. 2. The inflation-adjusted, M2 measure of the money supply. 3. The average manufacturing workweek. 4. Manufacturers' new orders for consumer goods and materials. 5. The S&P 500 measure of stock prices. 6. The vendor performance component of the NAPM index. 7. The average level of weekly initial claims for unemployment insurance. 8. Building permits. 9. The University of Michigan index of consumer expectations. 10. Manufacturers' new orders for nondefense capital goods. The Conference Board, the organization that produces the leading index, standardizes these variables according to their individual weights in order to construct a composite leading index. Note that we have listed the components in order of importance. The difference between 10-year Treasuries and the fed funds rate carries the most weight; historically, this approximation of the slope of the yield curve has proven relatively more successful than other components at predicting future economic activity. Along those same lines, orders for nondefense capital goods carry the smallest weight because they have typically proven relatively poorer at pointing to changes in the direction of economic growth at large. Performance The leading index receives plenty of criticism. Indeed, skeptics often joke that it has correctly signalled nine of the last six recessions. Meanwhile, in its literature, The Conference Board cites the lead times with which the leading index has correctly predicted economic downturns. It is thus fair to ask whether the leading index is useless or priceless. The answer lies somewhere in between. The charge that the index predicts recessions that do not come to fruition--and fails to warn of those that do--is hardly a fair criticism. No forecaster, even armed with an arsenal of economic statistics, has a perfect track record when it comes to predicting recessions. It is therefore unreasonable to assume that a ten-component index can do any better. That said, the index does have some reliability problems. For example, it failed to turn down prior to the 1990-91 recession, and in 1995 it signalled a downturn that never came to pass. Usefulness The leading index is more useful now that The Conference Board has taken control of it (the Department of Commerce stopped producing it at the end of 1996). Conference Board researchers quickly scrapped two of the old components--the change in sensitive materials prices and unfilled orders for durable goods--and added the interest-rate spread that appears in our list above. The index now lacks a wholesale price term, which some see as critical to determining future demand and inflation trends, but on net the new index emits less pronounced false signals and does a better job than it used to. Briefing finds the leading index most helpful when we can make a statement like this: The leading index has decreased only once during the past year. Of course, even a strong trend like that does not guarantee that a recession will not form over the coming six to nine months. But we can get additional help from looking at the leading index with the coincident index, which is also published by The Conference Board, and alongside a couple of other leading indices published by Columbia University. Indeed, there exists much research that deals with the criteria for determining recession warnings (i.e., the leading index must fall during four of seven months and the coincident index must fall for three straight months). 06/08/09 05:45 Consumer Confidence -38.0 Q3 Country: Switzerland Source: The Conference Board. Raw Data Available At: http://www.tcb-indicators.org/ Release Time: 10:00 ET on the last Tuesday of the month (data for current month). This survey measures the level of confidence individual households have in the performance of the economy now and in the future. It is a leading indicator of future spending and the business cycle. 5000 consumers in the nine census divisions across the country are surveyed each month. The level of consumer confidence is directly correlated to the strength of consumer spending, which accounts for two-thirds of the economy. It also correlates closely with joblessness, inflation, and real incomes. The report can occasionally be helpful in predicting sudden shifts in consumption patterns, though most small changes in the index are just noise. Only index changes of at least five points should be considered significant. The index consists of two subindexes - consumers' appraisal of current conditions and their expectations for the future. Expectations make up 60% of the total index, with current conditions accounting for the other 40%. The expectations index is typically seen as having better leading indicator qualities than the current conditions index. The more confident consumers are about the economy and their own personal finances, the more likely they are to spend. Note, changes in consumer confidence and retail sales do not move in tandem month by month. If the economy experiences a long-term expansion, buying intentions may decline even while the jobless rate declines because of the satisfaction of pent-up demand. Conversely, if inflation begins to accelerate, spending plans may increase for the short-term as consumers buy now to avoid having to pay higher prices later. Regional differences in consumer confidence are an indication of differing business cycles across the nation. This has implications for spending on durable goods and, more importantly, for residential real estate markets. Financial markets interpret rising consumer confidence as a precursor to higher consumer spending. Higher consumer spending could in turn spark inflation. Look for a change in the direction of the six month moving average of the index. Consumers do not usually have the necessary information to accurately assess income and job growth six months in the future. The report provides information on planned spending, which does not necessarily turn into actual spending, although it is unlikely that increasing consumer confidence would be followed by a decline in spending. The Consumer Confidence survey is not useful for any type of forecasting. 06/08/09 10:00 Factory Orders mm 40.7% 4.4% Jun Country: Germany Source: The Census Bureau of the Department of Commerce. Raw Data Available At: http://www.census.gov/ftp/pub/indicator/www/m3/index.htm Release Time: 10:00 ET around the first business day of the month (data for two months prior). Factory orders consist of the earlier announced durable goods report plus non- durable goods orders. The report is very predictable with nondurables the only new component. Nondurables consist of such items as food and tobacco products which grow at a fairly consistent monthly rate, so that market forecasts for this report are far more accurate than for the durable orders report. In addition to seeing nondurables for the first time, the market also watches for revisions to the durable orders data, which can be significant. At present, durable goods orders sum to about 54% of total orders. The final piece of new information in this report is factory inventories -- the first glimpse at the inventory picture each month (wholesales inventories are typically released a week later, with retail inventories released a few days after wholesale inventories). Though the inventory figure is not a market-mover, economists use this number to help forecast inventories in the quarterly GDP report. 06/08/09 11:00 Bank of England Quarterly Inflation Report 0.5% 0.5% Aug Country: UK 06/08/09 11:45 Interest Rate Decision 1% 1% Aug Country: EMU Source (U.S.): The Federal Reserve Open Market Committee - FOMC. Source (World): The Central Bank Monetary Policy Committee - MPC. The Federal Open Market Committee is a twelve-member committee made up of the seven members of the Board of Governors and five Federal Reserve Bank presidents. It meets eight times per year to determine the near-term direction of monetary policy, such as setting guidelines for the purchase and sale of government securities and setting policy relating to System operations in the foreign exchange markets. These changes in monetary policy are now announced immediately after FOMC meetings. Most importantly, the Fed determines interest rate policy at FOMC meetings. Market participants speculate about the possibility of an interest rate change at these meetings, and if the outcome is different from expectations, the impact on the markets can be dramatic and far-reaching. The interest rate set by the Fed the federal funds rate serves as a benchmark for all other rates. A change in the fed funds rate, the lending rate banks charge each other for the use of overnight funds, translates directly through to all other interest rates from Treasury bonds to mortgage loans. It also changes the dynamics of competition for investor dollars: when bonds yield 10 percent, they will attract more money away from stocks then when they only yield 5 percent. The level of interest rates affects the economy­ higher rates tend to slow activity; lower rates stimulate activity, a ripple effect that expands into all sectors of the economy. 06/08/09 12:30 Initial Jobless Claims 584k L/W Country: US Source: The Employment and Training Administration of the Department of Labor. Raw Data Available At: http://www.dol.gov/opa/media/press/eta/main.htm Release Time: 8:30 ET each Thursday (data for week ended prior Saturday). This survey measures the attitudes and expectations concerning both present and future economic conditions of 500 consumers. The Michigan index is almost identical to the Conference Board Consumer Confidence index, though there are two monthly releases, a preliminary and final reading. Like the Conference Board index, it has two subindexes - expectations and current conditions. The expectations index is a component of the Conference Board's Leading Indicators index. 06/08/09 12:30 Building Permits 14.8% Jun Country: Canada Source: The Census Bureau of the Department of Commerce. Raw Data Available At: http://www.census.gov/const/www/newresconstindex.html Release Time: 8:30 ET around the 16th of the month (data for one month prior). Housing Starts are a measure of the number of residential units on which construction is begun each month. A start in construction is defined as the beginning of excavation of the foundation for the building and is comprised primarily of residential housing. Building permits are permits taken out in order to allow excavation. An increase in building permits and starts usually occurs a few months after a reduction in mortgage rates. Permits lead starts, but permits are not required in all regions of the country, and the level of permits therefore tends to be less than the level of starts over time. The monthly national report is broken down by region: Northeast, Midwest, South, and West. Briefing recommends analyzing the regional data because they are subject to a high degree of volatility. The high volatility can be attributed to weather changes and/or natural disasters. For example, an unexpectedly high level of rain in South could delay housing starts for the region. 07/08/09 01:30 monetary policy report Country: Australia 07/08/09 05:45 Unemployment Rate 3.8% 4.0% Jul Country: Switzerland Source: Bureau of Labor Statistics, U.S. Department of Labor. Raw Data Available At: http://stats.bls.gov/news.release/empsit.toc.htm Release Time: First Friday of the month at 8:30 ET for the prior month. In Brief The employment report is actually two separate reports which are the results of two separate surveys. The household survey is a survey of roughly 60,000 households. This survey produces the unemployment rate. The establishment survey is a survey of 375,000 businesses. This survey produces the nonfarm payrolls, average workweek, and average hourly earnings figures, to name a few. Both surveys cover the payroll period which includes the 12th of each month. The reports both measure employment levels, just from different angles. Due to the vastly different size of the survey samples (the establishment survey not only surveys more businesses, but each business employs many individuals), the measures of employment may differ markedly from month to month. The household survey is used only for the unemployment measure - the market focusses primarily on the more comprehensive establishment survey. Together, these two surveys make up the employment report, the most timely and broad indicator of economic activity released each month. Total payrolls are broken down into sectors such as manufacturing, mining, construction, services, and government. The markets follows these components closely as indicators of the trends in sectors of the economy; the manufacturing sector is watched the most closely as it often leads the business cycle. The data also include breakdowns of hours worked, overtime, and average hourly earnings. The average workweek (also known as hours worked) is important for two reasons. First, it is a critical determinant of such monthly indicators as industrial production and personal income. Second, it is considered a useful indicator of labor market conditions: a rising workweek early in the business cycle may be the first indication that employers are preparing to boost their payrolls, while late in the cycle a rising workweek may indicate that employers are having difficulty finding qualified applicants for open positions. Average earnings are closely followed as an indicator of potential inflation. Like the price of any good or service, the price of labor reacts to an overly accommodative monetary policy. If the price of labor is rising sharply, it may be an indication that too much money is chasing too few goods, or in this case employees. In Depth The employment report is really two reports - the household survey and the establishment survey. These two surveys contain a wealth of timely information which justify this report's status as the most important economic release of the month. This same wealth of information can nevertheless turn into a dearth of knowledge if it is not placed in the proper context. Household and Establishment Surveys The household and establishment surveys differ due to the source of the data, as the names suggest. The household survey is a survey of households and the establishment survey is a surveys of businesses. The establishment survey, which is sometimes referred to as the payrolls survey, is favored by the market for a simple reason - it is far more comprehensive. Both surveys attempt to measure employment conditions at the roughly the same point in time - the household survey covers the calendar week which includes the 12th of the month while the establishment survey covers the pay period (be it a week, two weeks, or longer) which includes the 12th. But the establishment survey covers 390,000 businesses which employ 47 million people, while the household survey covers just 50,000 individuals. With a sample size which is 940 times larger than the household survey, it is hardly surprising that the market is more interested in the establishment survey. Aside from the sample size, the surveys differ in other significant ways. The household survey counts farm workers, the self-employed, unpaid family workers, and private household workers as employed; the establishment survey does not. The household survey can only count one individual as employed once, even if that person holds two jobs. The establishment survey will double count an individual who appears on the payrolls of two companies. There are other, less significant differences, but let's turn now to the statistics produced by the two surveys. The Household Survey The Unemployment Rate As we noted earlier, the household survey is not nearly as reliable as the establishment survey due to the small size of the survey sample. This survey nevertheless receives attention, primarily because it is responsible for the one figure which is guaranteed to lead the nightly news - the unemployment rate. The unemployment rate demands little explanation, though it is worth noting that the rate can occasionally sees significant monthly changes which are due to flukes in the data. The rate is simply the result of dividing the number of people unemployed (labor force less employed) by the number of people in the labor force. The problem is that the employment and labor force measures in the household survey are far more volatile than even nonfarm payrolls. The reason, of course, is the small survey sample size. It is therefore useful to look at the labor force and employment figures themselves to determine if changes in the unemployment rate are due to aberrant swings in one or both of these series. Beyond the basics of tallying up the labor force and employment, the household survey breaks down these totals in every way imaginable - by gender, race, age, type of job, duration of unemployment, and on and on. These breakdowns seldom are of interest to the financial markets. Perhaps the only two exceptions are the discouraged worker and part-time worker measures. Discouraged Workers Discouraged workers are people who have dropped out of the labor force because they have become discouraged about their job prospects. During hard times, this statistic is often watched alongside the unemployment rate. If the job situation gets exceptionally bleak, it is possible to see the unemployment rate remaining stable not because people are finding jobs, but because they have given up looking and dropped out of the labor force. Part-Time Workers The issue of part time employment has arisen in recent years as many analysts have argued that strong payroll growth reflected the increase in the number of workers holding multiple part-time jobs. Since the payroll data do not differentiate between full and part-time workers, it is possible that a sudden surge in part-time employment which reflected poor full-time job prospects would actually boost payroll growth. In reality, it does not appear that this has happened, as part-time employment has been relatively steady in recent years. This figure nevertheless receives attention from time to time. The Big Picture Given the wealth of data contained in the employment report, it is important to take all of these indicators into account when passing judgment on the report. Looking at payrolls along is often misleading, as the workweek, earnings, and household employment measures may be telling a different story. Taken together, however, and taken with the caveats concerning monthly volatility and revisions, the employment report offers the best monthly glimpse of the economy. 07/08/09 06:00 International Trade Balance mm 10.7b 10.3b Jun Country: Germany Source: The Census Bureau and the Bureau of Economic Analysis of the Department of Commerce. Raw Data Available At: http://www.census.gov/foreign-trade/www/press.html Release Time: 8:30 ET around the 20th of the month (data for two months prior). The trade report is most widely watched for trends in the overall trade balance. But trends in both exports and imports of goods and services bear watching as well. The export data in particular are important to watch for indications that a strengthening competitive position at home and/or strengthening economies overseas are boosting U.S. growth. Imports provide an indication of domestic demand, but given the severe lag of this report relative to other consumption indicators, it is not particularly valuable for this purpose. The volatility in the monthly trade balance can play an important role in GDP forecasts. Net exports are a relatively volatile component of GDP, and the trade report provides the only early clues to the net export performance each quarter. 07/08/09 08:30 Core PPI mm -0.8% 0.2% Jul Country: UK Source: Bureau of Labor statistics, U.S. Department of Labor. Raw Data Available At: http://stats.bls.gov/news.release/ppi.toc.htm Release Time: Around the 11th of each month at 8:30 ET for the prior month. The Producer Price Index measures prices of goods at the wholesale level. There are three broad subcategories within PPI: crude, intermediate, and finished. The market tracks the finished goods index most closely, as it represents prices for goods that are ready for sale to the end user. Goods prices at the crude and intermediate stages of production often provide an indication of coming (dis)inflationary pressures, but the closer you get to crude goods, the more that these prices track commodity prices which are already available in traded indexes such as the CRB (Commodity Research Bureau). At all stages of production, the market places more emphasis on the index excluding food and energy, referred to as the core rate. Food and energy prices tend to be quite volatile and obscure trends in the underlying inflation rate. Though the market reaction is determined by the month/month changes, year/year changes are also noted by analysts. The index is not revised on a monthly basis, but annual revisions to seasonal adjustment factors can produce small adjustments to past releases. 07/08/09 08:30 Core PPI yy -0.4% 0.1% Jul Country: UK Source: Bureau of Labor statistics, U.S. Department of Labor. Raw Data Available At: http://stats.bls.gov/news.release/ppi.toc.htm Release Time: Around the 11th of each month at 8:30 ET for the prior month. The Producer Price Index measures prices of goods at the wholesale level. There are three broad subcategories within PPI: crude, intermediate, and finished. The market tracks the finished goods index most closely, as it represents prices for goods that are ready for sale to the end user. Goods prices at the crude and intermediate stages of production often provide an indication of coming (dis)inflationary pressures, but the closer you get to crude goods, the more that these prices track commodity prices which are already available in traded indexes such as the CRB (Commodity Research Bureau). At all stages of production, the market places more emphasis on the index excluding food and energy, referred to as the core rate. Food and energy prices tend to be quite volatile and obscure trends in the underlying inflation rate. Though the market reaction is determined by the month/month changes, year/year changes are also noted by analysts. The index is not revised on a monthly basis, but annual revisions to seasonal adjustment factors can produce small adjustments to past releases. 07/08/09 08:30 Core PPI mm -0.4% 1.5% Jul Country: UK Source: Bureau of Labor statistics, U.S. Department of Labor. Raw Data Available At: http://stats.bls.gov/news.release/ppi.toc.htm Release Time: Around the 11th of each month at 8:30 ET for the prior month. The Producer Price Index measures prices of goods at the wholesale level. There are three broad subcategories within PPI: crude, intermediate, and finished. The market tracks the finished goods index most closely, as it represents prices for goods that are ready for sale to the end user. Goods prices at the crude and intermediate stages of production often provide an indication of coming (dis)inflationary pressures, but the closer you get to crude goods, the more that these prices track commodity prices which are already available in traded indexes such as the CRB (Commodity Research Bureau). At all stages of production, the market places more emphasis on the index excluding food and energy, referred to as the core rate. Food and energy prices tend to be quite volatile and obscure trends in the underlying inflation rate. Though the market reaction is determined by the month/month changes, year/year changes are also noted by analysts. The index is not revised on a monthly basis, but annual revisions to seasonal adjustment factors can produce small adjustments to past releases. 07/08/09 08:30 Core PPI yy -10.9% 11.0% Jul Country: UK Source: Bureau of Labor statistics, U.S. Department of Labor. Raw Data Available At: http://stats.bls.gov/news.release/ppi.toc.htm Release Time: Around the 11th of each month at 8:30 ET for the prior month. The Producer Price Index measures prices of goods at the wholesale level. There are three broad subcategories within PPI: crude, intermediate, and finished. The market tracks the finished goods index most closely, as it represents prices for goods that are ready for sale to the end user. Goods prices at the crude and intermediate stages of production often provide an indication of coming (dis)inflationary pressures, but the closer you get to crude goods, the more that these prices track commodity prices which are already available in traded indexes such as the CRB (Commodity Research Bureau). At all stages of production, the market places more emphasis on the index excluding food and energy, referred to as the core rate. Food and energy prices tend to be quite volatile and obscure trends in the underlying inflation rate. Though the market reaction is determined by the month/month changes, year/year changes are also noted by analysts. The index is not revised on a monthly basis, but annual revisions to seasonal adjustment factors can produce small adjustments to past releases. 07/08/09 10:00 Industrial Production mm 0.9% 3.7% Jun Country: Germany Source: Federal Reserve. Raw Data Available At: http://www.federalreserve.gov/releases/G17/Current/g17.txt Release Time: 9:15 ET around the 15th of the month (data for month prior). The index of Industrial Production is a fixed-weight measure of the physical output of the nation's factories, mines, and utilities. Manufacturing production, the largest component of the total, can be accurately predicted using total manufacturing hours worked from the employment report. One of the bigger wildcards in this report is utility production, which can be quite volatile due to swings in the weather. Severe hot or cold spells can boost production as increased heating/cooling needs drive utility production up. In addition to production, this monthly report also provides a measure of capacity utilization. Though the rate of capacity utilization is seen as a critical gauge of the slack available in the economy, the market does not completely trust this measure. Capacity is very difficult to measure, and the Fed essentially assumes that growth in capacity in any given year follows a straight line. One can therefore predict the capacity utilization rate quite accurately based on the assumption for production growth. The 85% mark is seen as a key barrier over which inflationary pressures are generated, but given revisions to these data and the difficulties with capacity measurement, the 85% mark should be viewed cautiously. It would be appropriate to look for corroborating inflation indications from commodity prices and vendor deliveries. 07/08/09 11:00 Non-Farm Payroll -7.4k Jul Country: Canada Source: Bureau of Labor Statistics, U.S. Department of Labor. Raw Data Available At: http://stats.bls.gov/news.release/empsit.toc.htm Release Time: First Friday of the month at 8:30 ET for the prior month. In Brief The employment report is actually two separate reports which are the results of two separate surveys. The household survey is a survey of roughly 60,000 households. This survey produces the unemployment rate. The establishment survey is a survey of 375,000 businesses. This survey produces the nonfarm payrolls, average workweek, and average hourly earnings figures, to name a few. Both surveys cover the payroll period which includes the 12th of each month. The reports both measure employment levels, just from different angles. Due to the vastly different size of the survey samples (the establishment survey not only surveys more businesses, but each business employs many individuals), the measures of employment may differ markedly from month to month. The household survey is used only for the unemployment measure - the market focusses primarily on the more comprehensive establishment survey. Together, these two surveys make up the employment report, the most timely and broad indicator of economic activity released each month. Total payrolls are broken down into sectors such as manufacturing, mining, construction, services, and government. The markets follows these components closely as indicators of the trends in sectors of the economy; the manufacturing sector is watched the most closely as it often leads the business cycle. The data also include breakdowns of hours worked, overtime, and average hourly earnings. The average workweek (also known as hours worked) is important for two reasons. First, it is a critical determinant of such monthly indicators as industrial production and personal income. Second, it is considered a useful indicator of labor market conditions: a rising workweek early in the business cycle may be the first indication that employers are preparing to boost their payrolls, while late in the cycle a rising workweek may indicate that employers are having difficulty finding qualified applicants for open positions. Average earnings are closely followed as an indicator of potential inflation. Like the price of any good or service, the price of labor reacts to an overly accommodative monetary policy. If the price of labor is rising sharply, it may be an indication that too much money is chasing too few goods, or in this case employees. In Depth The employment report is really two reports - the household survey and the establishment survey. These two surveys contain a wealth of timely information which justify this report's status as the most important economic release of the month. This same wealth of information can nevertheless turn into a dearth of knowledge if it is not placed in the proper context. Household and Establishment Surveys The household and establishment surveys differ due to the source of the data, as the names suggest. The household survey is a survey of households and the establishment survey is a surveys of businesses. The establishment survey, which is sometimes referred to as the payrolls survey, is favored by the market for a simple reason - it is far more comprehensive. Both surveys attempt to measure employment conditions at the roughly the same point in time - the household survey covers the calendar week which includes the 12th of the month while the establishment survey covers the pay period (be it a week, two weeks, or longer) which includes the 12th. But the establishment survey covers 390,000 businesses which employ 47 million people, while the household survey covers just 50,000 individuals. With a sample size which is 940 times larger than the household survey, it is hardly surprising that the market is more interested in the establishment survey. Aside from the sample size, the surveys differ in other significant ways. The household survey counts farm workers, the self-employed, unpaid family workers, and private household workers as employed; the establishment survey does not. The household survey can only count one individual as employed once, even if that person holds two jobs. The establishment survey will double count an individual who appears on the payrolls of two companies. There are other, less significant differences, but let's turn now to the statistics produced by the two surveys. The Establishment Survey Nonfarm Payrolls Without question, the single most important piece of data contained in the employment report generally and the establishment survey specifically is nonfarm payrolls. As the name implies, nonfarm payrolls measure the number of people on the payrolls of all non-agricultural businesses. The monthly changes in payrolls can be quite volatile, occasionally varying by better than 200K from one month to the next. Even with this volatility and the possibility of large revisions to past data, the payrolls figures offer the most timely and comprehensive snapshot of the economy. Average Workweek The workweek, also referred to as hours worked, is an often underrated indicator in the establishment survey. The average number of hours worked by employees on nonfarm payrolls is an important determinant of both industrial production and personal income in any given month. The workweek typically sees changes of a tenth or two each month, but can see much larger swings, such as the four tenth decline reported for October. To understand the importance of these changes in the workweek, note that a one tenth decline in the average workweek of 120 mln workers (roughly the current level of employment) results in 12 mln fewer hours worked. To create a similar decline in manhours through a change in employment, payrolls would have to fall 340K. For the purposes of production and income calculations, a one tenth of an hour change in the workweek is equivalent to a 340K change in employment. Needless to say, the workweek data are therefore critical in judging the overall strength or weakness of the employment report. Aggregate Hours Worked The aggregate hours worked index simply brings together the two series we just noted. By calculating an index which looks at both employment and the workweek, we get a complete picture of the total hours worked each month. This indicator is seen as a monthly proxy for GDP. By definition, the quarterly change in the amount of goods produced is equal to the change in manhours plus the change in productivity. As productivity is somewhat predictable from quarter to quarter, the aggregate hours worked index provides a helpful monthly read on the overall economy. Average Hourly Earnings The last indicator from the establishment survey which is worthy of close inspection is average hourly earnings, which is important for two reasons. Alongside total manhours, the average earnings figure gives us a good indication of personal income growth during the month. Second, the earnings figures are closely watched during periods of strong economic growth for evidence of increasing wage pressures. Such has certainly been the case over the past year, as the market's reaction to the employment data has often turned on the change in hourly earnings and its implications for the inflation outlook. 07/08/09 11:00 Unemployment Rate 8.6% Jul Country: Canada Source: Bureau of Labor Statistics, U.S. Department of Labor. Raw Data Available At: http://stats.bls.gov/news.release/empsit.toc.htm Release Time: First Friday of the month at 8:30 ET for the prior month. In Brief The employment report is actually two separate reports which are the results of two separate surveys. The household survey is a survey of roughly 60,000 households. This survey produces the unemployment rate. The establishment survey is a survey of 375,000 businesses. This survey produces the nonfarm payrolls, average workweek, and average hourly earnings figures, to name a few. Both surveys cover the payroll period which includes the 12th of each month. The reports both measure employment levels, just from different angles. Due to the vastly different size of the survey samples (the establishment survey not only surveys more businesses, but each business employs many individuals), the measures of employment may differ markedly from month to month. The household survey is used only for the unemployment measure - the market focusses primarily on the more comprehensive establishment survey. Together, these two surveys make up the employment report, the most timely and broad indicator of economic activity released each month. Total payrolls are broken down into sectors such as manufacturing, mining, construction, services, and government. The markets follows these components closely as indicators of the trends in sectors of the economy; the manufacturing sector is watched the most closely as it often leads the business cycle. The data also include breakdowns of hours worked, overtime, and average hourly earnings. The average workweek (also known as hours worked) is important for two reasons. First, it is a critical determinant of such monthly indicators as industrial production and personal income. Second, it is considered a useful indicator of labor market conditions: a rising workweek early in the business cycle may be the first indication that employers are preparing to boost their payrolls, while late in the cycle a rising workweek may indicate that employers are having difficulty finding qualified applicants for open positions. Average earnings are closely followed as an indicator of potential inflation. Like the price of any good or service, the price of labor reacts to an overly accommodative monetary policy. If the price of labor is rising sharply, it may be an indication that too much money is chasing too few goods, or in this case employees. In Depth The employment report is really two reports - the household survey and the establishment survey. These two surveys contain a wealth of timely information which justify this report's status as the most important economic release of the month. This same wealth of information can nevertheless turn into a dearth of knowledge if it is not placed in the proper context. Household and Establishment Surveys The household and establishment surveys differ due to the source of the data, as the names suggest. The household survey is a survey of households and the establishment survey is a surveys of businesses. The establishment survey, which is sometimes referred to as the payrolls survey, is favored by the market for a simple reason - it is far more comprehensive. Both surveys attempt to measure employment conditions at the roughly the same point in time - the household survey covers the calendar week which includes the 12th of the month while the establishment survey covers the pay period (be it a week, two weeks, or longer) which includes the 12th. But the establishment survey covers 390,000 businesses which employ 47 million people, while the household survey covers just 50,000 individuals. With a sample size which is 940 times larger than the household survey, it is hardly surprising that the market is more interested in the establishment survey. Aside from the sample size, the surveys differ in other significant ways. The household survey counts farm workers, the self-employed, unpaid family workers, and private household workers as employed; the establishment survey does not. The household survey can only count one individual as employed once, even if that person holds two jobs. The establishment survey will double count an individual who appears on the payrolls of two companies. There are other, less significant differences, but let's turn now to the statistics produced by the two surveys. The Household Survey The Unemployment Rate As we noted earlier, the household survey is not nearly as reliable as the establishment survey due to the small size of the survey sample. This survey nevertheless receives attention, primarily because it is responsible for the one figure which is guaranteed to lead the nightly news - the unemployment rate. The unemployment rate demands little explanation, though it is worth noting that the rate can occasionally sees significant monthly changes which are due to flukes in the data. The rate is simply the result of dividing the number of people unemployed (labor force less employed) by the number of people in the labor force. The problem is that the employment and labor force measures in the household survey are far more volatile than even nonfarm payrolls. The reason, of course, is the small survey sample size. It is therefore useful to look at the labor force and employment figures themselves to determine if changes in the unemployment rate are due to aberrant swings in one or both of these series. Beyond the basics of tallying up the labor force and employment, the household survey breaks down these totals in every way imaginable - by gender, race, age, type of job, duration of unemployment, and on and on. These breakdowns seldom are of interest to the financial markets. Perhaps the only two exceptions are the discouraged worker and part-time worker measures. Discouraged Workers Discouraged workers are people who have dropped out of the labor force because they have become discouraged about their job prospects. During hard times, this statistic is often watched alongside the unemployment rate. If the job situation gets exceptionally bleak, it is possible to see the unemployment rate remaining stable not because people are finding jobs, but because they have given up looking and dropped out of the labor force. Part-Time Workers The issue of part time employment has arisen in recent years as many analysts have argued that strong payroll growth reflected the increase in the number of workers holding multiple part-time jobs. Since the payroll data do not differentiate between full and part-time workers, it is possible that a sudden surge in part-time employment which reflected poor full-time job prospects would actually boost payroll growth. In reality, it does not appear that this has happened, as part-time employment has been relatively steady in recent years. This figure nevertheless receives attention from time to time. The Big Picture Given the wealth of data contained in the employment report, it is important to take all of these indicators into account when passing judgment on the report. Looking at payrolls along is often misleading, as the workweek, earnings, and household employment measures may be telling a different story. Taken together, however, and taken with the caveats concerning monthly volatility and revisions, the employment report offers the best monthly glimpse of the economy. 07/08/09 12:30 Non-Farm Payroll -340k -467k Aug Country: US Source: Bureau of Labor Statistics, U.S. Department of Labor. Raw Data Available At: http://stats.bls.gov/news.release/empsit.toc.htm Release Time: First Friday of the month at 8:30 ET for the prior month. In Brief The employment report is actually two separate reports which are the results of two separate surveys. The household survey is a survey of roughly 60,000 households. This survey produces the unemployment rate. The establishment survey is a survey of 375,000 businesses. This survey produces the nonfarm payrolls, average workweek, and average hourly earnings figures, to name a few. Both surveys cover the payroll period which includes the 12th of each month. The reports both measure employment levels, just from different angles. Due to the vastly different size of the survey samples (the establishment survey not only surveys more businesses, but each business employs many individuals), the measures of employment may differ markedly from month to month. The household survey is used only for the unemployment measure - the market focusses primarily on the more comprehensive establishment survey. Together, these two surveys make up the employment report, the most timely and broad indicator of economic activity released each month. Total payrolls are broken down into sectors such as manufacturing, mining, construction, services, and government. The markets follows these components closely as indicators of the trends in sectors of the economy; the manufacturing sector is watched the most closely as it often leads the business cycle. The data also include breakdowns of hours worked, overtime, and average hourly earnings. The average workweek (also known as hours worked) is important for two reasons. First, it is a critical determinant of such monthly indicators as industrial production and personal income. Second, it is considered a useful indicator of labor market conditions: a rising workweek early in the business cycle may be the first indication that employers are preparing to boost their payrolls, while late in the cycle a rising workweek may indicate that employers are having difficulty finding qualified applicants for open positions. Average earnings are closely followed as an indicator of potential inflation. Like the price of any good or service, the price of labor reacts to an overly accommodative monetary policy. If the price of labor is rising sharply, it may be an indication that too much money is chasing too few goods, or in this case employees. In Depth The employment report is really two reports - the household survey and the establishment survey. These two surveys contain a wealth of timely information which justify this report's status as the most important economic release of the month. This same wealth of information can nevertheless turn into a dearth of knowledge if it is not placed in the proper context. Household and Establishment Surveys The household and establishment surveys differ due to the source of the data, as the names suggest. The household survey is a survey of households and the establishment survey is a surveys of businesses. The establishment survey, which is sometimes referred to as the payrolls survey, is favored by the market for a simple reason - it is far more comprehensive. Both surveys attempt to measure employment conditions at the roughly the same point in time - the household survey covers the calendar week which includes the 12th of the month while the establishment survey covers the pay period (be it a week, two weeks, or longer) which includes the 12th. But the establishment survey covers 390,000 businesses which employ 47 million people, while the household survey covers just 50,000 individuals. With a sample size which is 940 times larger than the household survey, it is hardly surprising that the market is more interested in the establishment survey. Aside from the sample size, the surveys differ in other significant ways. The household survey counts farm workers, the self-employed, unpaid family workers, and private household workers as employed; the establishment survey does not. The household survey can only count one individual as employed once, even if that person holds two jobs. The establishment survey will double count an individual who appears on the payrolls of two companies. There are other, less significant differences, but let's turn now to the statistics produced by the two surveys. The Establishment Survey Nonfarm Payrolls Without question, the single most important piece of data contained in the employment report generally and the establishment survey specifically is nonfarm payrolls. As the name implies, nonfarm payrolls measure the number of people on the payrolls of all non-agricultural businesses. The monthly changes in payrolls can be quite volatile, occasionally varying by better than 200K from one month to the next. Even with this volatility and the possibility of large revisions to past data, the payrolls figures offer the most timely and comprehensive snapshot of the economy. Average Workweek The workweek, also referred to as hours worked, is an often underrated indicator in the establishment survey. The average number of hours worked by employees on nonfarm payrolls is an important determinant of both industrial production and personal income in any given month. The workweek typically sees changes of a tenth or two each month, but can see much larger swings, such as the four tenth decline reported for October. To understand the importance of these changes in the workweek, note that a one tenth decline in the average workweek of 120 mln workers (roughly the current level of employment) results in 12 mln fewer hours worked. To create a similar decline in manhours through a change in employment, payrolls would have to fall 340K. For the purposes of production and income calculations, a one tenth of an hour change in the workweek is equivalent to a 340K change in employment. Needless to say, the workweek data are therefore critical in judging the overall strength or weakness of the employment report. Aggregate Hours Worked The aggregate hours worked index simply brings together the two series we just noted. By calculating an index which looks at both employment and the workweek, we get a complete picture of the total hours worked each month. This indicator is seen as a monthly proxy for GDP. By definition, the quarterly change in the amount of goods produced is equal to the change in manhours plus the change in productivity. As productivity is somewhat predictable from quarter to quarter, the aggregate hours worked index provides a helpful monthly read on the overall economy. Average Hourly Earnings The last indicator from the establishment survey which is worthy of close inspection is average hourly earnings, which is important for two reasons. Alongside total manhours, the average earnings figure gives us a good indication of personal income growth during the month. Second, the earnings figures are closely watched during periods of strong economic growth for evidence of increasing wage pressures. Such has certainly been the case over the past year, as the market's reaction to the employment data has often turned on the change in hourly earnings and its implications for the inflation outlook. 07/08/09 12:30 Unemployment Rate 9.7% 9.5% Jul Country: US Source: Bureau of Labor Statistics, U.S. Department of Labor. Raw Data Available At: http://stats.bls.gov/news.release/empsit.toc.htm Release Time: First Friday of the month at 8:30 ET for the prior month. In Brief The employment report is actually two separate reports which are the results of two separate surveys. The household survey is a survey of roughly 60,000 households. This survey produces the unemployment rate. The establishment survey is a survey of 375,000 businesses. This survey produces the nonfarm payrolls, average workweek, and average hourly earnings figures, to name a few. Both surveys cover the payroll period which includes the 12th of each month. The reports both measure employment levels, just from different angles. Due to the vastly different size of the survey samples (the establishment survey not only surveys more businesses, but each business employs many individuals), the measures of employment may differ markedly from month to month. The household survey is used only for the unemployment measure - the market focusses primarily on the more comprehensive establishment survey. Together, these two surveys make up the employment report, the most timely and broad indicator of economic activity released each month. Total payrolls are broken down into sectors such as manufacturing, mining, construction, services, and government. The markets follows these components closely as indicators of the trends in sectors of the economy; the manufacturing sector is watched the most closely as it often leads the business cycle. The data also include breakdowns of hours worked, overtime, and average hourly earnings. The average workweek (also known as hours worked) is important for two reasons. First, it is a critical determinant of such monthly indicators as industrial production and personal income. Second, it is considered a useful indicator of labor market conditions: a rising workweek early in the business cycle may be the first indication that employers are preparing to boost their payrolls, while late in the cycle a rising workweek may indicate that employers are having difficulty finding qualified applicants for open positions. Average earnings are closely followed as an indicator of potential inflation. Like the price of any good or service, the price of labor reacts to an overly accommodative monetary policy. If the price of labor is rising sharply, it may be an indication that too much money is chasing too few goods, or in this case employees. In Depth The employment report is really two reports - the household survey and the establishment survey. These two surveys contain a wealth of timely information which justify this report's status as the most important economic release of the month. This same wealth of information can nevertheless turn into a dearth of knowledge if it is not placed in the proper context. Household and Establishment Surveys The household and establishment surveys differ due to the source of the data, as the names suggest. The household survey is a survey of households and the establishment survey is a surveys of businesses. The establishment survey, which is sometimes referred to as the payrolls survey, is favored by the market for a simple reason - it is far more comprehensive. Both surveys attempt to measure employment conditions at the roughly the same point in time - the household survey covers the calendar week which includes the 12th of the month while the establishment survey covers the pay period (be it a week, two weeks, or longer) which includes the 12th. But the establishment survey covers 390,000 businesses which employ 47 million people, while the household survey covers just 50,000 individuals. With a sample size which is 940 times larger than the household survey, it is hardly surprising that the market is more interested in the establishment survey. Aside from the sample size, the surveys differ in other significant ways. The household survey counts farm workers, the self-employed, unpaid family workers, and private household workers as employed; the establishment survey does not. The household survey can only count one individual as employed once, even if that person holds two jobs. The establishment survey will double count an individual who appears on the payrolls of two companies. There are other, less significant differences, but let's turn now to the statistics produced by the two surveys. The Household Survey The Unemployment Rate As we noted earlier, the household survey is not nearly as reliable as the establishment survey due to the small size of the survey sample. This survey nevertheless receives attention, primarily because it is responsible for the one figure which is guaranteed to lead the nightly news - the unemployment rate. The unemployment rate demands little explanation, though it is worth noting that the rate can occasionally sees significant monthly changes which are due to flukes in the data. The rate is simply the result of dividing the number of people unemployed (labor force less employed) by the number of people in the labor force. The problem is that the employment and labor force measures in the household survey are far more volatile than even nonfarm payrolls. The reason, of course, is the small survey sample size. It is therefore useful to look at the labor force and employment figures themselves to determine if changes in the unemployment rate are due to aberrant swings in one or both of these series. Beyond the basics of tallying up the labor force and employment, the household survey breaks down these totals in every way imaginable - by gender, race, age, type of job, duration of unemployment, and on and on. These breakdowns seldom are of interest to the financial markets. Perhaps the only two exceptions are the discouraged worker and part-time worker measures. Discouraged Workers Discouraged workers are people who have dropped out of the labor force because they have become discouraged about their job prospects. During hard times, this statistic is often watched alongside the unemployment rate. If the job situation gets exceptionally bleak, it is possible to see the unemployment rate remaining stable not because people are finding jobs, but because they have given up looking and dropped out of the labor force. Part-Time Workers The issue of part time employment has arisen in recent years as many analysts have argued that strong payroll growth reflected the increase in the number of workers holding multiple part-time jobs. Since the payroll data do not differentiate between full and part-time workers, it is possible that a sudden surge in part-time employment which reflected poor full-time job prospects would actually boost payroll growth. In reality, it does not appear that this has happened, as part-time employment has been relatively steady in recent years. This figure nevertheless receives attention from time to time. The Big Picture Given the wealth of data contained in the employment report, it is important to take all of these indicators into account when passing judgment on the report. Looking at payrolls along is often misleading, as the workweek, earnings, and household employment measures may be telling a different story. Taken together, however, and taken with the caveats concerning monthly volatility and revisions, the employment report offers the best monthly glimpse of the economy. 07/08/09 14:00 Services PMI 58.2 Jul Country: Canada Source: Institute for Supply Management. Raw Data Available At: http://www.ism.ws/ISMReport/index.cfm Release Time: 10:00 ET on the first business day of the month for the prior month. ISM: Institute for Supply Management formerly NAPM: National Association of Purchasing Managers In Brief The ISM report is a national survey of purchasing managers which covers such indicators as new orders, production, employment, inventories, delivery times, prices, export orders, and import orders. Diffusion indexes are produced for each of these categories, with a reading over 50% indicating expansion relative to the prior month, and a sub-50% reading indicating contraction. The total index is calculated based on a weighted average of the following five sub-indexes, with weights in parentheses: new orders (30%), production (25%), employment (20%), deliveries (15%), and inventories (10%). The ISM is one of the first comprehensive economic releases of the month, typically preceding the employment report. Though it covers only the manufacturing sector, it can often provide accurate hints regarding the tone of subsequent releases. During periods of inflation concerns, the prices paid and vendor deliveries indexes often determine the bond market's reaction to the report. In Depth The Institute for Supply Management's monthly Report on Business is probably the most widely watched economic indicator produced by the private sector. There are two key reasons for the ISM's prominence. First, its longevity - the report was first produced in 1931, and after a break during World War II, it has produced continuously since 1948. Second , its leading quality - the ISM has been one of the better predictors of the business cycle over the years. More than 370 purchasing and supply management professionals in the non- manufacturing sector participate in the survey by completing a monthly questionnaire covering Business Activity, New Orders, Backlog of Orders, New Export Orders, Inventory Change, Inventory Sentiment, Imports, Prices, Employment, and Supplier Deliveries. The respondents are from more than 60 different sectors representing nine divisions from the Standard Industrial Code classification system including Agriculture, Forestry, & Fisheries; Mining; Construction; Transportation, Communications, Electric, Gas, and Sanitary Services; Wholesale Trade; Retail Trade; Finance, Insurance & Real Estate; Services; and Public Administration. Geographic location is also a consideration The results of the responses are compiled in the Non-Manufacturing NAPM Report on Business®by Ralph G. Kauffman, Ph.D., C.P.M, chair of the Non- Manufacturing Business Survey Committee. Following the initial release, this new report will be issued on the third business day of each month at 10:00 a.m. eastern Time via Business Wire and Xpedite Broadcast Fax. The National Association of Purchasing Management is a not-for-profit association that provides national and international leadership in purchasing and supply management research and education. NAPM provides its more than 44,000 members in its 180 affiliated associations with opportunities to expand their professional skills and knowledge. 07/08/09 19:00 Consumer Credit mm -3.9b -3.23b Jun Country: US Source: Federal Reserve. Raw Data Available At: http://www.census.gov/const/www/c30index.html Release Time: 15:00 ET on the fifth business day of the month (data for two months prior). This monthly measure of consumer debt is volatile and subject to massive revisions. It is also released well after every other consumer spending indicator, including weekly chain store sales, auto sales, consumer confidence, retail sales, and personal consumption. For these reasons, the market almost never reacts to the consumer credit report. Consumer credit is broken down into three categories: auto, revolving (ie, credit card), and other. Since we already have indications on total consumer spending well before this release, there is little to be gained from learning what portion of spending was financed through acquisition of debt. Periods of strong spending can be accompanied by relatively weak credit growth and vice versa, so this measure fails even as a coincident or lagging indicator. Results for the week of: 27/07/09 - 31/07/09 27 July 2009 - 31 July 2009 Timezone : GMT Date Time Importance Event Actual Forecast Previous Period 27/07/09 06:00 GFK Consumer Sentiment 3.0 2.9 Aug Country: Germany 27/07/09 08:00 M3 Money Supply yy 3.5% 3.7% Jun Country: EMU Source: Federal Reserve Board. Raw Data Available At: http://www.bog.frb.fed.us/releases/H6/Current/ Release Time: Every Thursday at 16:30 ET, data for the week ended two Mondays prior. M1: Currency + travelers checks + demand deposits + other checkable deposits (NOW accounts). M2: M1 + savings deposits + small time deposits + retail money market funds. Also, see release details. M3: M2 + large time deposits + institutional money market funds + RPs + Eurodollars. In Brief Money supply figures, and M1 specifically, once were the most important release to watch in the Treasury market, as the Fed directly targetted M1 growth in the early 1980s. The focus on money supply has long since been abandoned, however. To the extent that money supply is still monitored by the market, M2 is the favored monetary aggregate. The Fed still targets both M2 and M3 in a rhetorical sense, but these targets mean little when it comes to policy decisions. If the Fed misses its target, it is more likely to change the target than it is to change policy. In 2000, the Fed finally abandoned the targets altogether, thereby removing any remaining emphasis on this one-time star release. In DepthThough money supply measures were long ago relegated to the bottom of the Fed's list of policy tools, they are still useful in providing clues regarding the strength of the economy. This article offers a refresher on just what the monetary aggregates are - how they are constructed, why they matter, and how much the Fed cares about each. Let's start with the strict definitions. M1, the narrowest of the monetary aggregates, contains the following: 1. Currency, except that held by the Fed, Treasury, or banks/thrifts 2. Travelers checks 3. Demand deposits (non-interest bearing checking accounts), except those due to banks, the government, or foreign institutions 4. Other checkable deposits - most notably NOW (negotiable order of withdrawal) accounts. M2, the aggregate which the Fed watches most closely, contains the following: 1. M1 2. Savings deposits (including money market deposit accounts- MMDAs) 3. Time deposits (known commonly as CDs or certificates of deposit) in denominations of less than $100,000 4. Balances in retail money market funds (retail funds have minimum initial investments of less than $50,000) Finally, M3 - the broadest aggregate - contains: 1. M2 2. Time deposits in denominations of $100,000 or more 3. Balances in institutional money market funds (minimum investments of more than $50,000) 4. Overnight and term repurchase agreements 5. Overnight and term eurodollars held by U.S. residents The Decline of M1 In the early 1980s, M1 was directly targetted by the Federal Reserve, and its weekly release was of critical importance to the financial markets. Today, M1 is barely noticed, and its stock continues to decline. The reason for M1's demise as a useful indicator is financial deregulation, which enabled individuals to hold transaction balances in accounts such as MMDAs which were not included in M1. More recently, M1 has lost what little usefulness it had left as sweep accounts have undermined the narrow aggregate. Sweeps-stakes Sweep accounts are a hybrid checking account/savings account. In a typical sweep account, banks will sweep part of a NOW account's balance into an MMDA. As funds are needed to cover checks written against the NOW account, the bank will periodically shift funds from the MMDA back into the NOW account. Since the legal maximum number of withdrawals from an MMDA is six per month, all funds will be shifted back to the NOW account on the sixth transaction of the month. Sweep accounts benefit both banks and depositors. Banks benefit because MMDAs do not require any reserves to be held with the Fed, while NOW accounts are reservable. As these required reserves are non-interest bearing, banks benefit by reducing their level of required reserves. Depositors benefit because MMDAs carry higher interest rates, and thus earnings on checking balances are increased. As NOW accounts are in M1 and MMDAs are in M2, M1 has been dramatically weakened by sweeps, while M2 has not been affected (since M2 already includes M1, a shift from a NOW account to an MMDA has no impact on M2). The Rise and Fall and Rise of M2 M2 is the most closely watched monetary aggregate - both by economists and the Federal Reserve. The 1978 Humphrey-Hawkins Act mandated that the Fed set annual targets for money supply and that the Fed Chairman report to Congress twice each year regarding these targets. The Fed used to take that responsibility quite seriously - setting point targets for M1 growth, and later setting target ranges for M2 and M3. Finally, in 2000, the Fed abandoned these money targetting altogether. The reduced emphasis on M2 first became evident in the late 1980s but was sealed in the early 1990s. M2 is a useful indicator only so long as its velocity (the rate of turnover of a dollar of M2, or mathematically, nominal GDP divided by M2) is stable over the long term. Unfortunately, the long term stability of M2 velocity, which was at the core of monetarism, disappeared beginning in the late 1980s. Banks and thrifts, devastated by nonperforming assets, pulled back from their traditional lending business, with market financing sources picking up the slack. The result was a break from the long term trend in M2 velocity. Suddenly, one dollar of M2 could fund far more nominal GDP growth, as market financing increased the efficiency of the financial system. Regardless of the hows and whys - which are still debated by economists - the bottom line was that M2 was no longer a reliable indicator. It will take many years of predictable velocity before the Fed once again places much emphasis on M2 in its policy deliberations. And it is safe to say that neither M2 nor any other monetary aggregate will occupy the top spot in policy making as M1 did in the early 1980s. The record of interest rate targetting has simply been much better than that of money targetting. M3: Still Bringing Up the Rear M3 attracts more attention than it did previously, due largely to the demise of M1, but its inclusion of institutional accounts makes it less attractive than M2, which focusses on individual deposit accounts. The bottom line in determining which aggregate receives the most attention is the relative stability of its velocity. Even though M2 velocity went off course in the early 1990s, it has still been the most predictable of the three during the postwar period. 27/07/09 14:00 New Home sales 0.35m 0.342m Jun Country: US Source: The Census Bureau of the Department of Commerce. Raw Data Available At: http://www.census.gov/const/newressales.pdf Release Time: 10:00 ET around the last business day of the month (data for month prior). The report indicates the level of new privately owned one-family houses sold and for sale. New home sales usually have a lagged reaction to changing mortgage rates. They also tend to be stronger early in the business cycle when pent-up demand is strong, and they fade later in the cycle as the demand for housing is sated. In addition to home sales, the market monitors the number of homes for sale relative to the current sales pace. As this inventory measure falls (rises), housing starts tend to rise (fall). Finally, the median home price provides an indication of inflation in the housing sector, though only year/year changes provide any meaningful information. The home sales report is quite volatile and subject to huge revisions, making any one month's reading very unreliable. The report rarely prompts a market reaction. The market prefers the existing home sales report, which has a sample data pool four times as large and is released earlier in the month. 27/07/09 16:00 Mid-West Mnfg Activity 78.2 Jun Country: US 27/07/09 22:45 International Trade Balance mm 858.0m Jun Country: NewZealand Source: The Census Bureau and the Bureau of Economic Analysis of the Department of Commerce. Raw Data Available At: http://www.census.gov/foreign-trade/www/press.html Release Time: 8:30 ET around the 20th of the month (data for two months prior). The trade report is most widely watched for trends in the overall trade balance. But trends in both exports and imports of goods and services bear watching as well. The export data in particular are important to watch for indications that a strengthening competitive position at home and/or strengthening economies overseas are boosting U.S. growth. Imports provide an indication of domestic demand, but given the severe lag of this report relative to other consumption indicators, it is not particularly valuable for this purpose. The volatility in the monthly trade balance can play an important role in GDP forecasts. Net exports are a relatively volatile component of GDP, and the trade report provides the only early clues to the net export performance each quarter. 27/07/09 22:45 International Trade Balance yy -3.04b Jun Country: NewZealand Source: The Census Bureau and the Bureau of Economic Analysis of the Department of Commerce. Raw Data Available At: http://www.census.gov/foreign-trade/www/press.html Release Time: 8:30 ET around the 20th of the month (data for two months prior). The trade report is most widely watched for trends in the overall trade balance. But trends in both exports and imports of goods and services bear watching as well. The export data in particular are important to watch for indications that a strengthening competitive position at home and/or strengthening economies overseas are boosting U.S. growth. Imports provide an indication of domestic demand, but given the severe lag of this report relative to other consumption indicators, it is not particularly valuable for this purpose. The volatility in the monthly trade balance can play an important role in GDP forecasts. Net exports are a relatively volatile component of GDP, and the trade report provides the only early clues to the net export performance each quarter. 28/07/09 03:00 Reserve Bank of Australia Governor Speech Country: Australia 28/07/09 10:00 CBI Sales -12.0 -17.0 Jul Country: UK Source: The Confederation of British Industry (CBI). Raw Data Available At: http://www.cbi.org.uk/home.html First introduced in 1983, this authoritative indicator of short-term trends in the UK retail and wholesale distribution sector carries significant weight in the formulation of economic policy at the Bank of England and within Government. Quarterly and monthly surveys Aimed at senior executives and sales managers and released on a monthly and quarterly basis, this quarterly survey tracks optimism, employment, prices, investment and stocks. The monthly issue provides a vital update on volume of sales, orders and stocks. A wealth of information This timely guide to retail and wholesale trade is published within seven days of its closing date and covers: 1. Total distribution 2. Retail, wholesale and motor trade activity 3. Employment 4. Type of outlet 5. Twenty-three individual sectors The importance of this survey's data is reflected in its regular supply to the European Commission's harmonised survey of retail trade. 28/07/09 13:00 House Prices -0.6% -0.6% May Country: US 28/07/09 14:00 Richmond Fed srvs -26.0 Jul Country: US Source: Chicago Purchasing Managers Association. Raw Data Available At: http://www.phil.frb.org/ Release Time: Last business day of the month at 10 ET for the current month. In Brief There are many regional manufacturing surveys, and they tend to be ranked in order of timeliness and the importance of the region. The Philadelphia Fed's survey is first each month, actually coming out during the third week of the month for which it is reporting. Several smaller surveys are then released before the Chicago purchasing managers' report on the last day of each month. A few, such as the Atlanta and Richmond Fed surveys, are released after the NAPM and are of little value. The purchasing managers' reports are measured like the national NAPM - 50% marks the breakeven line between an expanding and contracting manufacturing sector. For the Philadelphia and Atlanta Fed indexes, 0 is the breakeven mark. These surveys can be of some help in forecasting the national NAPM - particularly the Philadelphia and Chicago surveys which are more closely watched due to their timeliness and the fact that these regions represent a reasonable cross section of national manufacturing activities. In Depth The market has been bombarded with a bevy of surveys purporting to measure manufacturing activity in every nook and cranny of the country. First it was Philadelphia, then Chicago, and Detroit, Milwaukee, New York, Cincinnati, Richmond, Atlanta, Boston, and there might as well have been a Nome survey. This hodge-podge of releases is begging for someone - namely us - to come along and cut this group down to a more manageable size. Nuts and Bolts Let's start with the issue of what these manufacturing surveys are trying to measure and how they go about doing it. The leader of this pack of regional surveys is the ISM index which comes from the Institute for Supply Management (formerly the National Association of Purchasing Managers). It has been around since 1931 (1948 on an uninterrupted basis), it is national, and it is one of the most timely measures of manufacturing activity available. In other words, it sets the standards by which its progeny are measured. The ISM index is actually a composite of five sub-indexes - new orders, production, supplier deliveries, inventories, and employment. In surveying over 300 companies each month, the ISM asks for positive, negative, or unchanged readings on each of these indicators. The positive responses are added to one half of the unchanged responses to produce the diffusion index. For example, if 50% of respondents reported stronger orders, 40% reported weaker, and 10% unchanged, the diffusion index for orders would be 55%, the 50% positive plus half of the 10% unchanged. To calculate the total index, the ISM uses weights for the five indicators, which are as follows: 30% new orders, 25% production, 20% employment, 15% supplier deliveries, and 10% inventories. The Selection Criteria Since this methodology has made the ISM index one of the better leading indicators of economic activity over the years, we will measure the usefulness of the regional indexes based on their ability to help in forecasting the national index. In our effort to arrive at the most important regional indices, these criteria make eliminating most of the candidates easy for one simple reason - they are released after the national index. While regional economic developments are of interest to those who live in the region, they are not particularly important to the markets. If a region cannot help in forecasting national trends, then its data are not particularly useful. So say adios to Atlanta, Richmond, Kansas City, and who knows how many others which have cropped up in recent years. And the Winner Is... Let's focus on the regional surveys which precede the release of the national index on the first business day of each month (with data for the prior month). The contestants are Philadelphia, Chicago, Milwaukee, Detroit, New York, and the most recent addition to the bunch - the APICS survey. We looked at the correlation of all of these indexes to the national NAPM and found substantial differences in their forecasting ability. The winners are...drum roll please...Chicago and Philadelphia, in that order. The Chicago PMI (officially known as the Business Barometer) is a monthly composite index based on opinion surveys of more than 200 Chicago purchasing managers regarding the manufacturing industry. The survey responses are limited to three options: slower, faster and same. As such, the index will not capture if a component is growing but at a much slower rate or vice versa. The index is a composite of seven similarly constructed indexes including: new orders, production, supplier delivery times, backlogs, inventories, prices paid, and employment. New orders and orders backlog indices indicate future production activity. It signals factory-sector expansion when it is above 50 and contraction when below it. The index is seasonally adjusted for the effects of variations within the year, differences due to holidays and institutional changes. Because it is an opinion survey, it is often influenced by respondents' perception of current events, as opposed to actual hard data. Also, it does not capture technological and production changes, which make it possible for production to expand, while employment contracts. Because the Chicago PMI is released the day before the ISM, it is watched in order to predict the more important ISM report (the Chicago PMI has an impressive 91% correlation with the ISM national NAPM), which is in itself a good leading indicator of overall economic activity. It frequently moves markets. The Philadelphia Fed index, which is released on the third Thursday of the month (with data for the same month), was a distant second at 76%. Philly Fed's performance improved slightly to 78% when Briefing measured its results using the NAPM methodology. The Philly index as released is not a composite of its subindexes, as the NAPM is. Instead, the Philly Fed survey asks many questions, but the total index is based on the general question "are business conditions better or worse than last month." It is often the case that a weighted measure of the individual questions on specifics such as new orders and production moves in a different direction than the index based on the general question. The rest of the regional indexes fared poorly, ranging from correlations as poor as 55% (APICS) to 73% (Milwaukee). Chicago was the clear winner, but the Philly Fed index definitely deserves recognition, particularly since it is released so much earlier than the rest. In the future, then, we would recommend setting aside most of the regional manufacturing surveys and focussing on just Philly and Chicago, which offer the best hope of predicting the national index. And when you look at the Philly index, improve your chances by looking at the Philly numbers calculated on an NAPM basis, which Briefing will be happy to provide. 28/07/09 14:00 Consumer Confidence 50.0 49.3 Jul Country: US Source: The Conference Board. Raw Data Available At: http://www.tcb-indicators.org/ Release Time: 10:00 ET on the last Tuesday of the month (data for current month). This survey measures the level of confidence individual households have in the performance of the economy now and in the future. It is a leading indicator of future spending and the business cycle. 5000 consumers in the nine census divisions across the country are surveyed each month. The level of consumer confidence is directly correlated to the strength of consumer spending, which accounts for two-thirds of the economy. It also correlates closely with joblessness, inflation, and real incomes. The report can occasionally be helpful in predicting sudden shifts in consumption patterns, though most small changes in the index are just noise. Only index changes of at least five points should be considered significant. The index consists of two subindexes - consumers' appraisal of current conditions and their expectations for the future. Expectations make up 60% of the total index, with current conditions accounting for the other 40%. The expectations index is typically seen as having better leading indicator qualities than the current conditions index. The more confident consumers are about the economy and their own personal finances, the more likely they are to spend. Note, changes in consumer confidence and retail sales do not move in tandem month by month. If the economy experiences a long-term expansion, buying intentions may decline even while the jobless rate declines because of the satisfaction of pent-up demand. Conversely, if inflation begins to accelerate, spending plans may increase for the short-term as consumers buy now to avoid having to pay higher prices later. Regional differences in consumer confidence are an indication of differing business cycles across the nation. This has implications for spending on durable goods and, more importantly, for residential real estate markets. Financial markets interpret rising consumer confidence as a precursor to higher consumer spending. Higher consumer spending could in turn spark inflation. Look for a change in the direction of the six month moving average of the index. Consumers do not usually have the necessary information to accurately assess income and job growth six months in the future. The report provides information on planned spending, which does not necessarily turn into actual spending, although it is unlikely that increasing consumer confidence would be followed by a decline in spending. The Consumer Confidence survey is not useful for any type of forecasting. 28/07/09 22:45 Building Permits -5% 3.5% Jun Country: NewZealand Source: The Census Bureau of the Department of Commerce. Raw Data Available At: http://www.census.gov/const/www/newresconstindex.html Release Time: 8:30 ET around the 16th of the month (data for one month prior). Housing Starts are a measure of the number of residential units on which construction is begun each month. A start in construction is defined as the beginning of excavation of the foundation for the building and is comprised primarily of residential housing. Building permits are permits taken out in order to allow excavation. An increase in building permits and starts usually occurs a few months after a reduction in mortgage rates. Permits lead starts, but permits are not required in all regions of the country, and the level of permits therefore tends to be less than the level of starts over time. The monthly national report is broken down by region: Northeast, Midwest, South, and West. Briefing recommends analyzing the regional data because they are subject to a high degree of volatility. The high volatility can be attributed to weather changes and/or natural disasters. For example, an unexpectedly high level of rain in South could delay housing starts for the region. 28/07/09 23:50 Retail Sales mm -2.5% -2.8% Jun Country: Japan Source: The Census Bureau of the Department of Commerce. Raw Data Available At: http://www.census.gov/svsd/www/advtable.html Release Time: 8:30 ET around the 13th of the month (data for one month prior). The retail sales report is a measure of the total receipts of retail stores. The changes in retail sales are widely followed as the most timely indicator of broad consumer spending patterns. Retail sales are often viewed ex-autos, as auto sales can move sharply from month-to-month. It is also important to keep an eye on the gas and food components, where changes in sales are often a result of price changes rather than shifting consumer demand. Retail sales can be quite volatile and the advance reports are subject to rather large revisions. Retail sales do not include spending on services, which makes up over half of total consumption. Total personal consumption is not available until the personal income and consumption reports are released, typically two weeks after retail sales. 29/07/09 12:30 New orders XD 0.3% 1.4% Jun Country: US Source: The Census Bureau of the Department of Commerce. Raw Data Available At: http://www.census.gov/ftp/pub/indicator/www/m3/index.htm Release Time: 8:30 ET around the 26th of the month (data for month prior). The durable orders release measures the dollar volume of orders, shipments, and unfilled orders of durable goods (defined as goods whose intended lifespan is three years or more). Orders are considered a leading indicator of manufacturing activity, and the market often moves on this report despite the volatility and large revisions that make it a less than perfect indicator. These problems can be minimized by looking at the breakdown of orders. The total number is often skewed by huge increases in aircraft and defense orders. An increase based solely on strength in one sector tends to be discounted, while the market is more impressed with broadbased increases in orders. Also notable in this report is the narrow category of nondefense capital goods. These goods mirror the GDP category producers' durable equipment (PDE) -- the largest component of business investment. Shipments of nondefense capital goods are a good proxy for PDE in the current quarter, while nondefense capital goods orders provide an indication of PDE growth in the quarters ahead. 29/07/09 12:30 Durable Goods Orders -0.5% 1.8% Jun Country: US Source: The Census Bureau of the Department of Commerce. Raw Data Available At: http://www.census.gov/ftp/pub/indicator/www/m3/index.htm Release Time: 8:30 ET around the 26th of the month (data for month prior). The durable orders release measures the dollar volume of orders, shipments, and unfilled orders of durable goods (defined as goods whose intended lifespan is three years or more). Orders are considered a leading indicator of manufacturing activity, and the market often moves on this report despite the volatility and large revisions that make it a less than perfect indicator. These problems can be minimized by looking at the breakdown of orders. The total number is often skewed by huge increases in aircraft and defense orders. An increase based solely on strength in one sector tends to be discounted, while the market is more impressed with broadbased increases in orders. Also notable in this report is the narrow category of nondefense capital goods. These goods mirror the GDP category producers' durable equipment (PDE) -- the largest component of business investment. Shipments of nondefense capital goods are a good proxy for PDE in the current quarter, while nondefense capital goods orders provide an indication of PDE growth in the quarters ahead. 29/07/09 18:00 Fed Beige Book Country: US Source: The Federal Reserve Open Market Committee. Raw Data Available At: http://www.federalreserve.gov/FOMC/ Release Time: 14:00 ET two weeks prior to the FOMC meeting (data for one month prior). Officially known as the Survey on Current Economic Conditions, the Beige Book, is published eight times per year by a Federal Reserve Bank, containing anecdotal information on current economic and business conditions in its District (Boston, Philadelphia, Richmond, Cleveland, Chicago, Atlanta, St. Louis, Dallas, Minneapolis, Kansas City, San Francisco) through reports from Bank and Branch directors, and interviews with key business contacts, economists, market experts, and other sources. The Beige Book highlights the activity information by District and sector. The survey normally covers a period of about 4-weeks in duration, and is released two weeks prior to each FOMC meeting, which is also held eight times per year. While being deemed by some as a lagging report, the Beige Book has usually served as a helpful indicator to FOMC policy decisions on monetary policy. 29/07/09 21:00 Interest Rate Decision 2.5% 2.5% Jul Country: NewZealand Source (U.S.): The Federal Reserve Open Market Committee - FOMC. Source (World): The Central Bank Monetary Policy Committee - MPC. The Federal Open Market Committee is a twelve-member committee made up of the seven members of the Board of Governors and five Federal Reserve Bank presidents. It meets eight times per year to determine the near-term direction of monetary policy, such as setting guidelines for the purchase and sale of government securities and setting policy relating to System operations in the foreign exchange markets. These changes in monetary policy are now announced immediately after FOMC meetings. Most importantly, the Fed determines interest rate policy at FOMC meetings. Market participants speculate about the possibility of an interest rate change at these meetings, and if the outcome is different from expectations, the impact on the markets can be dramatic and far-reaching. The interest rate set by the Fed the federal funds rate serves as a benchmark for all other rates. A change in the fed funds rate, the lending rate banks charge each other for the use of overnight funds, translates directly through to all other interest rates from Treasury bonds to mortgage loans. It also changes the dynamics of competition for investor dollars: when bonds yield 10 percent, they will attract more money away from stocks then when they only yield 5 percent. The level of interest rates affects the economy­ higher rates tend to slow activity; lower rates stimulate activity, a ripple effect that expands into all sectors of the economy. 30/07/09 04:30 Building Permits -12.5% Jun Country: Australia Source: The Census Bureau of the Department of Commerce. Raw Data Available At: http://www.census.gov/const/www/newresconstindex.html Release Time: 8:30 ET around the 16th of the month (data for one month prior). Housing Starts are a measure of the number of residential units on which construction is begun each month. A start in construction is defined as the beginning of excavation of the foundation for the building and is comprised primarily of residential housing. Building permits are permits taken out in order to allow excavation. An increase in building permits and starts usually occurs a few months after a reduction in mortgage rates. Permits lead starts, but permits are not required in all regions of the country, and the level of permits therefore tends to be less than the level of starts over time. The monthly national report is broken down by region: Northeast, Midwest, South, and West. Briefing recommends analyzing the regional data because they are subject to a high degree of volatility. The high volatility can be attributed to weather changes and/or natural disasters. For example, an unexpectedly high level of rain in South could delay housing starts for the region. 30/07/09 08:00 Unemployment Rate 8.4% 8.3% Jul Country: Germany Source: Bureau of Labor Statistics, U.S. Department of Labor. Raw Data Available At: http://stats.bls.gov/news.release/empsit.toc.htm Release Time: First Friday of the month at 8:30 ET for the prior month. In Brief The employment report is actually two separate reports which are the results of two separate surveys. The household survey is a survey of roughly 60,000 households. This survey produces the unemployment rate. The establishment survey is a survey of 375,000 businesses. This survey produces the nonfarm payrolls, average workweek, and average hourly earnings figures, to name a few. Both surveys cover the payroll period which includes the 12th of each month. The reports both measure employment levels, just from different angles. Due to the vastly different size of the survey samples (the establishment survey not only surveys more businesses, but each business employs many individuals), the measures of employment may differ markedly from month to month. The household survey is used only for the unemployment measure - the market focusses primarily on the more comprehensive establishment survey. Together, these two surveys make up the employment report, the most timely and broad indicator of economic activity released each month. Total payrolls are broken down into sectors such as manufacturing, mining, construction, services, and government. The markets follows these components closely as indicators of the trends in sectors of the economy; the manufacturing sector is watched the most closely as it often leads the business cycle. The data also include breakdowns of hours worked, overtime, and average hourly earnings. The average workweek (also known as hours worked) is important for two reasons. First, it is a critical determinant of such monthly indicators as industrial production and personal income. Second, it is considered a useful indicator of labor market conditions: a rising workweek early in the business cycle may be the first indication that employers are preparing to boost their payrolls, while late in the cycle a rising workweek may indicate that employers are having difficulty finding qualified applicants for open positions. Average earnings are closely followed as an indicator of potential inflation. Like the price of any good or service, the price of labor reacts to an overly accommodative monetary policy. If the price of labor is rising sharply, it may be an indication that too much money is chasing too few goods, or in this case employees. In Depth The employment report is really two reports - the household survey and the establishment survey. These two surveys contain a wealth of timely information which justify this report's status as the most important economic release of the month. This same wealth of information can nevertheless turn into a dearth of knowledge if it is not placed in the proper context. Household and Establishment Surveys The household and establishment surveys differ due to the source of the data, as the names suggest. The household survey is a survey of households and the establishment survey is a surveys of businesses. The establishment survey, which is sometimes referred to as the payrolls survey, is favored by the market for a simple reason - it is far more comprehensive. Both surveys attempt to measure employment conditions at the roughly the same point in time - the household survey covers the calendar week which includes the 12th of the month while the establishment survey covers the pay period (be it a week, two weeks, or longer) which includes the 12th. But the establishment survey covers 390,000 businesses which employ 47 million people, while the household survey covers just 50,000 individuals. With a sample size which is 940 times larger than the household survey, it is hardly surprising that the market is more interested in the establishment survey. Aside from the sample size, the surveys differ in other significant ways. The household survey counts farm workers, the self-employed, unpaid family workers, and private household workers as employed; the establishment survey does not. The household survey can only count one individual as employed once, even if that person holds two jobs. The establishment survey will double count an individual who appears on the payrolls of two companies. There are other, less significant differences, but let's turn now to the statistics produced by the two surveys. The Household Survey The Unemployment Rate As we noted earlier, the household survey is not nearly as reliable as the establishment survey due to the small size of the survey sample. This survey nevertheless receives attention, primarily because it is responsible for the one figure which is guaranteed to lead the nightly news - the unemployment rate. The unemployment rate demands little explanation, though it is worth noting that the rate can occasionally sees significant monthly changes which are due to flukes in the data. The rate is simply the result of dividing the number of people unemployed (labor force less employed) by the number of people in the labor force. The problem is that the employment and labor force measures in the household survey are far more volatile than even nonfarm payrolls. The reason, of course, is the small survey sample size. It is therefore useful to look at the labor force and employment figures themselves to determine if changes in the unemployment rate are due to aberrant swings in one or both of these series. Beyond the basics of tallying up the labor force and employment, the household survey breaks down these totals in every way imaginable - by gender, race, age, type of job, duration of unemployment, and on and on. These breakdowns seldom are of interest to the financial markets. Perhaps the only two exceptions are the discouraged worker and part-time worker measures. Discouraged Workers Discouraged workers are people who have dropped out of the labor force because they have become discouraged about their job prospects. During hard times, this statistic is often watched alongside the unemployment rate. If the job situation gets exceptionally bleak, it is possible to see the unemployment rate remaining stable not because people are finding jobs, but because they have given up looking and dropped out of the labor force. Part-Time Workers The issue of part time employment has arisen in recent years as many analysts have argued that strong payroll growth reflected the increase in the number of workers holding multiple part-time jobs. Since the payroll data do not differentiate between full and part-time workers, it is possible that a sudden surge in part-time employment which reflected poor full-time job prospects would actually boost payroll growth. In reality, it does not appear that this has happened, as part-time employment has been relatively steady in recent years. This figure nevertheless receives attention from time to time. The Big Picture Given the wealth of data contained in the employment report, it is important to take all of these indicators into account when passing judgment on the report. Looking at payrolls along is often misleading, as the workweek, earnings, and household employment measures may be telling a different story. Taken together, however, and taken with the caveats concerning monthly volatility and revisions, the employment report offers the best monthly glimpse of the economy. 30/07/09 09:00 Service Sentiment -20.0 Jul Country: EMU 30/07/09 09:00 Consumer Confidence -24.0 -25.0 Jul Country: EMU Source: The Conference Board. Raw Data Available At: http://www.tcb-indicators.org/ Release Time: 10:00 ET on the last Tuesday of the month (data for current month). This survey measures the level of confidence individual households have in the performance of the economy now and in the future. It is a leading indicator of future spending and the business cycle. 5000 consumers in the nine census divisions across the country are surveyed each month. The level of consumer confidence is directly correlated to the strength of consumer spending, which accounts for two-thirds of the economy. It also correlates closely with joblessness, inflation, and real incomes. The report can occasionally be helpful in predicting sudden shifts in consumption patterns, though most small changes in the index are just noise. Only index changes of at least five points should be considered significant. The index consists of two subindexes - consumers' appraisal of current conditions and their expectations for the future. Expectations make up 60% of the total index, with current conditions accounting for the other 40%. The expectations index is typically seen as having better leading indicator qualities than the current conditions index. The more confident consumers are about the economy and their own personal finances, the more likely they are to spend. Note, changes in consumer confidence and retail sales do not move in tandem month by month. If the economy experiences a long-term expansion, buying intentions may decline even while the jobless rate declines because of the satisfaction of pent-up demand. Conversely, if inflation begins to accelerate, spending plans may increase for the short-term as consumers buy now to avoid having to pay higher prices later. Regional differences in consumer confidence are an indication of differing business cycles across the nation. This has implications for spending on durable goods and, more importantly, for residential real estate markets. Financial markets interpret rising consumer confidence as a precursor to higher consumer spending. Higher consumer spending could in turn spark inflation. Look for a change in the direction of the six month moving average of the index. Consumers do not usually have the necessary information to accurately assess income and job growth six months in the future. The report provides information on planned spending, which does not necessarily turn into actual spending, although it is unlikely that increasing consumer confidence would be followed by a decline in spending. The Consumer Confidence survey is not useful for any type of forecasting. 30/07/09 12:30 Initial Jobless Claims 554.0k L/W Country: US Source: The Employment and Training Administration of the Department of Labor. Raw Data Available At: http://www.dol.gov/opa/media/press/eta/main.htm Release Time: 8:30 ET each Thursday (data for week ended prior Saturday). This survey measures the attitudes and expectations concerning both present and future economic conditions of 500 consumers. The Michigan index is almost identical to the Conference Board Consumer Confidence index, though there are two monthly releases, a preliminary and final reading. Like the Conference Board index, it has two subindexes - expectations and current conditions. The expectations index is a component of the Conference Board's Leading Indicators index. 30/07/09 12:30 Producer Price Index (PPI) mm -1.1% Jun Country: US Source: Bureau of Labor statistics, U.S. Department of Labor. Raw Data Available At: http://stats.bls.gov/news.release/ppi.toc.htm Release Time: Around the 11th of each month at 8:30 ET for the prior month. The Producer Price Index measures prices of goods at the wholesale level. There are three broad subcategories within PPI: crude, intermediate, and finished. The market tracks the finished goods index most closely, as it represents prices for goods that are ready for sale to the end user. Goods prices at the crude and intermediate stages of production often provide an indication of coming (dis)inflationary pressures, but the closer you get to crude goods, the more that these prices track commodity prices which are already available in traded indexes such as the CRB (Commodity Research Bureau). At all stages of production, the market places more emphasis on the index excluding food and energy, referred to as the core rate. Food and energy prices tend to be quite volatile and obscure trends in the underlying inflation rate. Though the market reaction is determined by the month/month changes, year/year changes are also noted by analysts. The index is not revised on a monthly basis, but annual revisions to seasonal adjustment factors can produce small adjustments to past releases. 30/07/09 12:30 Producer Price Index (PPI) yy -4.3% Jun Country: US Source: Bureau of Labor statistics, U.S. Department of Labor. Raw Data Available At: http://stats.bls.gov/news.release/ppi.toc.htm Release Time: Around the 11th of each month at 8:30 ET for the prior month. The Producer Price Index measures prices of goods at the wholesale level. There are three broad subcategories within PPI: crude, intermediate, and finished. The market tracks the finished goods index most closely, as it represents prices for goods that are ready for sale to the end user. Goods prices at the crude and intermediate stages of production often provide an indication of coming (dis)inflationary pressures, but the closer you get to crude goods, the more that these prices track commodity prices which are already available in traded indexes such as the CRB (Commodity Research Bureau). At all stages of production, the market places more emphasis on the index excluding food and energy, referred to as the core rate. Food and energy prices tend to be quite volatile and obscure trends in the underlying inflation rate. Though the market reaction is determined by the month/month changes, year/year changes are also noted by analysts. The index is not revised on a monthly basis, but annual revisions to seasonal adjustment factors can produce small adjustments to past releases. 30/07/09 23:00 GFK Consumer Sentiment -23.0 -25.0 Jul Country: UK 30/07/09 23:15 Manufacturing PMI 48.2 Jul Country: Japan Source: Institute for Supply Management. Raw Data Available At: http://www.ism.ws/ISMReport/index.cfm Release Time: 10:00 ET on the first business day of the month for the prior month. ISM: Institute for Supply Management formerly NAPM: National Association of Purchasing Managers In Brief The ISM report is a national survey of purchasing managers which covers such indicators as new orders, production, employment, inventories, delivery times, prices, export orders, and import orders. Diffusion indexes are produced for each of these categories, with a reading over 50% indicating expansion relative to the prior month, and a sub-50% reading indicating contraction. The total index is calculated based on a weighted average of the following five sub-indexes, with weights in parentheses: new orders (30%), production (25%), employment (20%), deliveries (15%), and inventories (10%). The ISM is one of the first comprehensive economic releases of the month, typically preceding the employment report. Though it covers only the manufacturing sector, it can often provide accurate hints regarding the tone of subsequent releases. During periods of inflation concerns, the prices paid and vendor deliveries indexes often determine the bond market's reaction to the report. In Depth The Institute for Supply Management's monthly Report on Business is probably the most widely watched economic indicator produced by the private sector. There are two key reasons for the ISM's prominence. First, its longevity - the report was first produced in 1931, and after a break during World War II, it has produced continuously since 1948. Second , its leading quality - the ISM has been one of the better predictors of the business cycle over the years. Who and What It Surveys The ISM index is the result of a monthly survey of over 400 companies in 20 industries throughout the 50 states. The survey queries respondents on a number of monthly indicators, including orders, production, employment, inventories, delivery times, prices paid, export orders, and import orders. Respondents are asked to characterize each indicator as higher, lower, or unchanged for the month (or faster/slower in the case of delivery times). They are not asked for specific numbers - only a thumbs up or down. Presenting the Numbers Based on these responses, the ISM calculates diffusion indexes for each of the components. These diffusion indexes are calculated by adding half of the percentage of respondents answering "unchanged" to the percentage answering "higher" (or "slower" for deliveries). These diffusion indexes do not yield estimates of specific magnitudes of strength or weakness, but the more respondents who are indicating trends in the same direction - the better the chance that the magnitude of that move is larger. A diffusion index of 50% is the theoretical breakeven mark - with readings above indicating strength and below indicating weakness. The ISM only provides the raw data - the Department of Commerce produces the seasonal factors which are used to provide more meaningful, seasonally adjusted indexes. The total index is not the result of a separate question regarding general business conditions (as is the case with the Philadelphia Fed index). Instead, the index is calculated using the weighted sum of five of the subindexes. Orders account for 30% of the total; production - 25%; employment - 20%; deliveries - 15%; inventories - 10%. Prices, export orders, and import orders are not part of the total index. Breakevens in Theory and Practice Though 50% is the breakeven mark in theory, different readings have proved to be breakeven in practice. For new orders, 50.3% is the level consistent with breakeven readings in factory orders. For production, 49.4% has been the breakeven mark in theory and practice. For employment, 47.5% has been consistent with a steady level of manufacturing employment. For inventories, 41.3% has been consistent with steady business inventory readings. And finally, the 42.7% mark on the total index marks the point below which the overall economy is believed to be in recession. Between 42.7-50%, the manufacturing sector may be in decline, but the total economy is only seeing slower growth. No Services This observation highlights the important element which is missing from the ISM index - the service sector. With the manufacturing sector making up an ever- shrinking percentage of the total economy - the ISM might seem to be an indicator in decline. Not so, however - the manufacturing sector, while shrinking in relative terms, still tends to lead the total economy into and out of recessions. The ISM therefore remains a closely watched indicator despite its manufacturing focus. A Proven Performer The ISM's leading quality has been proven over time. Its bottom during a recession has preceded the turning point for the business cycle by an average of four months, and its worst performance in leading the turning point was on two occasions when the ISM trough occurred in the same month as the business cycle trough. The ISM index is released on the first business day of each at 10:00 ET, with data for the prior calendar month. 30/07/09 23:30 House hold Spending 0.3% 0.3% Jun Country: Japan 30/07/09 23:30 Consumer Price Index (CPI) yy -1.7% -1.1% Jun Country: Japan Source: Bureau of Labor statistics, U.S. Department of Labor. Raw Data Available At: http://stats.bls.gov/news.release/cpi.toc.htm Release Time: 8:30 ET, about the 13th of each month for the prior month. The Consumer Price Index is a measure of the price level of a fixed market basket of goods and services purchased by consumers. CPI is the most widely cited inflation indicator, and it is used to calculate cost of living adjustments for government programs and it is the basis of COLAs for many private labor agreements as well. It has been criticized for overstating inflation, because it does not adjust for substitution effects and because the fixed basket does not reflect price changes in new technology goods which are often declining in price. Despite these criticisms, it remains the benchmark inflation index. 30/07/09 23:30 Consumer Price Index (CPI) mm -1.1% Jun Country: Japan Source: Bureau of Labor statistics, U.S. Department of Labor. Raw Data Available At: http://stats.bls.gov/news.release/cpi.toc.htm Release Time: 8:30 ET, about the 13th of each month for the prior month. The Consumer Price Index is a measure of the price level of a fixed market basket of goods and services purchased by consumers. CPI is the most widely cited inflation indicator, and it is used to calculate cost of living adjustments for government programs and it is the basis of COLAs for many private labor agreements as well. It has been criticized for overstating inflation, because it does not adjust for substitution effects and because the fixed basket does not reflect price changes in new technology goods which are often declining in price. Despite these criticisms, it remains the benchmark inflation index. 30/07/09 23:30 Unemployment 5.3% 5.2% Jun Country: Japan 31/07/09 08:30 KOF Purchasing Manager ind -1.65 Jul Country: Switzerland 31/07/09 09:00 Harm. Index of Consumer Prices yy -0.4% -0.1% Jul Country: EMU Source: EU Eurostat. Raw Data Available At: ttp://europa.eu.int/comm/eurostat/ HICP is the inflation indicator used by the European Central Bank: The method for calculating the CPI varies in different countries and can cause problems for international comparisons. To address this problem, a harmonized index of consumer prices (HICP) have been developed within EU, based on coordinated methodology. HICP is a fundamental indicator for the European Central Bank (ECB) in evaluating EMU's monetary policy goals. HICP is also used to follow up the convergence criteria for price stability with regards to membership in EMU. 1996 is the base year and the index is calculated starting in 1995. Certain entries that are currently treated particularly differently in the calculation of national CPIs have been excluded. One particular difference compared with the CPI is that interest costs for owner-occupied homes are not included in the HICP. In addition, certain costs of owner-occupied homes (repairs, real-estate taxes, write-offs, insurance and ground rents), fees for tenant-owned flats, as well as lotteries, pools and tote betting are excluded. Some entries are included in the HICP but not in the CPI. These include childcare, elder care, hospital care and certain financial services (services where the fee is proportional to the size of the transaction). HICP is based on a completely harmonized product classification, COICOP (Classification Of Individual Consumption by Purpose). Harmonized rules for coverage, consideration of new products, updating the product sample, adjustments for changes in quality, and index formulas for the calculations are also used in calculating the HICP. The methods for calculating the index numbers and price changes for the HICP differ to a certain extent from the CPI. Similar to the CPI, the HICP is a chained index with yearly links but a long-term index is not calculated. Instead, yearly links in the HICP are calculated in the same way as the CPI's short-term index. 31/07/09 09:00 Unemployment 9.7% 9.5% Jun Country: EMU 31/07/09 12:30 Core PCE qq 2.3% 1.6% Q2 Country: US Source: The Bureau of Economic Analysis of the Department of Commerce. Raw Data Available At: http://www.bea.doc.gov/bea/rels.htm Release Time: 1 Personal income measures income from all sources. The largest component of total income is wages and salaries, a figure which can be estimated using payrolls and earnings data from the employment report. Beyond that, there are many other categories of income, including rental income, government subsidy payments, interest income, and dividend income. Personal income is a decent indicator of future consumer demand, but it is not perfect. Recessions usually occur when consumers stop spending, which then drives down income growth. Looking solely at income growth, one may therefore miss the turning point when consumers stop spending. The income report also includes a section covering personal consumption expenditures, also known as PCE. PCE is comprised of three categories: durables, nondurables, and services. The retail sales report will provide a good read on durable and nondurable consumption, while service purchases tend to grow at a fairly steady pace, making this a relatively predictable report, and ranking it well below retail sales in terms of market importance. 31/07/09 12:30 Gross Domestic Product (GDP) mm -0.1% May Country: Canada Source: Bureau of Economic Analysis, U.S. Department of Commerce. Raw Data Available At: http://www.bea.doc.gov/bea/dn1.htm Release Time: Third or fourth week of the month at 8:30 ET for the prior quarter, with subsequent revisions released in the second and third months of the quarter. Gross Domestic Product (GDP) is the broadest measure of economic activity. Annualized quarterly percent changes in GDP reflect the growth rate of total economic output. The figures can be quite volatile from quarter to quarter. Inventory and net export swings in particular can produce significant volatility in GDP. The final sales figure, which excludes inventories, can sometimes be helpful in identifying underlying growth trends as inventories represent unsold goods, and a large inventory increase will boost GDP but might be indicative of weakness rather than strength. The broad components of GDP are: consumption, investment, net exports, government purchases, and inventories. Consumption is by far the largest component, totalling roughly 2/3rds of GDP. In addition to the GDP figures, there are GDP deflators, which measure the change in prices in total GDP and for each component. Though the consumer price index is a more closely watched inflation indicator, the GDP deflator is another key inflation measure. Unlike CPI, it has the advantage of not being a fixed basket of goods and services, so that changes in consumption patterns or the introduction of new goods and services will be reflected in the deflator. With both GDP and the deflator, the market tends to focus on the quarter/quarter change. Year/year changes are also cited frequently, though they do not provide the most timely indications of economic activity or inflation. The bond market often reacts to GDP, though the price moves are typically small, as much of the GDP data is easily predicted using monthly economic releases such as personal consumption, durable goods shipments, construction spending, international trade, and inventories. Quarterly GDP reports are broken down into three announcements: advance, preliminary, and final. After the final revision, GDP is not revised again until the annual benchmark revisions each July. These revisions can be quite large and usually affect the past five years of data. 31/07/09 15:30 Chicago PMI 42.1 39.9 Jul Country: US Source: Chicago Purchasing Managers Association. Raw Data Available At: http://www.phil.frb.org/ Release Time: Last business day of the month at 10 ET for the current month. In Brief There are many regional manufacturing surveys, and they tend to be ranked in order of timeliness and the importance of the region. The Philadelphia Fed's survey is first each month, actually coming out during the third week of the month for which it is reporting. Several smaller surveys are then released before the Chicago purchasing managers' report on the last day of each month. A few, such as the Atlanta and Richmond Fed surveys, are released after the NAPM and are of little value. The purchasing managers' reports are measured like the national NAPM - 50% marks the breakeven line between an expanding and contracting manufacturing sector. For the Philadelphia and Atlanta Fed indexes, 0 is the breakeven mark. These surveys can be of some help in forecasting the national NAPM - particularly the Philadelphia and Chicago surveys which are more closely watched due to their timeliness and the fact that these regions represent a reasonable cross section of national manufacturing activities. In Depth The market has been bombarded with a bevy of surveys purporting to measure manufacturing activity in every nook and cranny of the country. First it was Philadelphia, then Chicago, and Detroit, Milwaukee, New York, Cincinnati, Richmond, Atlanta, Boston, and there might as well have been a Nome survey. This hodge-podge of releases is begging for someone - namely us - to come along and cut this group down to a more manageable size. Nuts and Bolts Let's start with the issue of what these manufacturing surveys are trying to measure and how they go about doing it. The leader of this pack of regional surveys is the ISM index which comes from the Institute for Supply Management (formerly the National Association of Purchasing Managers). It has been around since 1931 (1948 on an uninterrupted basis), it is national, and it is one of the most timely measures of manufacturing activity available. In other words, it sets the standards by which its progeny are measured. The ISM index is actually a composite of five sub-indexes - new orders, production, supplier deliveries, inventories, and employment. In surveying over 300 companies each month, the ISM asks for positive, negative, or unchanged readings on each of these indicators. The positive responses are added to one half of the unchanged responses to produce the diffusion index. For example, if 50% of respondents reported stronger orders, 40% reported weaker, and 10% unchanged, the diffusion index for orders would be 55%, the 50% positive plus half of the 10% unchanged. To calculate the total index, the ISM uses weights for the five indicators, which are as follows: 30% new orders, 25% production, 20% employment, 15% supplier deliveries, and 10% inventories. The Selection Criteria Since this methodology has made the ISM index one of the better leading indicators of economic activity over the years, we will measure the usefulness of the regional indexes based on their ability to help in forecasting the national index. In our effort to arrive at the most important regional indices, these criteria make eliminating most of the candidates easy for one simple reason - they are released after the national index. While regional economic developments are of interest to those who live in the region, they are not particularly important to the markets. If a region cannot help in forecasting national trends, then its data are not particularly useful. So say adios to Atlanta, Richmond, Kansas City, and who knows how many others which have cropped up in recent years. And the Winner Is... Let's focus on the regional surveys which precede the release of the national index on the first business day of each month (with data for the prior month). The contestants are Philadelphia, Chicago, Milwaukee, Detroit, New York, and the most recent addition to the bunch - the APICS survey. We looked at the correlation of all of these indexes to the national NAPM and found substantial differences in their forecasting ability. The winners are...drum roll please...Chicago and Philadelphia, in that order. The Chicago PMI (officially known as the Business Barometer) is a monthly composite index based on opinion surveys of more than 200 Chicago purchasing managers regarding the manufacturing industry. The survey responses are limited to three options: slower, faster and same. As such, the index will not capture if a component is growing but at a much slower rate or vice versa. The index is a composite of seven similarly constructed indexes including: new orders, production, supplier delivery times, backlogs, inventories, prices paid, and employment. New orders and orders backlog indices indicate future production activity. It signals factory-sector expansion when it is above 50 and contraction when below it. The index is seasonally adjusted for the effects of variations within the year, differences due to holidays and institutional changes. Because it is an opinion survey, it is often influenced by respondents' perception of current events, as opposed to actual hard data. Also, it does not capture technological and production changes, which make it possible for production to expand, while employment contracts. Because the Chicago PMI is released the day before the ISM, it is watched in order to predict the more important ISM report (the Chicago PMI has an impressive 91% correlation with the ISM national NAPM), which is in itself a good leading indicator of overall economic activity. It frequently moves markets. The Philadelphia Fed index, which is released on the third Thursday of the month (with data for the same month), was a distant second at 76%. Philly Fed's performance improved slightly to 78% when Briefing measured its results using the NAPM methodology. The Philly index as released is not a composite of its subindexes, as the NAPM is. Instead, the Philly Fed survey asks many questions, but the total index is based on the general question "are business conditions better or worse than last month." It is often the case that a weighted measure of the individual questions on specifics such as new orders and production moves in a different direction than the index based on the general question. The rest of the regional indexes fared poorly, ranging from correlations as poor as 55% (APICS) to 73% (Milwaukee). Chicago was the clear winner, but the Philly Fed index definitely deserves recognition, particularly since it is released so much earlier than the rest. In the future, then, we would recommend setting aside most of the regional manufacturing surveys and focussing on just Philly and Chicago, which offer the best hope of predicting the national index. And when you look at the Philly index, improve your chances by looking at the Philly numbers calculated on an NAPM basis, which Briefing will be happy to provide. Results for the week of:19/07/09 - 24/07/09 19 July 2009 - 24 July 2009 Timezone GMT Date Time Importance Event Actual Forecast Previous Period *****20/07/09 Market Holiday Country: Japan *****20/07/09 01:30 Producer Price Index (PPI) mm -0.8% -0.1% -0.4% Q2 Country: Australia Source: Bureau of Labor statistics, U.S. Department of Labor. Raw Data Available At: http://stats.bls.gov/news.release/ppi.toc.htm Release Time: Around the 11th of each month at 8:30 ET for the prior month. The Producer Price Index measures prices of goods at the wholesale level. There are three broad subcategories within PPI: crude, intermediate, and finished. The market tracks the finished goods index most closely, as it represents prices for goods that are ready for sale to the end user. Goods prices at the crude and intermediate stages of production often provide an indication of coming (dis)inflationary pressures, but the closer you get to crude goods, the more that these prices track commodity prices which are already available in traded indexes such as the CRB (Commodity Research Bureau). At all stages of production, the market places more emphasis on the index excluding food and energy, referred to as the core rate. Food and energy prices tend to be quite volatile and obscure trends in the underlying inflation rate. Though the market reaction is determined by the month/month changes, year/year changes are also noted by analysts. The index is not revised on a monthly basis, but annual revisions to seasonal adjustment factors can produce small adjustments to past releases. *****20/07/09 01:30 Producer Price Index (PPI) yy 2.1% 2.9% 4.0% Q2 Country: Australia Source: Bureau of Labor statistics, U.S. Department of Labor. Raw Data Available At: http://stats.bls.gov/news.release/ppi.toc.htm Release Time: Around the 11th of each month at 8:30 ET for the prior month. The Producer Price Index measures prices of goods at the wholesale level. There are three broad subcategories within PPI: crude, intermediate, and finished. The market tracks the finished goods index most closely, as it represents prices for goods that are ready for sale to the end user. Goods prices at the crude and intermediate stages of production often provide an indication of coming (dis)inflationary pressures, but the closer you get to crude goods, the more that these prices track commodity prices which are already available in traded indexes such as the CRB (Commodity Research Bureau). At all stages of production, the market places more emphasis on the index excluding food and energy, referred to as the core rate. Food and energy prices tend to be quite volatile and obscure trends in the underlying inflation rate. Though the market reaction is determined by the month/month changes, year/year changes are also noted by analysts. The index is not revised on a monthly basis, but annual revisions to seasonal adjustment factors can produce small adjustments to past releases. *****20/07/09 06:00 Producer Price Index (PPI) mm -0.1% 0.5% 0.0% Jun Country: Germany Source: Bureau of Labor statistics, U.S. Department of Labor. Raw Data Available At: http://stats.bls.gov/news.release/ppi.toc.htm Release Time: Around the 11th of each month at 8:30 ET for the prior month. The Producer Price Index measures prices of goods at the wholesale level. There are three broad subcategories within PPI: crude, intermediate, and finished. The market tracks the finished goods index most closely, as it represents prices for goods that are ready for sale to the end user. Goods prices at the crude and intermediate stages of production often provide an indication of coming (dis)inflationary pressures, but the closer you get to crude goods, the more that these prices track commodity prices which are already available in traded indexes such as the CRB (Commodity Research Bureau). At all stages of production, the market places more emphasis on the index excluding food and energy, referred to as the core rate. Food and energy prices tend to be quite volatile and obscure trends in the underlying inflation rate. Though the market reaction is determined by the month/month changes, year/year changes are also noted by analysts. The index is not revised on a monthly basis, but annual revisions to seasonal adjustment factors can produce small adjustments to past releases. *****20/07/09 06:00 Producer Price Index (PPI) yy -4.6% -4.3% -3.6% Jun Country: Germany Source: Bureau of Labor statistics, U.S. Department of Labor. Raw Data Available At: http://stats.bls.gov/news.release/ppi.toc.htm Release Time: Around the 11th of each month at 8:30 ET for the prior month. The Producer Price Index measures prices of goods at the wholesale level. There are three broad subcategories within PPI: crude, intermediate, and finished. The market tracks the finished goods index most closely, as it represents prices for goods that are ready for sale to the end user. Goods prices at the crude and intermediate stages of production often provide an indication of coming (dis)inflationary pressures, but the closer you get to crude goods, the more that these prices track commodity prices which are already available in traded indexes such as the CRB (Commodity Research Bureau). At all stages of production, the market places more emphasis on the index excluding food and energy, referred to as the core rate. Food and energy prices tend to be quite volatile and obscure trends in the underlying inflation rate. Though the market reaction is determined by the month/month changes, year/year changes are also noted by analysts. The index is not revised on a monthly basis, but annual revisions to seasonal adjustment factors can produce small adjustments to past releases. *****20/07/09 12:30 Wholesale Trade -0.3% -2.1% -0.6% May Country: Canada Source: The Census Bureau of the Department of Commerce. Raw Data Available At: http://www.census.gov/svsd/www/mwts.html Release Time: 10:00 ET around the fifth business day of the month (data for two months prior). The wholesale trade report includes sales and inventory statistics from the second stage of the manufacturing process. The sales figures say close to nothing about personal consumption and therefore do not move the market. Wholesale inventories sometimes swing enough to change the aggregate inventory profile (aggregate inventory is the sum of inventory at the manufacturing, wholesale, and retail levels), which may affect the GDP outlook. In that event they can elicit a small market reaction. More often than not, however, this release goes unnoticed except by market economists. *****20/07/09 14:00 Leading Economic Indicators 0.7% 0.5% 1.2% Jun Country: US Source: The Conference Board. Raw Data Available At: http://www.tcb-indicators.org/ Release Time: 8:30 ET around the third week of the month for the month prior. In Brief The Leading Indicators report is, for the most part, a compendium of previously announced economic indicators: new orders, jobless claims, money supply, average workweek, building permits, and stock prices. Therefore, the report is extremely predictable and of very little interest to the market. Though this series does have some predictive qualities, it is a common criticism that it has predicted "nine of the last six" recessions. The Commerce Department previously published the leading indicators series. The collection and publishing of these data is now done by the non-profit Conference Board, which also produces the Consumer Confidence index. In Depth Purpose The purpose of the leading index is straightforward: It is designed to signal turning points in the business cycle. Composition The index of leading indicators includes the ten economic statistics listed below. 1. The interest rate spread between 10-year Treasury notes and the federal funds rate. 2. The inflation-adjusted, M2 measure of the money supply. 3. The average manufacturing workweek. 4. Manufacturers' new orders for consumer goods and materials. 5. The S&P 500 measure of stock prices. 6. The vendor performance component of the NAPM index. 7. The average level of weekly initial claims for unemployment insurance. 8. Building permits. 9. The University of Michigan index of consumer expectations. 10. Manufacturers' new orders for nondefense capital goods. The Conference Board, the organization that produces the leading index, standardizes these variables according to their individual weights in order to construct a composite leading index. Note that we have listed the components in order of importance. The difference between 10-year Treasuries and the fed funds rate carries the most weight; historically, this approximation of the slope of the yield curve has proven relatively more successful than other components at predicting future economic activity. Along those same lines, orders for nondefense capital goods carry the smallest weight because they have typically proven relatively poorer at pointing to changes in the direction of economic growth at large. Performance The leading index receives plenty of criticism. Indeed, skeptics often joke that it has correctly signalled nine of the last six recessions. Meanwhile, in its literature, The Conference Board cites the lead times with which the leading index has correctly predicted economic downturns. It is thus fair to ask whether the leading index is useless or priceless. The answer lies somewhere in between. The charge that the index predicts recessions that do not come to fruition--and fails to warn of those that do--is hardly a fair criticism. No forecaster, even armed with an arsenal of economic statistics, has a perfect track record when it comes to predicting recessions. It is therefore unreasonable to assume that a ten-component index can do any better. That said, the index does have some reliability problems. For example, it failed to turn down prior to the 1990-91 recession, and in 1995 it signalled a downturn that never came to pass. Usefulness The leading index is more useful now that The Conference Board has taken control of it (the Department of Commerce stopped producing it at the end of 1996). Conference Board researchers quickly scrapped two of the old components--the change in sensitive materials prices and unfilled orders for durable goods--and added the interest-rate spread that appears in our list above. The index now lacks a wholesale price term, which some see as critical to determining future demand and inflation trends, but on net the new index emits less pronounced false signals and does a better job than it used to. Briefing finds the leading index most helpful when we can make a statement like this: The leading index has decreased only once during the past year. Of course, even a strong trend like that does not guarantee that a recession will not form over the coming six to nine months. But we can get additional help from looking at the leading index with the coincident index, which is also published by The Conference Board, and alongside a couple of other leading indices published by Columbia University. Indeed, there exists much research that deals with the criteria for determining recession warnings (i.e., the leading index must fall during four of seven months and the coincident index must fall for three straight months). *****20/07/09 23:50 Protocol of last interest rate meeting Jun Country: Japan *****21/07/09 06:15 International Trade Balance mm 2013m Jun Country: Switzerland Source: The Census Bureau and the Bureau of Economic Analysis of the Department of Commerce. Raw Data Available At: http://www.census.gov/foreign-trade/www/press.html Release Time: 8:30 ET around the 20th of the month (data for two months prior). The trade report is most widely watched for trends in the overall trade balance. But trends in both exports and imports of goods and services bear watching as well. The export data in particular are important to watch for indications that a strengthening competitive position at home and/or strengthening economies overseas are boosting U.S. growth. Imports provide an indication of domestic demand, but given the severe lag of this report relative to other consumption indicators, it is not particularly valuable for this purpose. The volatility in the monthly trade balance can play an important role in GDP forecasts. Net exports are a relatively volatile component of GDP, and the trade report provides the only early clues to the net export performance each quarter. *****21/07/09 13:00 Interest Rate Decision 0.25% Jul Country: Canada Source (U.S.): The Federal Reserve Open Market Committee - FOMC. Source (World): The Central Bank Monetary Policy Committee - MPC. The Federal Open Market Committee is a twelve-member committee made up of the seven members of the Board of Governors and five Federal Reserve Bank presidents. It meets eight times per year to determine the near-term direction of monetary policy, such as setting guidelines for the purchase and sale of government securities and setting policy relating to System operations in the foreign exchange markets. These changes in monetary policy are now announced immediately after FOMC meetings. Most importantly, the Fed determines interest rate policy at FOMC meetings. Market participants speculate about the possibility of an interest rate change at these meetings, and if the outcome is different from expectations, the impact on the markets can be dramatic and far-reaching. The interest rate set by the Fed the federal funds rate serves as a benchmark for all other rates. A change in the fed funds rate, the lending rate banks charge each other for the use of overnight funds, translates directly through to all other interest rates from Treasury bonds to mortgage loans. It also changes the dynamics of competition for investor dollars: when bonds yield 10 percent, they will attract more money away from stocks then when they only yield 5 percent. The level of interest rates affects the economy­ higher rates tend to slow activity; lower rates stimulate activity, a ripple effect that expands into all sectors of the economy. *****21/07/09 14:00 Fed Chairman Bernanke Speaks Country: US *****22/07/09 01:30 Consumer Price Index (CPI) mm 0.5% 0.1% Q2 Country: Australia Source: Bureau of Labor statistics, U.S. Department of Labor. Raw Data Available At: http://stats.bls.gov/news.release/cpi.toc.htm Release Time: 8:30 ET, about the 13th of each month for the prior month. The Consumer Price Index is a measure of the price level of a fixed market basket of goods and services purchased by consumers. CPI is the most widely cited inflation indicator, and it is used to calculate cost of living adjustments for government programs and it is the basis of COLAs for many private labor agreements as well. It has been criticized for overstating inflation, because it does not adjust for substitution effects and because the fixed basket does not reflect price changes in new technology goods which are often declining in price. Despite these criticisms, it remains the benchmark inflation index. *****22/07/09 01:30 Consumer Price Index (CPI) yy 1.5% 2.5% Q2 Country: Australia Source: Bureau of Labor statistics, U.S. Department of Labor. Raw Data Available At: http://stats.bls.gov/news.release/cpi.toc.htm Release Time: 8:30 ET, about the 13th of each month for the prior month. The Consumer Price Index is a measure of the price level of a fixed market basket of goods and services purchased by consumers. CPI is the most widely cited inflation indicator, and it is used to calculate cost of living adjustments for government programs and it is the basis of COLAs for many private labor agreements as well. It has been criticized for overstating inflation, because it does not adjust for substitution effects and because the fixed basket does not reflect price changes in new technology goods which are often declining in price. Despite these criticisms, it remains the benchmark inflation index. *****22/07/09 08:30 Protocol of last interest rate meeting Country: UK *****22/07/09 09:00 Factory Orders mm 1.8% -1.0% May Country: EMU Source: The Census Bureau of the Department of Commerce. Raw Data Available At: http://www.census.gov/ftp/pub/indicator/www/m3/index.htm Release Time: 10:00 ET around the first business day of the month (data for two months prior). Factory orders consist of the earlier announced durable goods report plus non- durable goods orders. The report is very predictable with nondurables the only new component. Nondurables consist of such items as food and tobacco products which grow at a fairly consistent monthly rate, so that market forecasts for this report are far more accurate than for the durable orders report. In addition to seeing nondurables for the first time, the market also watches for revisions to the durable orders data, which can be significant. At present, durable goods orders sum to about 54% of total orders. The final piece of new information in this report is factory inventories -- the first glimpse at the inventory picture each month (wholesales inventories are typically released a week later, with retail inventories released a few days after wholesale inventories). Though the inventory figure is not a market-mover, economists use this number to help forecast inventories in the quarterly GDP report. *****22/07/09 09:00 Factory Orders yy -28.5% -35.5% May Country: EMU Source: The Census Bureau of the Department of Commerce. Raw Data Available At: http://www.census.gov/ftp/pub/indicator/www/m3/index.htm Release Time: 10:00 ET around the first business day of the month (data for two months prior). Factory orders consist of the earlier announced durable goods report plus non- durable goods orders. The report is very predictable with nondurables the only new component. Nondurables consist of such items as food and tobacco products which grow at a fairly consistent monthly rate, so that market forecasts for this report are far more accurate than for the durable orders report. In addition to seeing nondurables for the first time, the market also watches for revisions to the durable orders data, which can be significant. At present, durable goods orders sum to about 54% of total orders. The final piece of new information in this report is factory inventories -- the first glimpse at the inventory picture each month (wholesales inventories are typically released a week later, with retail inventories released a few days after wholesale inventories). Though the inventory figure is not a market-mover, economists use this number to help forecast inventories in the quarterly GDP report. *****22/07/09 10:00 CBI Orders -45.0 -51.0 Jul Country: UK Source: The Confederation of British Industry (CBI). Raw Data Available At: http://www.cbi.org.uk/home.html First introduced in 1983, this authoritative indicator of short-term trends in the UK retail and wholesale distribution sector carries significant weight in the formulation of economic policy at the Bank of England and within Government. Quarterly and monthly surveys Aimed at senior executives and sales managers and released on a monthly and quarterly basis, this quarterly survey tracks optimism, employment, prices, investment and stocks. The monthly issue provides a vital update on volume of sales, orders and stocks. A wealth of information This timely guide to retail and wholesale trade is published within seven days of its closing date and covers: 1. Total distribution 2. Retail, wholesale and motor trade activity 3. Employment 4. Type of outlet 5. Twenty-three individual sectors The importance of this survey's data is reflected in its regular supply to the European Commission's harmonised survey of retail trade. *****22/07/09 12:30 Core Retail Sales mm -0.5% May Country: Canada Source: The Census Bureau of the Department of Commerce. Raw Data Available At: http://www.census.gov/svsd/www/advtable.html Release Time: 8:30 ET around the 13th of the month (data for one month prior). The retail sales report is a measure of the total receipts of retail stores. The changes in retail sales are widely followed as the most timely indicator of broad consumer spending patterns. Retail sales are often viewed ex-autos, as auto sales can move sharply from month-to-month. It is also important to keep an eye on the gas and food components, where changes in sales are often a result of price changes rather than shifting consumer demand. *****22/07/09 12:30 Retail Sales mm -0.8% May Country: Canada Source: The Census Bureau of the Department of Commerce. Raw Data Available At: http://www.census.gov/svsd/www/advtable.html Release Time: 8:30 ET around the 13th of the month (data for one month prior). The retail sales report is a measure of the total receipts of retail stores. The changes in retail sales are widely followed as the most timely indicator of broad consumer spending patterns. Retail sales are often viewed ex-autos, as auto sales can move sharply from month-to-month. It is also important to keep an eye on the gas and food components, where changes in sales are often a result of price changes rather than shifting consumer demand. Retail sales can be quite volatile and the advance reports are subject to rather large revisions. Retail sales do not include spending on services, which makes up over half of total consumption. Total personal consumption is not available until the personal income and consumption reports are released, typically two weeks after retail sales. *****22/07/09 14:00 House Prices -0.1% May Country: US *****22/07/09 23:50 International Trade Balance yy 620b 299.8b Jun Country: Japan Source: The Census Bureau and the Bureau of Economic Analysis of the Department of Commerce. Raw Data Available At: http://www.census.gov/foreign-trade/www/press.html Release Time: 8:30 ET around the 20th of the month (data for two months prior). The trade report is most widely watched for trends in the overall trade balance. But trends in both exports and imports of goods and services bear watching as well. The export data in particular are important to watch for indications that a strengthening competitive position at home and/or strengthening economies overseas are boosting U.S. growth. Imports provide an indication of domestic demand, but given the severe lag of this report relative to other consumption indicators, it is not particularly valuable for this purpose. The volatility in the monthly trade balance can play an important role in GDP forecasts. Net exports are a relatively volatile component of GDP, and the trade report provides the only early clues to the net export performance each quarter. *****23/07/09 08:00 Capital Flow -7.3b May Country: EMU The Capital Account records a nation's incoming and outgoing investment flows such as payments for entire or parts of companies (direct or portfolio investment), stocks, bonds, bank accounts, real estate and factories. The balance of payments is influenced by many factors, including the financial and economic climate of other countries. Short-term capital movements Short-term flows into liquid assets such as bank deposits and Treasury bills are easily reversed and are sometimes characterised as "hot money". Since flows can change direction at the drop of an interest rate, they can cause severe volatility in the currency markets. Long-term capital movements Long-term capital includes portfolio investment (stocks and shares) and direct investment (such as building a factory overseas). However, it is perhaps increasingly unrealistic to distinguish between investment in stocks and shares (long-term capital) and the acquisition of Treasury bills (short-term capital). An outflow today implies current-account income in the future. Indeed, with global deregulation, it is easier for companies to raise their market share by setting up production facilities overseas. The initial direct investment shows as a capital-account outflow. Subsequently remitted profits add to current-account inflows and boost GNP relative to GDP. The value of goods sold, however, does not show up in external trade or increase GDP in the way that exports from home would. *****23/07/09 08:30 Retail Sales mm 0.5% -0.6% Jun Country: UK Source: The Census Bureau of the Department of Commerce. Raw Data Available At: http://www.census.gov/svsd/www/advtable.html Release Time: 8:30 ET around the 13th of the month (data for one month prior). The retail sales report is a measure of the total receipts of retail stores. The changes in retail sales are widely followed as the most timely indicator of broad consumer spending patterns. Retail sales are often viewed ex-autos, as auto sales can move sharply from month-to-month. It is also important to keep an eye on the gas and food components, where changes in sales are often a result of price changes rather than shifting consumer demand. Retail sales can be quite volatile and the advance reports are subject to rather large revisions. Retail sales do not include spending on services, which makes up over half of total consumption. Total personal consumption is not available until the personal income and consumption reports are released, typically two weeks after retail sales. *****23/07/09 08:30 Retail Sales yy 2.3% -1.6% Jun Country: UK Source: The Census Bureau of the Department of Commerce. Raw Data Available At: http://www.census.gov/svsd/www/advtable.html Release Time: 8:30 ET around the 13th of the month (data for one month prior). The retail sales report is a measure of the total receipts of retail stores. The changes in retail sales are widely followed as the most timely indicator of broad consumer spending patterns. Retail sales are often viewed ex-autos, as auto sales can move sharply from month-to-month. It is also important to keep an eye on the gas and food components, where changes in sales are often a result of price changes rather than shifting consumer demand. Retail sales can be quite volatile and the advance reports are subject to rather large revisions. Retail sales do not include spending on services, which makes up over half of total consumption. Total personal consumption is not available until the personal income and consumption reports are released, typically two weeks after retail sales. *****23/07/09 12:30 Initial Jobless Claims 522k L/W Country: US Source: The Employment and Training Administration of the Department of Labor. Raw Data Available At: http://www.dol.gov/opa/media/press/eta/main.htm Release Time: 8:30 ET each Thursday (data for week ended prior Saturday). This survey measures the attitudes and expectations concerning both present and future economic conditions of 500 consumers. The Michigan index is almost identical to the Conference Board Consumer Confidence index, though there are two monthly releases, a preliminary and final reading. Like the Conference Board index, it has two subindexes - expectations and current conditions. The expectations index is a component of the Conference Board's Leading Indicators index. *****23/07/09 14:00 Existing Home Sales (Units) 4.81 4.77 Jun Country: US Source: The National Association of Realtors. Raw Data Available At: (USA): http://www.realtor.org/research.nsf/pages/EHSdata Release Time: 10:00 ET around the 25th of the month (data for month prior). The name speaks for itself - this report provides a measure of the level of sales of existing home sales. The report is considered a decent indicator of activity in the housing sector. Housing starts precede this report each month, but starts are a supply rather than demand-side indicator. Existing home sales precede the other key demand-side indicator of housing - new home sales - thus boosting the visibility of this report. Sales are highly dependent on mortgage rates, and will tend to react with a few months lag to changes in rates. Sales are also determined by the level of pent-up demand for housing - immediately after a recession, sales are typically quite strong due to the demand which accumulated through the recession. The survey sample for existing home sales is larger than that of new home sales, making it somewhat less susceptible to large revisions. Both reports can see huge month-to-month swings in winter, when bad weather can significantly affect sales. Aside from total sales, two other indicators are worth watching in this report -- the inventory of homes for sale and the median price. The inventory of homes for sale at the current sales pace is the inventory/sales ratio of the housing sector. For example, a 5.0 figure for inventory/sales indicates that the supply of homes for sale would be depleted within five months at the current sales pace. The lower this figure goes, the greater the need for new housing starts. The year/year change in the median price provides a good indication of inflation in home prices. 24/07/09 07:28 Composite PMI 44.0 Jul Country: Germany *****24/07/09 07:28 Services PMI 46.0 45.2 Jul Country: Germany Source: Institute for Supply Management. Raw Data Available At: http://www.ism.ws/ISMReport/index.cfm Release Time: 10:00 ET on the first business day of the month for the prior month. ISM: Institute for Supply Management formerly NAPM: National Association of Purchasing Managers In Brief The ISM report is a national survey of purchasing managers which covers such indicators as new orders, production, employment, inventories, delivery times, prices, export orders, and import orders. Diffusion indexes are produced for each of these categories, with a reading over 50% indicating expansion relative to the prior month, and a sub-50% reading indicating contraction. The total index is calculated based on a weighted average of the following five sub-indexes, with weights in parentheses: new orders (30%), production (25%), employment (20%), deliveries (15%), and inventories (10%). The ISM is one of the first comprehensive economic releases of the month, typically preceding the employment report. Though it covers only the manufacturing sector, it can often provide accurate hints regarding the tone of subsequent releases. During periods of inflation concerns, the prices paid and vendor deliveries indexes often determine the bond market's reaction to the report. In Depth The Institute for Supply Management's monthly Report on Business is probably the most widely watched economic indicator produced by the private sector. There are two key reasons for the ISM's prominence. First, its longevity - the report was first produced in 1931, and after a break during World War II, it has produced continuously since 1948. Second , its leading quality - the ISM has been one of the better predictors of the business cycle over the years. More than 370 purchasing and supply management professionals in the non- manufacturing sector participate in the survey by completing a monthly questionnaire covering Business Activity, New Orders, Backlog of Orders, New Export Orders, Inventory Change, Inventory Sentiment, Imports, Prices, Employment, and Supplier Deliveries. The respondents are from more than 60 different sectors representing nine divisions from the Standard Industrial Code classification system including Agriculture, Forestry, & Fisheries; Mining; Construction; Transportation, Communications, Electric, Gas, and Sanitary Services; Wholesale Trade; Retail Trade; Finance, Insurance & Real Estate; Services; and Public Administration. Geographic location is also a consideration The results of the responses are compiled in the Non-Manufacturing NAPM Report on Business®by Ralph G. Kauffman, Ph.D., C.P.M, chair of the Non- Manufacturing Business Survey Committee. Following the initial release, this new report will be issued on the third business day of each month at 10:00 a.m. eastern Time via Business Wire and Xpedite Broadcast Fax. The National Association of Purchasing Management is a not-for-profit association that provides national and international leadership in purchasing and supply management research and education. NAPM provides its more than 44,000 members in its 180 affiliated associations with opportunities to expand their professional skills and knowledge. *****24/07/09 07:28 Manufacturing PMI 42.0 40.9 Jul Country: Germany Source: Institute for Supply Management. Raw Data Available At: http://www.ism.ws/ISMReport/index.cfm Release Time: 10:00 ET on the first business day of the month for the prior month. ISM: Institute for Supply Management formerly NAPM: National Association of Purchasing Managers In Brief The ISM report is a national survey of purchasing managers which covers such indicators as new orders, production, employment, inventories, delivery times, prices, export orders, and import orders. Diffusion indexes are produced for each of these categories, with a reading over 50% indicating expansion relative to the prior month, and a sub-50% reading indicating contraction. The total index is calculated based on a weighted average of the following five sub-indexes, with weights in parentheses: new orders (30%), production (25%), employment (20%), deliveries (15%), and inventories (10%). The ISM is one of the first comprehensive economic releases of the month, typically preceding the employment report. Though it covers only the manufacturing sector, it can often provide accurate hints regarding the tone of subsequent releases. During periods of inflation concerns, the prices paid and vendor deliveries indexes often determine the bond market's reaction to the report. In Depth The Institute for Supply Management's monthly Report on Business is probably the most widely watched economic indicator produced by the private sector. There are two key reasons for the ISM's prominence. First, its longevity - the report was first produced in 1931, and after a break during World War II, it has produced continuously since 1948. Second , its leading quality - the ISM has been one of the better predictors of the business cycle over the years. Who and What It Surveys The ISM index is the result of a monthly survey of over 400 companies in 20 industries throughout the 50 states. The survey queries respondents on a number of monthly indicators, including orders, production, employment, inventories, delivery times, prices paid, export orders, and import orders. Respondents are asked to characterize each indicator as higher, lower, or unchanged for the month (or faster/slower in the case of delivery times). They are not asked for specific numbers - only a thumbs up or down. Presenting the Numbers Based on these responses, the ISM calculates diffusion indexes for each of the components. These diffusion indexes are calculated by adding half of the percentage of respondents answering "unchanged" to the percentage answering "higher" (or "slower" for deliveries). These diffusion indexes do not yield estimates of specific magnitudes of strength or weakness, but the more respondents who are indicating trends in the same direction - the better the chance that the magnitude of that move is larger. A diffusion index of 50% is the theoretical breakeven mark - with readings above indicating strength and below indicating weakness. The ISM only provides the raw data - the Department of Commerce produces the seasonal factors which are used to provide more meaningful, seasonally adjusted indexes. The total index is not the result of a separate question regarding general business conditions (as is the case with the Philadelphia Fed index). Instead, the index is calculated using the weighted sum of five of the subindexes. Orders account for 30% of the total; production - 25%; employment - 20%; deliveries - 15%; inventories - 10%. Prices, export orders, and import orders are not part of the total index. Breakevens in Theory and Practice Though 50% is the breakeven mark in theory, different readings have proved to be breakeven in practice. For new orders, 50.3% is the level consistent with breakeven readings in factory orders. For production, 49.4% has been the breakeven mark in theory and practice. For employment, 47.5% has been consistent with a steady level of manufacturing employment. For inventories, 41.3% has been consistent with steady business inventory readings. And finally, the 42.7% mark on the total index marks the point below which the overall economy is believed to be in recession. Between 42.7-50%, the manufacturing sector may be in decline, but the total economy is only seeing slower growth. No Services This observation highlights the important element which is missing from the ISM index - the service sector. With the manufacturing sector making up an ever- shrinking percentage of the total economy - the ISM might seem to be an indicator in decline. Not so, however - the manufacturing sector, while shrinking in relative terms, still tends to lead the total economy into and out of recessions. The ISM therefore remains a closely watched indicator despite its manufacturing focus. A Proven Performer The ISM's leading quality has been proven over time. Its bottom during a recession has preceded the turning point for the business cycle by an average of four months, and its worst performance in leading the turning point was on two occasions when the ISM trough occurred in the same month as the business cycle trough. The ISM index is released on the first business day of each at 10:00 ET, with data for the prior calendar month. *****24/07/09 07:58 Composite PMI 45.5 44.6 Jul Country: EMU *****24/07/09 07:58 Manufacturing PMI 43.5 42.6 Jul Country: EMU Source: Institute for Supply Management. Raw Data Available At: http://www.ism.ws/ISMReport/index.cfm Release Time: 10:00 ET on the first business day of the month for the prior month. ISM: Institute for Supply Management formerly NAPM: National Association of Purchasing Managers In Brief The ISM report is a national survey of purchasing managers which covers such indicators as new orders, production, employment, inventories, delivery times, prices, export orders, and import orders. Diffusion indexes are produced for each of these categories, with a reading over 50% indicating expansion relative to the prior month, and a sub-50% reading indicating contraction. The total index is calculated based on a weighted average of the following five sub-indexes, with weights in parentheses: new orders (30%), production (25%), employment (20%), deliveries (15%), and inventories (10%). The ISM is one of the first comprehensive economic releases of the month, typically preceding the employment report. Though it covers only the manufacturing sector, it can often provide accurate hints regarding the tone of subsequent releases. During periods of inflation concerns, the prices paid and vendor deliveries indexes often determine the bond market's reaction to the report. In Depth The Institute for Supply Management's monthly Report on Business is probably the most widely watched economic indicator produced by the private sector. There are two key reasons for the ISM's prominence. First, its longevity - the report was first produced in 1931, and after a break during World War II, it has produced continuously since 1948. Second , its leading quality - the ISM has been one of the better predictors of the business cycle over the years. Who and What It Surveys The ISM index is the result of a monthly survey of over 400 companies in 20 industries throughout the 50 states. The survey queries respondents on a number of monthly indicators, including orders, production, employment, inventories, delivery times, prices paid, export orders, and import orders. Respondents are asked to characterize each indicator as higher, lower, or unchanged for the month (or faster/slower in the case of delivery times). They are not asked for specific numbers - only a thumbs up or down. Presenting the Numbers Based on these responses, the ISM calculates diffusion indexes for each of the components. These diffusion indexes are calculated by adding half of the percentage of respondents answering "unchanged" to the percentage answering "higher" (or "slower" for deliveries). These diffusion indexes do not yield estimates of specific magnitudes of strength or weakness, but the more respondents who are indicating trends in the same direction - the better the chance that the magnitude of that move is larger. A diffusion index of 50% is the theoretical breakeven mark - with readings above indicating strength and below indicating weakness. The ISM only provides the raw data - the Department of Commerce produces the seasonal factors which are used to provide more meaningful, seasonally adjusted indexes. The total index is not the result of a separate question regarding general business conditions (as is the case with the Philadelphia Fed index). Instead, the index is calculated using the weighted sum of five of the subindexes. Orders account for 30% of the total; production - 25%; employment - 20%; deliveries - 15%; inventories - 10%. Prices, export orders, and import orders are not part of the total index. Breakevens in Theory and Practice Though 50% is the breakeven mark in theory, different readings have proved to be breakeven in practice. For new orders, 50.3% is the level consistent with breakeven readings in factory orders. For production, 49.4% has been the breakeven mark in theory and practice. For employment, 47.5% has been consistent with a steady level of manufacturing employment. For inventories, 41.3% has been consistent with steady business inventory readings. And finally, the 42.7% mark on the total index marks the point below which the overall economy is believed to be in recession. Between 42.7-50%, the manufacturing sector may be in decline, but the total economy is only seeing slower growth. No Services This observation highlights the important element which is missing from the ISM index - the service sector. With the manufacturing sector making up an ever- shrinking percentage of the total economy - the ISM might seem to be an indicator in decline. Not so, however - the manufacturing sector, while shrinking in relative terms, still tends to lead the total economy into and out of recessions. The ISM therefore remains a closely watched indicator despite its manufacturing focus. A Proven Performer The ISM's leading quality has been proven over time. Its bottom during a recession has preceded the turning point for the business cycle by an average of four months, and its worst performance in leading the turning point was on two occasions when the ISM trough occurred in the same month as the business cycle trough. The ISM index is released on the first business day of each at 10:00 ET, with data for the prior calendar month. *****24/07/09 07:58 Services PMI 45.2 44.7 Jul Country: EMU Source: Institute for Supply Management. Raw Data Available At: http://www.ism.ws/ISMReport/index.cfm Release Time: 10:00 ET on the first business day of the month for the prior month. ISM: Institute for Supply Management formerly NAPM: National Association of Purchasing Managers In Brief The ISM report is a national survey of purchasing managers which covers such indicators as new orders, production, employment, inventories, delivery times, prices, export orders, and import orders. Diffusion indexes are produced for each of these categories, with a reading over 50% indicating expansion relative to the prior month, and a sub-50% reading indicating contraction. The total index is calculated based on a weighted average of the following five sub-indexes, with weights in parentheses: new orders (30%), production (25%), employment (20%), deliveries (15%), and inventories (10%). The ISM is one of the first comprehensive economic releases of the month, typically preceding the employment report. Though it covers only the manufacturing sector, it can often provide accurate hints regarding the tone of subsequent releases. During periods of inflation concerns, the prices paid and vendor deliveries indexes often determine the bond market's reaction to the report. In Depth The Institute for Supply Management's monthly Report on Business is probably the most widely watched economic indicator produced by the private sector. There are two key reasons for the ISM's prominence. First, its longevity - the report was first produced in 1931, and after a break during World War II, it has produced continuously since 1948. Second , its leading quality - the ISM has been one of the better predictors of the business cycle over the years. More than 370 purchasing and supply management professionals in the non- manufacturing sector participate in the survey by completing a monthly questionnaire covering Business Activity, New Orders, Backlog of Orders, New Export Orders, Inventory Change, Inventory Sentiment, Imports, Prices, Employment, and Supplier Deliveries. The respondents are from more than 60 different sectors representing nine divisions from the Standard Industrial Code classification system including Agriculture, Forestry, & Fisheries; Mining; Construction; Transportation, Communications, Electric, Gas, and Sanitary Services; Wholesale Trade; Retail Trade; Finance, Insurance & Real Estate; Services; and Public Administration. Geographic location is also a consideration The results of the responses are compiled in the Non-Manufacturing NAPM Report on Business®by Ralph G. Kauffman, Ph.D., C.P.M, chair of the Non- Manufacturing Business Survey Committee. Following the initial release, this new report will be issued on the third business day of each month at 10:00 a.m. eastern Time via Business Wire and Xpedite Broadcast Fax. The National Association of Purchasing Management is a not-for-profit association that provides national and international leadership in purchasing and supply management research and education. NAPM provides its more than 44,000 members in its 180 affiliated associations with opportunities to expand their professional skills and knowledge. *****24/07/09 08:00 IFO Business Climate: index 86.5 85.9 Jul Country: Germany Source: Ifo Institute for Economic Research. Raw Data Available At: http://www.ifo.de/~cesifo/ifoinstitute.htm Release Time: 10:00 Germany-time around the 26th of the month (data for month prior). The Ifo Institute for Economic Research, is one of the largest economic research institutes in Germany. The Ifo Institute is a service-based research organisation with a three-fold orientation: to conduct economic research, to offer advice to economic policy-makers and to provide services for the research and business communities. The Ifo Institute is internationally renowned for its business surveys. Every month more than 7,000 enterprises are questioned on their appraisals of the business situation and their short-term planning. The confidence indicator frequently referred to as the Ifo Index is derived from the responses to the Ifo Business Survey. *****24/07/09 08:30 Gross Domestic Product (GDP) qq -0.3% -2.4% Q2 Country: UK Source: Bureau of Economic Analysis, U.S. Department of Commerce. Raw Data Available At: http://www.bea.doc.gov/bea/dn1.htm Release Time: Third or fourth week of the month at 8:30 ET for the prior quarter, with subsequent revisions released in the second and third months of the quarter. Gross Domestic Product (GDP) is the broadest measure of economic activity. Annualized quarterly percent changes in GDP reflect the growth rate of total economic output. The figures can be quite volatile from quarter to quarter. Inventory and net export swings in particular can produce significant volatility in GDP. The final sales figure, which excludes inventories, can sometimes be helpful in identifying underlying growth trends as inventories represent unsold goods, and a large inventory increase will boost GDP but might be indicative of weakness rather than strength. The broad components of GDP are: consumption, investment, net exports, government purchases, and inventories. Consumption is by far the largest component, totalling roughly 2/3rds of GDP. In addition to the GDP figures, there are GDP deflators, which measure the change in prices in total GDP and for each component. Though the consumer price index is a more closely watched inflation indicator, the GDP deflator is another key inflation measure. Unlike CPI, it has the advantage of not being a fixed basket of goods and services, so that changes in consumption patterns or the introduction of new goods and services will be reflected in the deflator. With both GDP and the deflator, the market tends to focus on the quarter/quarter change. Year/year changes are also cited frequently, though they do not provide the most timely indications of economic activity or inflation. The bond market often reacts to GDP, though the price moves are typically small, as much of the GDP data is easily predicted using monthly economic releases such as personal consumption, durable goods shipments, construction spending, international trade, and inventories. Quarterly GDP reports are broken down into three announcements: advance, preliminary, and final. After the final revision, GDP is not revised again until the annual benchmark revisions each July. These revisions can be quite large and usually affect the past five years of data. *****24/07/09 08:30 Gross Domestic Product (GDP) yy -5.2% -4.9% Q2 Country: UK Source: Bureau of Economic Analysis, U.S. Department of Commerce. Raw Data Available At: http://www.bea.doc.gov/bea/dn1.htm Release Time: Third or fourth week of the month at 8:30 ET for the prior quarter, with subsequent revisions released in the second and third months of the quarter. Gross Domestic Product (GDP) is the broadest measure of economic activity. Annualized quarterly percent changes in GDP reflect the growth rate of total economic output. The figures can be quite volatile from quarter to quarter. Inventory and net export swings in particular can produce significant volatility in GDP. The final sales figure, which excludes inventories, can sometimes be helpful in identifying underlying growth trends as inventories represent unsold goods, and a large inventory increase will boost GDP but might be indicative of weakness rather than strength. The broad components of GDP are: consumption, investment, net exports, government purchases, and inventories. Consumption is by far the largest component, totalling roughly 2/3rds of GDP. In addition to the GDP figures, there are GDP deflators, which measure the change in prices in total GDP and for each component. Though the consumer price index is a more closely watched inflation indicator, the GDP deflator is another key inflation measure. Unlike CPI, it has the advantage of not being a fixed basket of goods and services, so that changes in consumption patterns or the introduction of new goods and services will be reflected in the deflator. With both GDP and the deflator, the market tends to focus on the quarter/quarter change. Year/year changes are also cited frequently, though they do not provide the most timely indications of economic activity or inflation. The bond market often reacts to GDP, though the price moves are typically small, as much of the GDP data is easily predicted using monthly economic releases such as personal consumption, durable goods shipments, construction spending, international trade, and inventories. Quarterly GDP reports are broken down into three announcements: advance, preliminary, and final. After the final revision, GDP is not revised again until the annual benchmark revisions each July. These revisions can be quite large and usually affect the past five years of data. *****24/07/09 13:55 U.Michigan Consumer Sentiment 71.0 70.8 Jul Country: US Source: The University of Michigan. Release Time: Preliminary: 10:00 ET on the second Friday of the month (data for current month); Final: 10:00 ET on the fourth Friday of the month (data for current month). This survey measures the attitudes and expectations concerning both present and future economic conditions of 500 consumers. The Michigan index is almost identical to the Conference Board Consumer Confidence index, though there are two monthly releases, a preliminary and final reading. Like the Conference Board index, it has two subindexes - expectations and current conditions. The expectations index is a component of the Conference Board's Leading Indicators index. Consumer spending accounts for two-thirds of the economy, so the markets follow any indicator relating to consumer behavior and attitudes. The more confident consumers are about the economy and their own personal finances, the more likely they are to spend. It is interesting to note that changes in consumer sentiment and retail sales don't move in tandem. Results for the week of:12/07/09 - 17/07/09 12 July 2009 - 17 July 2009 Timezone GMT (Greenwich Mean Time) Date Time Importance Event Actual Forecast Previous Period 12/07/09 22:45 Retail Sales mm 0.8% 0.5% May Country: NewZealand Source: The Census Bureau of the Department of Commerce. Raw Data Available At: http://www.census.gov/svsd/www/advtable.html Release Time: 8:30 ET around the 13th of the month (data for one month prior). The retail sales report is a measure of the total receipts of retail stores. The changes in retail sales are widely followed as the most timely indicator of broad consumer spending patterns. Retail sales are often viewed ex-autos, as auto sales can move sharply from month-to-month. It is also important to keep an eye on the gas and food components, where changes in sales are often a result of price changes rather than shifting consumer demand. Retail sales can be quite volatile and the advance reports are subject to rather large revisions. Retail sales do not include spending on services, which makes up over half of total consumption. Total personal consumption is not available until the personal income and consumption reports are released, typically two weeks after retail sales. 12/07/09 22:45 Core Retail Sales mm 1.6% -0.1% May Country: NewZealand Source: The Census Bureau of the Department of Commerce. Raw Data Available At: http://www.census.gov/svsd/www/advtable.html Release Time: 8:30 ET around the 13th of the month (data for one month prior). The retail sales report is a measure of the total receipts of retail stores. The changes in retail sales are widely followed as the most timely indicator of broad consumer spending patterns. Retail sales are often viewed ex-autos, as auto sales can move sharply from month-to-month. It is also important to keep an eye on the gas and food components, where changes in sales are often a result of price changes rather than shifting consumer demand. 12/07/09 22:45 Retail Sales yy -2.4% -1.7% May Country: NewZealand Source: The Census Bureau of the Department of Commerce. Raw Data Available At: http://www.census.gov/svsd/www/advtable.html Release Time: 8:30 ET around the 13th of the month (data for one month prior). The retail sales report is a measure of the total receipts of retail stores. The changes in retail sales are widely followed as the most timely indicator of broad consumer spending patterns. Retail sales are often viewed ex-autos, as auto sales can move sharply from month-to-month. It is also important to keep an eye on the gas and food components, where changes in sales are often a result of price changes rather than shifting consumer demand. Retail sales can be quite volatile and the advance reports are subject to rather large revisions. Retail sales do not include spending on services, which makes up over half of total consumption. Total personal consumption is not available until the personal income and consumption reports are released, typically two weeks after retail sales. 13/07/09 05:00 Consumer Confidence 37.6 35.7 Jun Country: Japan Source: The Conference Board. Raw Data Available At: http://www.tcb-indicators.org/ Release Time: 10:00 ET on the last Tuesday of the month (data for current month). This survey measures the level of confidence individual households have in the performance of the economy now and in the future. It is a leading indicator of future spending and the business cycle. 5000 consumers in the nine census divisions across the country are surveyed each month. The level of consumer confidence is directly correlated to the strength of consumer spending, which accounts for two-thirds of the economy. It also correlates closely with joblessness, inflation, and real incomes. The report can occasionally be helpful in predicting sudden shifts in consumption patterns, though most small changes in the index are just noise. Only index changes of at least five points should be considered significant. The index consists of two subindexes - consumers' appraisal of current conditions and their expectations for the future. Expectations make up 60% of the total index, with current conditions accounting for the other 40%. The expectations index is typically seen as having better leading indicator qualities than the current conditions index. The more confident consumers are about the economy and their own personal finances, the more likely they are to spend. Note, changes in consumer confidence and retail sales do not move in tandem month by month. If the economy experiences a long-term expansion, buying intentions may decline even while the jobless rate declines because of the satisfaction of pent-up demand. Conversely, if inflation begins to accelerate, spending plans may increase for the short-term as consumers buy now to avoid having to pay higher prices later. Regional differences in consumer confidence are an indication of differing business cycles across the nation. This has implications for spending on durable goods and, more importantly, for residential real estate markets. Financial markets interpret rising consumer confidence as a precursor to higher consumer spending. Higher consumer spending could in turn spark inflation. Look for a change in the direction of the six month moving average of the index. Consumers do not usually have the necessary information to accurately assess income and job growth six months in the future. The report provides information on planned spending, which does not necessarily turn into actual spending, although it is unlikely that increasing consumer confidence would be followed by a decline in spending. The Consumer Confidence survey is not useful for any type of forecasting. 13/07/09 07:15 Producer Price Index (PPI) mm 0.0% 0.2% -0.3% Jun Country: Switzerland Source: Bureau of Labor statistics, U.S. Department of Labor. Raw Data Available At: http://stats.bls.gov/news.release/ppi.toc.htm Release Time: Around the 11th of each month at 8:30 ET for the prior month. The Producer Price Index measures prices of goods at the wholesale level. There are three broad subcategories within PPI: crude, intermediate, and finished. The market tracks the finished goods index most closely, as it represents prices for goods that are ready for sale to the end user. Goods prices at the crude and intermediate stages of production often provide an indication of coming (dis)inflationary pressures, but the closer you get to crude goods, the more that these prices track commodity prices which are already available in traded indexes such as the CRB (Commodity Research Bureau). At all stages of production, the market places more emphasis on the index excluding food and energy, referred to as the core rate. Food and energy prices tend to be quite volatile and obscure trends in the underlying inflation rate. Though the market reaction is determined by the month/month changes, year/year changes are also noted by analysts. The index is not revised on a monthly basis, but annual revisions to seasonal adjustment factors can produce small adjustments to past releases. 13/07/09 07:15 Producer Price Index (PPI) yy -5.6% -5.4% -5.0% Jun Country: Switzerland Source: Bureau of Labor statistics, U.S. Department of Labor. Raw Data Available At: http://stats.bls.gov/news.release/ppi.toc.htm Release Time: Around the 11th of each month at 8:30 ET for the prior month. The Producer Price Index measures prices of goods at the wholesale level. There are three broad subcategories within PPI: crude, intermediate, and finished. The market tracks the finished goods index most closely, as it represents prices for goods that are ready for sale to the end user. Goods prices at the crude and intermediate stages of production often provide an indication of coming (dis)inflationary pressures, but the closer you get to crude goods, the more that these prices track commodity prices which are already available in traded indexes such as the CRB (Commodity Research Bureau). At all stages of production, the market places more emphasis on the index excluding food and energy, referred to as the core rate. Food and energy prices tend to be quite volatile and obscure trends in the underlying inflation rate. Though the market reaction is determined by the month/month changes, year/year changes are also noted by analysts. The index is not revised on a monthly basis, but annual revisions to seasonal adjustment factors can produce small adjustments to past releases. 13/07/09 18:00 Budget -51.5b 33.55b Jun Country: US Source: U.S. Treasury Department. Raw Data Available At: http://www.fms.treas.gov/mts/index.html Release Time: 14:00 ET, about the third week of the month for the prior month. In Brief The monthly Treasury budget data follow strong seasonal patterns which produce huge month-to-month fluctuations in the deficit. These fluctuations tell us little about long term budget trends. To the extent that the market analyses the monthly Treasury data, the focus is on year/year changes in receipts and outlays, since the data are not seasonally adjusted. Only in April, the most important month for tax inflows to the Treasury, does the market pay any attention to this report. The data can be predicted with reasonable accuracy by using daily data in the Daily Treasury Statement. In Depth The President's Budget The annual budget process begins in late January or early February with the presentation of the President's budget for the coming fiscal year. The President's proposals serve as an outline for Congress, particularly when the White House and Congress are controlled by the same party. In the 1980s, the conflicting agendas of the President and Congress often resulted in a final budget which bore little resemblance to the President's budget. After a quiet budget year in 1994 when Democrats controlled Congress and the White House, the Republican takeover of the House and Senate has produced more contentious budget battles in 1995 and 1996. One of the most common misperceptions about the budget process is that the annual budgeting actually covers all federal spending. Though the President's proposed budget will include projections for all federal government outlays, less than half of all spending is actually controlled by the annual budget legislation. Roughly 67% of federal outlays are mandated by "permanent" law. Unless these laws are changed, no legislative review of spending programs funded by permanent law is required in the appropriations process. The same is true of federal receipts, where permanent law does not require annual review of taxation. Permanent law should not by any means be construed as suggesting true permanence. Permanent laws are changed frequently, with the 1990 and 1993 budget deals being the most recent examples. These recent efforts to reduce the deficit have incorporated both changes in discretionary spending and changes in permanent laws affecting taxes and spending. Such deficit reduction efforts are usually packaged into a so-called Omnibus Budget Reconciliation Act (OBRA). In the absence of these comprehensive deficit reduction efforts, the annual budget review will only deal with discretionary spending which makes up roughly 33% of the budget. It is perhaps one of the better kept secrets in Washington that the annual budget review which seems at the core of the democratic process does not in fact review even half of all federal spending. The Budget Resolution Once the President has submitted his budget to Congress, the legislative process begins. Within six weeks of the date that the President presents his budget, each Congressional committee must report to the House and Senate Budget Committees regarding budget estimates for programs overseen by their committee. The Budget Committees then approve a budget resolution based on these estimates. After full House and Senate approval of these resolutions, any differences between the House and Senate versions are worked out in conference committee and then a final resolution is approved by each house. This process is scheduled to be completed by April 15, but is often delayed, as was the case this year. As the budget resolution is only a blueprint for the budget and not actual legislation, it does not require presidential approval. Appropriations Bills The real job of budgeting begins after the budget resolution is adopted. The appropriations process is when actual budget authority for discretionary programs is legislated. We have already noted that annual budgeting only covers discretionary programs, which are responsible for just 33% of total spending. Even these discretionary programs are not bundled into one budget package. The annual budget for discretionary spending is actually comprised of 13 separate appropriations bills. The House and Senate Appropriations Committees each include 13 subcommittees which are responsible for the 13 bills. The 13 subcommittees are listed below. Subcommittees of the House and Senate Committees Agriculture Commerce Justice Defense Dis. of Columbia Energy Water Foreign Ops. Interior Labor Health Legislative Military Const. Transportation Treasury Postal Service Veterans HUD Agencies As all tax and spending bills must originate in the House, the House Appropriations subcommittees will see the first action in the appropriations process. The 13 bills are crafted individually and do not work their way through the House and Senate on the same timetable. The goal is of course to complete legislation on all 13 bills by the beginning of the fiscal year on October 1. Yet these bills proceed and are approved of on their own, and are not packaged into one comprehensive bill known simply as the budget. Once a House Appropriations subcommittee approves its bill, the legislation proceeds to the full Committee and then to the House floor. Approval by the House sets in motion the same process in the Senate. Upon approval by the full Senate, differences between the House and Senate versions of the bill are reconciled in conference committee and then a final version of the bill is sent back to the House and Senate floors. Presidential approval of each of the 13 appropriations bills completes the process. When work on the 13 bills is delayed past the start of the fiscal year, Congress and the President must approve of continuing resolutions which fund government programs at the prior year's level until the relevant appropriations bill is signed into law. One final note about the appropriations process is that the appropriations bills do not set actual outlays for the coming fiscal year, but instead legislate "budget authority." The Office of Management and Budget (OMB) defines budget authority as "the authority to incur legally binding obligations of the Government that will result in immediate or future outlays." Actual outlays may exceed or fall short of budget authority in any given year depending on past budget authority and the duration of a program. Omnibus Budget Reconciliation Act In years such as 1985, 1987, 1990, and 1993, Congress has enacted legislation aimed at long term deficit reduction. These legislative efforts occur separately from the annual appropriations process. They may change permanent laws and set caps which affect discretionary spending, but the regular budget process will nevertheless be unchanged. OBRA legislation affects permanent law and is not a substitute for annual budgets. OBRA legislation packages changes in permanent laws which will typically affect both taxation and mandatory spending. The legislative process for OBRA is completely different than the appropriations process. Legislation is still initiated in the House, but is not limited to work by the Appropriations Committee. The House Ways and Means Committee oversees tax law, and thus plays a critical role in OBRA legislation, as does its Senate counterpart, the Finance Committee. Legislation affecting entitlement programs also falls under the jurisdiction of committees other than Appropriations, i.e. proposed Medicare changes would be considered by a House Ways and Means subcommittee on health care. Supplemental Appropriations The 13 appropriations bills are not necessarily the last word for the year on federal spending. Supplemental appropriations bills may be approved at any time to provide additional funding for government programs. Tight caps on discretionary spending set by the 1990 and 1993 budget acts require a pay-as-you-go approach to such funding, thus limiting the number of supplemental appropriations. "Emergency" spending circumvents the pay-as-you-go mandate, however, allowing for a variety of supplemental appropriations. Past "emergencies" have covered everything from the Gulf War to extended unemployment insurance to natural disaster relief. 14/07/09 08:30 Consumer Price Index (CPI) mm 0.3% 0.6% Jun Country: UK Source: Bureau of Labor statistics, U.S. Department of Labor. Raw Data Available At: http://stats.bls.gov/news.release/cpi.toc.htm Release Time: 8:30 ET, about the 13th of each month for the prior month. The Consumer Price Index is a measure of the price level of a fixed market basket of goods and services purchased by consumers. CPI is the most widely cited inflation indicator, and it is used to calculate cost of living adjustments for government programs and it is the basis of COLAs for many private labor agreements as well. It has been criticized for overstating inflation, because it does not adjust for substitution effects and because the fixed basket does not reflect price changes in new technology goods which are often declining in price. Despite these criticisms, it remains the benchmark inflation index. 14/07/09 08:30 Consumer Price Index (CPI) yy 1.8% 2.2% Jun Country: UK Source: Bureau of Labor statistics, U.S. Department of Labor. Raw Data Available At: http://stats.bls.gov/news.release/cpi.toc.htm Release Time: 8:30 ET, about the 13th of each month for the prior month. The Consumer Price Index is a measure of the price level of a fixed market basket of goods and services purchased by consumers. CPI is the most widely cited inflation indicator, and it is used to calculate cost of living adjustments for government programs and it is the basis of COLAs for many private labor agreements as well. It has been criticized for overstating inflation, because it does not adjust for substitution effects and because the fixed basket does not reflect price changes in new technology goods which are often declining in price. Despite these criticisms, it remains the benchmark inflation index. 14/07/09 08:30 Retail Price Index (RPI) mm 0.4% 0.6% Jun Country: UK The RPI Contains figures for the RPIX (RPI which excludes mortgage interest payments), until 10 December 2003 published as the UK main measure of inflation. Since then, the HICP in considered as the main measure of inflation for macroeconomic purposes. The harmonised indices of consumer prices (HICPs) are calculated in each member state of the European Union for the purposes of European comparisons, as required by the Maastricht Treaty. The RPI is often described in terms of a shopping basket containing some 650 goods and services, chosen as indicators of price movements for a range of similar items. Taking bread as an example, several different types of bread are priced (e.g. large white loaves (sliced and unsliced), small brown loaf, large wholemeal loaf, bread rolls, pitta bread and french stick/baguette). These are considered as representative of the majority of bread consumption by most households. Each price collector collects the price of a representative item (e.g. brand) for that price indicator in January and exactly the same item/ brand must be priced every month for a period of thirteen months. Each month price indices are constructed comparing the latest price with the price in the base month (January). Finally price indices for price indicators are aggregated to items and then to sections which is the published level and rescaled to a reference point of January 1987=100. This allows price changes to be compared to a year earlier (i.e. the annual inflation rate) and to previous years. How is it published? Every month data is published on either the second or third Tuesday in a month (depending on the month) in a Consumer Price Indices First Release along with Additional Briefing Notes, which give the stories behind the figures. Data is also published in the electronic publication Focus on Consumer Prices available on the National Statistics website. How often are the components reviewed? The Office for National Statistics reviews the components of the Retail Price Index once every year, to keep it as up to date as possible, reflecting changes in consumers' preferences and the establishment of new products. Each year the changes are announced in a News Release and published in an article. What are the origins of the Retail Prices? Although there were occasional official comparisons of prices for food in the nineteenth and early twentieth century, the Government first began a systematic, continuous check on the increase of the cost of living in 1914, but the coverage was very limited. After the Second World War a cost of living Advisory Committee was set up and an experimental price index known as the Interim Index of Retail Prices ran from 1947 to 1956. In January 1956, the first official Retail Prices Index began with various methodological changes implemented since then following reviews by RPI Advisory Committees. The latest Advisory Committees met in the early 1990s and made recommendations about the treatment of housing costs, holidays and car prices. RPIX, which excludes mortgage interest payments; RPIY, which excludes mortgage interest rates and indirect taxes (VAT, council tax, duties vehicle excise duty, insurance tax and air passenger duty); Quarterly Pensioner Indices, which use the same price data as RPI, weighted for the typical spending of one and two-pensioner households and excluding items such as school dinners, work place canteen meals and housing; and the Tax and Price Index, which measures how much the average person's gross income needs to change to purchase the RPI basket after allowing for the average amount of income tax and national insurance paid on earnings. 14/07/09 08:30 RPI ex. Mortgage (RPIX) yy -1.5% -1.1% Jun Country: UK The RPI Contains figures for the RPIY (RPI which excludes mortgage interest payments), until 10 December 2003 published as the UK main measure of inflation. Since then, the HICP in considered as the main measure of inflation for macroeconomic purposes. The harmonised indices of consumer prices (HICPs) are calculated in each member state of the European Union for the purposes of European comparisons, as required by the Maastricht Treaty. The RPI is often described in terms of a shopping basket containing some 650 goods and services, chosen as indicators of price movements for a range of similar items. Taking bread as an example, several different types of bread are priced (e.g. large white loaves (sliced and unsliced), small brown loaf, large wholemeal loaf, bread rolls, pitta bread and french stick/baguette). These are considered as representative of the majority of bread consumption by most households. Each price collector collects the price of a representative item (e.g. brand) for that price indicator in January and exactly the same item/ brand must be priced every month for a period of thirteen months. Each month price indices are constructed comparing the latest price with the price in the base month (January). Finally price indices for price indicators are aggregated to items and then to sections which is the published level and rescaled to a reference point of January 1987=100. This allows price changes to be compared to a year earlier (i.e. the annual inflation rate) and to previous years. How is it published? Every month data is published on either the second or third Tuesday in a month (depending on the month) in a Consumer Price Indices First Release along with Additional Briefing Notes, which give the stories behind the figures. Data is also published in the electronic publication Focus on Consumer Prices available on the National Statistics website. How often are the components reviewed? The Office for National Statistics reviews the components of the Retail Price Index once every year, to keep it as up to date as possible, reflecting changes in consumers' preferences and the establishment of new products. Each year the changes are announced in a News Release and published in an article. What are the origins of the Retail Prices? Although there were occasional official comparisons of prices for food in the nineteenth and early twentieth century, the Government first began a systematic, continuous check on the increase of the cost of living in 1914, but the coverage was very limited. After the Second World War a cost of living Advisory Committee was set up and an experimental price index known as the Interim Index of Retail Prices ran from 1947 to 1956. In January 1956, the first official Retail Prices Index began with various methodological changes implemented since then following reviews by RPI Advisory Committees. The latest Advisory Committees met in the early 1990s and made recommendations about the treatment of housing costs, holidays and car prices. RPIX, which excludes mortgage interest payments; RPIY, which excludes mortgage interest rates and indirect taxes (VAT, council tax, duties vehicle excise duty, insurance tax and air passenger duty); Quarterly Pensioner Indices, which use the same price data as RPI, weighted for the typical spending of one and two-pensioner households and excluding items such as school dinners, work place canteen meals and housing; and the Tax and Price Index, which measures how much the average person's gross income needs to change to purchase the RPI basket after allowing for the average amount of income tax and national insurance paid on earnings. 14/07/09 08:30 RPI ex. Mortgage (RPIX) mm 0.6% Jun Country: UK The RPI Contains figures for the RPIX (RPI which excludes mortgage interest payments), until 10 December 2003 published as the UK main measure of inflation. Since then, the HICP in considered as the main measure of inflation for macroeconomic purposes. The harmonised indices of consumer prices (HICPs) are calculated in each member state of the European Union for the purposes of European comparisons, as required by the Maastricht Treaty. The RPI is often described in terms of a shopping basket containing some 650 goods and services, chosen as indicators of price movements for a range of similar items. Taking bread as an example, several different types of bread are priced (e.g. large white loaves (sliced and unsliced), small brown loaf, large wholemeal loaf, bread rolls, pitta bread and french stick/baguette). These are considered as representative of the majority of bread consumption by most households. Each price collector collects the price of a representative item (e.g. brand) for that price indicator in January and exactly the same item/ brand must be priced every month for a period of thirteen months. Each month price indices are constructed comparing the latest price with the price in the base month (January). Finally price indices for price indicators are aggregated to items and then to sections which is the published level and rescaled to a reference point of January 1987=100. This allows price changes to be compared to a year earlier (i.e. the annual inflation rate) and to previous years. How is it published? Every month data is published on either the second or third Tuesday in a month (depending on the month) in a Consumer Price Indices First Release along with Additional Briefing Notes, which give the stories behind the figures. Data is also published in the electronic publication Focus on Consumer Prices available on the National Statistics website. How often are the components reviewed? The Office for National Statistics reviews the components of the Retail Price Index once every year, to keep it as up to date as possible, reflecting changes in consumers' preferences and the establishment of new products. Each year the changes are announced in a News Release and published in an article. What are the origins of the Retail Prices? Although there were occasional official comparisons of prices for food in the nineteenth and early twentieth century, the Government first began a systematic, continuous check on the increase of the cost of living in 1914, but the coverage was very limited. After the Second World War a cost of living Advisory Committee was set up and an experimental price index known as the Interim Index of Retail Prices ran from 1947 to 1956. In January 1956, the first official Retail Prices Index began with various methodological changes implemented since then following reviews by RPI Advisory Committees. The latest Advisory Committees met in the early 1990s and made recommendations about the treatment of housing costs, holidays and car prices. RPIX, which excludes mortgage interest payments; RPIY, which excludes mortgage interest rates and indirect taxes (VAT, council tax, duties vehicle excise duty, insurance tax and air passenger duty); Quarterly Pensioner Indices, which use the same price data as RPI, weighted for the typical spending of one and two-pensioner households and excluding items such as school dinners, work place canteen meals and housing; and the Tax and Price Index, which measures how much the average person's gross income needs to change to purchase the RPI basket after allowing for the average amount of income tax and national insurance paid on earnings. 14/07/09 08:30 Retail Price Index (RPI) yy 1.1% 1.6% Jun Country: UK The RPI Contains figures for the RPIX (RPI which excludes mortgage interest payments), until 10 December 2003 published as the UK main measure of inflation. Since then, the HICP in considered as the main measure of inflation for macroeconomic purposes. The harmonised indices of consumer prices (HICPs) are calculated in each member state of the European Union for the purposes of European comparisons, as required by the Maastricht Treaty. The RPI is often described in terms of a shopping basket containing some 650 goods and services, chosen as indicators of price movements for a range of similar items. Taking bread as an example, several different types of bread are priced (e.g. large white loaves (sliced and unsliced), small brown loaf, large wholemeal loaf, bread rolls, pitta bread and french stick/baguette). These are considered as representative of the majority of bread consumption by most households. Each price collector collects the price of a representative item (e.g. brand) for that price indicator in January and exactly the same item/ brand must be priced every month for a period of thirteen months. Each month price indices are constructed comparing the latest price with the price in the base month (January). Finally price indices for price indicators are aggregated to items and then to sections which is the published level and rescaled to a reference point of January 1987=100. This allows price changes to be compared to a year earlier (i.e. the annual inflation rate) and to previous years. How is it published? Every month data is published on either the second or third Tuesday in a month (depending on the month) in a Consumer Price Indices First Release along with Additional Briefing Notes, which give the stories behind the figures. Data is also published in the electronic publication Focus on Consumer Prices available on the National Statistics website. How often are the components reviewed? The Office for National Statistics reviews the components of the Retail Price Index once every year, to keep it as up to date as possible, reflecting changes in consumers' preferences and the establishment of new products. Each year the changes are announced in a News Release and published in an article. What are the origins of the Retail Prices? Although there were occasional official comparisons of prices for food in the nineteenth and early twentieth century, the Government first began a systematic, continuous check on the increase of the cost of living in 1914, but the coverage was very limited. After the Second World War a cost of living Advisory Committee was set up and an experimental price index known as the Interim Index of Retail Prices ran from 1947 to 1956. In January 1956, the first official Retail Prices Index began with various methodological changes implemented since then following reviews by RPI Advisory Committees. The latest Advisory Committees met in the early 1990s and made recommendations about the treatment of housing costs, holidays and car prices. RPIX, which excludes mortgage interest payments; RPIY, which excludes mortgage interest rates and indirect taxes (VAT, council tax, duties vehicle excise duty, insurance tax and air passenger duty); Quarterly Pensioner Indices, which use the same price data as RPI, weighted for the typical spending of one and two-pensioner households and excluding items such as school dinners, work place canteen meals and housing; and the Tax and Price Index, which measures how much the average person's gross income needs to change to purchase the RPI basket after allowing for the average amount of income tax and national insurance paid on earnings. 14/07/09 09:00 ZEW Economic Sentiment 47.8 44.8 Jul Country: Germany Source: ZEW - The Centre for European Economic Research. Raw Data Available At: http://www.zew.de/ The ZEW (Zentrum für Europäische Wirtschaftsforschung - Centre for European Economic Research) is a non-profit economic research institute with the legal form of a limited liability company (GmbH). It was founded in 1990 on the initiative of the government of the federal state Baden-Württemberg, trade and industry, and the Mannheim University. In April 1991 the institute took up work and has expanded rapidly since then. The ZEW Index measures investors' expectations of economic growth. The ZEW index has a good reputation of anticipating the results of the broader IFO index that is widely regarded as an important leading indicator of the economy. The IFO index is available later in each month. 14/07/09 09:00 Industrial Production mm 1.0% -1.9% May Country: EMU Source: Federal Reserve. Raw Data Available At: http://www.federalreserve.gov/releases/G17/Current/g17.txt Release Time: 9:15 ET around the 15th of the month (data for month prior). The index of Industrial Production is a fixed-weight measure of the physical output of the nation's factories, mines, and utilities. Manufacturing production, the largest component of the total, can be accurately predicted using total manufacturing hours worked from the employment report. One of the bigger wildcards in this report is utility production, which can be quite volatile due to swings in the weather. Severe hot or cold spells can boost production as increased heating/cooling needs drive utility production up. In addition to production, this monthly report also provides a measure of capacity utilization. Though the rate of capacity utilization is seen as a critical gauge of the slack available in the economy, the market does not completely trust this measure. Capacity is very difficult to measure, and the Fed essentially assumes that growth in capacity in any given year follows a straight line. One can therefore predict the capacity utilization rate quite accurately based on the assumption for production growth. The 85% mark is seen as a key barrier over which inflationary pressures are generated, but given revisions to these data and the difficulties with capacity measurement, the 85% mark should be viewed cautiously. It would be appropriate to look for corroborating inflation indications from commodity prices and vendor deliveries. 14/07/09 09:00 Industrial Production yy -17.7% -21.6% May Country: EMU Source: Federal Reserve. Raw Data Available At: http://www.federalreserve.gov/releases/G17/Current/g17.txt Release Time: 9:15 ET around the 15th of the month (data for month prior). The index of Industrial Production is a fixed-weight measure of the physical output of the nation's factories, mines, and utilities. Manufacturing production, the largest component of the total, can be accurately predicted using total manufacturing hours worked from the employment report. One of the bigger wildcards in this report is utility production, which can be quite volatile due to swings in the weather. Severe hot or cold spells can boost production as increased heating/cooling needs drive utility production up. In addition to production, this monthly report also provides a measure of capacity utilization. Though the rate of capacity utilization is seen as a critical gauge of the slack available in the economy, the market does not completely trust this measure. Capacity is very difficult to measure, and the Fed essentially assumes that growth in capacity in any given year follows a straight line. One can therefore predict the capacity utilization rate quite accurately based on the assumption for production growth. The 85% mark is seen as a key barrier over which inflationary pressures are generated, but given revisions to these data and the difficulties with capacity measurement, the 85% mark should be viewed cautiously. It would be appropriate to look for corroborating inflation indications from commodity prices and vendor deliveries. 14/07/09 12:30 Producer Price Index (PPI) yy -5.0% Jun Country: US Source: Bureau of Labor statistics, U.S. Department of Labor. Raw Data Available At: http://stats.bls.gov/news.release/ppi.toc.htm Release Time: Around the 11th of each month at 8:30 ET for the prior month. The Producer Price Index measures prices of goods at the wholesale level. There are three broad subcategories within PPI: crude, intermediate, and finished. The market tracks the finished goods index most closely, as it represents prices for goods that are ready for sale to the end user. Goods prices at the crude and intermediate stages of production often provide an indication of coming (dis)inflationary pressures, but the closer you get to crude goods, the more that these prices track commodity prices which are already available in traded indexes such as the CRB (Commodity Research Bureau). At all stages of production, the market places more emphasis on the index excluding food and energy, referred to as the core rate. Food and energy prices tend to be quite volatile and obscure trends in the underlying inflation rate. Though the market reaction is determined by the month/month changes, year/year changes are also noted by analysts. The index is not revised on a monthly basis, but annual revisions to seasonal adjustment factors can produce small adjustments to past releases. 14/07/09 12:30 Producer Price Index (PPI) mm 1.0% 0.2% Jun Country: US Source: Bureau of Labor statistics, U.S. Department of Labor. Raw Data Available At: http://stats.bls.gov/news.release/ppi.toc.htm Release Time: Around the 11th of each month at 8:30 ET for the prior month. The Producer Price Index measures prices of goods at the wholesale level. There are three broad subcategories within PPI: crude, intermediate, and finished. The market tracks the finished goods index most closely, as it represents prices for goods that are ready for sale to the end user. Goods prices at the crude and intermediate stages of production often provide an indication of coming (dis)inflationary pressures, but the closer you get to crude goods, the more that these prices track commodity prices which are already available in traded indexes such as the CRB (Commodity Research Bureau). At all stages of production, the market places more emphasis on the index excluding food and energy, referred to as the core rate. Food and energy prices tend to be quite volatile and obscure trends in the underlying inflation rate. Though the market reaction is determined by the month/month changes, year/year changes are also noted by analysts. The index is not revised on a monthly basis, but annual revisions to seasonal adjustment factors can produce small adjustments to past releases. 14/07/09 12:30 Core PPI mm 0.1% -0.1% Jun Country: US Source: Bureau of Labor statistics, U.S. Department of Labor. Raw Data Available At: http://stats.bls.gov/news.release/ppi.toc.htm Release Time: Around the 11th of each month at 8:30 ET for the prior month. The Producer Price Index measures prices of goods at the wholesale level. There are three broad subcategories within PPI: crude, intermediate, and finished. The market tracks the finished goods index most closely, as it represents prices for goods that are ready for sale to the end user. Goods prices at the crude and intermediate stages of production often provide an indication of coming (dis)inflationary pressures, but the closer you get to crude goods, the more that these prices track commodity prices which are already available in traded indexes such as the CRB (Commodity Research Bureau). At all stages of production, the market places more emphasis on the index excluding food and energy, referred to as the core rate. Food and energy prices tend to be quite volatile and obscure trends in the underlying inflation rate. Though the market reaction is determined by the month/month changes, year/year changes are also noted by analysts. The index is not revised on a monthly basis, but annual revisions to seasonal adjustment factors can produce small adjustments to past releases. 14/07/09 12:30 Core PPI yy 2.9% 3.0% Jun Country: US Source: Bureau of Labor statistics, U.S. Department of Labor. Raw Data Available At: http://stats.bls.gov/news.release/ppi.toc.htm Release Time: Around the 11th of each month at 8:30 ET for the prior month. The Producer Price Index measures prices of goods at the wholesale level. There are three broad subcategories within PPI: crude, intermediate, and finished. The market tracks the finished goods index most closely, as it represents prices for goods that are ready for sale to the end user. Goods prices at the crude and intermediate stages of production often provide an indication of coming (dis)inflationary pressures, but the closer you get to crude goods, the more that these prices track commodity prices which are already available in traded indexes such as the CRB (Commodity Research Bureau). At all stages of production, the market places more emphasis on the index excluding food and energy, referred to as the core rate. Food and energy prices tend to be quite volatile and obscure trends in the underlying inflation rate. Though the market reaction is determined by the month/month changes, year/year changes are also noted by analysts. The index is not revised on a monthly basis, but annual revisions to seasonal adjustment factors can produce small adjustments to past releases. 14/07/09 12:30 Core Retail Sales mm 0.5% 0.5% Jun Country: US Source: The Census Bureau of the Department of Commerce. Raw Data Available At: http://www.census.gov/svsd/www/advtable.html Release Time: 8:30 ET around the 13th of the month (data for one month prior). The retail sales report is a measure of the total receipts of retail stores. The changes in retail sales are widely followed as the most timely indicator of broad consumer spending patterns. Retail sales are often viewed ex-autos, as auto sales can move sharply from month-to-month. It is also important to keep an eye on the gas and food components, where changes in sales are often a result of price changes rather than shifting consumer demand. 14/07/09 12:30 Retail Sales mm 0.4% 0.5% Jun Country: US Source: The Census Bureau of the Department of Commerce. Raw Data Available At: http://www.census.gov/svsd/www/advtable.html Release Time: 8:30 ET around the 13th of the month (data for one month prior). The retail sales report is a measure of the total receipts of retail stores. The changes in retail sales are widely followed as the most timely indicator of broad consumer spending patterns. Retail sales are often viewed ex-autos, as auto sales can move sharply from month-to-month. It is also important to keep an eye on the gas and food components, where changes in sales are often a result of price changes rather than shifting consumer demand. Retail sales can be quite volatile and the advance reports are subject to rather large revisions. Retail sales do not include spending on services, which makes up over half of total consumption. Total personal consumption is not available until the personal income and consumption reports are released, typically two weeks after retail sales. 14/07/09 14:00 Business Inventories -1% -1.1% May Country: US Source: The Census Bureau of the Department of Commerce. Raw Data Available At: http://www.census.gov/mtis/www/current.html Release Time: 08:30 ET around the 15th of the month (data for two months prior). The business inventories report includes sales and inventory statistics from all three stages of the manufacturing process (manufacturing, wholesale, and retail). But by the time it is released all three of its sales components and two of its inventory components have already been reported. Because retail inventory is the only new piece of information it contains, the market usually ignores the business inventories report. However, sometimes retail inventories swing enough to change the aggregate inventory profile. This may affect the GDP outlook. When it does, the report can elicit a small market reaction. The aggregate sales figures are dated and they say little about personal consumption. They are actually a good coincident indicator, but the market is far more interested in forward-looking statistics. The inventory-to-sales (I/S) ratio measures the number of months it would take to deplete existing inventory at current sales rates. A relatively low (high) I/S ratio may mean that manufacturers will have to build up (draw down) inventory levels. Depending on the strength of final demand and the degree to which recent inventory changes have been intended or unintended, this can have an effect on the industrial production outlook. Note that this information is much more useful to market economists than it is to other market participants. 14/07/09 14:00 IBD Consumer Sentiment 50.8 Jul Country: US Source: The Conference Board. Raw Data Available At: http://www.tcb-indicators.org/ Release Time: 10:00 ET on the last Tuesday of the month (data for current month). This survey measures the level of confidence individual households have in the performance of the economy now and in the future. It is a leading indicator of future spending and the business cycle. 5000 consumers in the nine census divisions across the country are surveyed each month. The level of consumer confidence is directly correlated to the strength of consumer spending, which accounts for two-thirds of the economy. It also correlates closely with joblessness, inflation, and real incomes. The report can occasionally be helpful in predicting sudden shifts in consumption patterns, though most small changes in the index are just noise. Only index changes of at least five points should be considered significant. The index consists of two subindexes - consumers' appraisal of current conditions and their expectations for the future. Expectations make up 60% of the total index, with current conditions accounting for the other 40%. The expectations index is typically seen as having better leading indicator qualities than the current conditions index. The more confident consumers are about the economy and their own personal finances, the more likely they are to spend. Note, changes in consumer confidence and retail sales do not move in tandem month by month. If the economy experiences a long-term expansion, buying intentions may decline even while the jobless rate declines because of the satisfaction of pent-up demand. Conversely, if inflation begins to accelerate, spending plans may increase for the short-term as consumers buy now to avoid having to pay higher prices later. Regional differences in consumer confidence are an indication of differing business cycles across the nation. This has implications for spending on durable goods and, more importantly, for residential real estate markets. Financial markets interpret rising consumer confidence as a precursor to higher consumer spending. Higher consumer spending could in turn spark inflation. Look for a change in the direction of the six month moving average of the index. Consumers do not usually have the necessary information to accurately assess income and job growth six months in the future. The report provides information on planned spending, which does not necessarily turn into actual spending, although it is unlikely that increasing consumer confidence would be followed by a decline in spending. The Consumer Confidence survey is not useful for any type of forecasting. 15/07/09 Interest Rate Decision 0.1% Jul Country: Japan Source (U.S.): The Federal Reserve Open Market Committee - FOMC. Source (World): The Central Bank Monetary Policy Committee - MPC. The Federal Open Market Committee is a twelve-member committee made up of the seven members of the Board of Governors and five Federal Reserve Bank presidents. It meets eight times per year to determine the near-term direction of monetary policy, such as setting guidelines for the purchase and sale of government securities and setting policy relating to System operations in the foreign exchange markets. These changes in monetary policy are now announced immediately after FOMC meetings. Most importantly, the Fed determines interest rate policy at FOMC meetings. Market participants speculate about the possibility of an interest rate change at these meetings, and if the outcome is different from expectations, the impact on the markets can be dramatic and far-reaching. The interest rate set by the Fed the federal funds rate serves as a benchmark for all other rates. A change in the fed funds rate, the lending rate banks charge each other for the use of overnight funds, translates directly through to all other interest rates from Treasury bonds to mortgage loans. It also changes the dynamics of competition for investor dollars: when bonds yield 10 percent, they will attract more money away from stocks then when they only yield 5 percent. The level of interest rates affects the economy­ higher rates tend to slow activity; lower rates stimulate activity, a ripple effect that expands into all sectors of the economy. 15/07/09 07:15 Retail Sales mm 1.2% May Country: Switzerland Source: The Census Bureau of the Department of Commerce. Raw Data Available At: http://www.census.gov/svsd/www/advtable.html Release Time: 8:30 ET around the 13th of the month (data for one month prior). The retail sales report is a measure of the total receipts of retail stores. The changes in retail sales are widely followed as the most timely indicator of broad consumer spending patterns. Retail sales are often viewed ex-autos, as auto sales can move sharply from month-to-month. It is also important to keep an eye on the gas and food components, where changes in sales are often a result of price changes rather than shifting consumer demand. Retail sales can be quite volatile and the advance reports are subject to rather large revisions. Retail sales do not include spending on services, which makes up over half of total consumption. Total personal consumption is not available until the personal income and consumption reports are released, typically two weeks after retail sales. 15/07/09 08:30 ILO Unemployment 7.4% 7.2% May Country: UK 15/07/09 09:00 Harm. Index of Consumer Prices mm 0.2% 0.1% Jun Country: EMU Source: EU Eurostat. Raw Data Available At: ttp://europa.eu.int/comm/eurostat/ HICP is the inflation indicator used by the European Central Bank: The method for calculating the CPI varies in different countries and can cause problems for international comparisons. To address this problem, a harmonized index of consumer prices (HICP) have been developed within EU, based on coordinated methodology. HICP is a fundamental indicator for the European Central Bank (ECB) in evaluating EMU's monetary policy goals. HICP is also used to follow up the convergence criteria for price stability with regards to membership in EMU. 1996 is the base year and the index is calculated starting in 1995. Certain entries that are currently treated particularly differently in the calculation of national CPIs have been excluded. One particular difference compared with the CPI is that interest costs for owner-occupied homes are not included in the HICP. In addition, certain costs of owner-occupied homes (repairs, real-estate taxes, write-offs, insurance and ground rents), fees for tenant-owned flats, as well as lotteries, pools and tote betting are excluded. Some entries are included in the HICP but not in the CPI. These include childcare, elder care, hospital care and certain financial services (services where the fee is proportional to the size of the transaction). HICP is based on a completely harmonized product classification, COICOP (Classification Of Individual Consumption by Purpose). Harmonized rules for coverage, consideration of new products, updating the product sample, adjustments for changes in quality, and index formulas for the calculations are also used in calculating the HICP. The methods for calculating the index numbers and price changes for the HICP differ to a certain extent from the CPI. Similar to the CPI, the HICP is a chained index with yearly links but a long-term index is not calculated. Instead, yearly links in the HICP are calculated in the same way as the CPI's short-term index. 15/07/09 09:00 Harm. Index of Consumer Prices yy -0.1% 0.0% Jun Country: EMU Source: EU Eurostat. Raw Data Available At: ttp://europa.eu.int/comm/eurostat/ HICP is the inflation indicator used by the European Central Bank: The method for calculating the CPI varies in different countries and can cause problems for international comparisons. To address this problem, a harmonized index of consumer prices (HICP) have been developed within EU, based on coordinated methodology. HICP is a fundamental indicator for the European Central Bank (ECB) in evaluating EMU's monetary policy goals. HICP is also used to follow up the convergence criteria for price stability with regards to membership in EMU. 1996 is the base year and the index is calculated starting in 1995. Certain entries that are currently treated particularly differently in the calculation of national CPIs have been excluded. One particular difference compared with the CPI is that interest costs for owner-occupied homes are not included in the HICP. In addition, certain costs of owner-occupied homes (repairs, real-estate taxes, write-offs, insurance and ground rents), fees for tenant-owned flats, as well as lotteries, pools and tote betting are excluded. Some entries are included in the HICP but not in the CPI. These include childcare, elder care, hospital care and certain financial services (services where the fee is proportional to the size of the transaction). HICP is based on a completely harmonized product classification, COICOP (Classification Of Individual Consumption by Purpose). Harmonized rules for coverage, consideration of new products, updating the product sample, adjustments for changes in quality, and index formulas for the calculations are also used in calculating the HICP. The methods for calculating the index numbers and price changes for the HICP differ to a certain extent from the CPI. Similar to the CPI, the HICP is a chained index with yearly links but a long-term index is not calculated. Instead, yearly links in the HICP are calculated in the same way as the CPI's short-term index. 15/07/09 09:00 Core HICP mm 0.1% 0.0% Jun Country: EMU Source: EU Eurostat. Raw Data Available At: http://europa.eu.int/comm/eurostat/ HICP is the inflation indicator used by the European Central Bank: The method for calculating the CPI varies in different countries and can cause problems for international comparisons. To address this problem, a harmonized index of consumer prices (HICP) have been developed within EU, based on coordinated methodology. HICP is a fundamental indicator for the European Central Bank (ECB) in evaluating EMU's monetary policy goals. HICP is also used to follow up the convergence criteria for price stability with regards to membership in EMU. HICP can be greatly influenced in any given month by a movement in volatile food and energy prices. Therefore, it is important to look at HICP excluding food and energy, commonly called the "core rate" of inflation. Within the core rate, some of the more volatile and closely watched components are apparel, tobacco, airfares, and new cars. In addition to tracking the month/month changes in core HICP, the year/year change in core HICP is seen by most economists as the best measure of the underlying inflation rate. 15/07/09 09:00 Core HICP yy 1.5% 1.5% Jun Country: EMU Source: EU Eurostat. Raw Data Available At: http://europa.eu.int/comm/eurostat/ HICP is the inflation indicator used by the European Central Bank: The method for calculating the CPI varies in different countries and can cause problems for international comparisons. To address this problem, a harmonized index of consumer prices (HICP) have been developed within EU, based on coordinated methodology. HICP is a fundamental indicator for the European Central Bank (ECB) in evaluating EMU's monetary policy goals. HICP is also used to follow up the convergence criteria for price stability with regards to membership in EMU. HICP can be greatly influenced in any given month by a movement in volatile food and energy prices. Therefore, it is important to look at HICP excluding food and energy, commonly called the "core rate" of inflation. Within the core rate, some of the more volatile and closely watched components are apparel, tobacco, airfares, and new cars. In addition to tracking the month/month changes in core HICP, the year/year change in core HICP is seen by most economists as the best measure of the underlying inflation rate. 15/07/09 12:30 Core CPI mm 0.2% 0.1% Jun Country: US Source: Bureau of Labor statistics, U.S. Department of Labor. Raw Data Available At: http://stats.bls.gov/news.release/ppi.toc.htm Release Time: Around the 11th of each month at 8:30 ET for the prior month. The Producer Price Index measures prices of goods at the wholesale level. There are three broad subcategories within PPI: crude, intermediate, and finished. The market tracks the finished goods index most closely, as it represents prices for goods that are ready for sale to the end user. Goods prices at the crude and intermediate stages of production often provide an indication of coming (dis)inflationary pressures, but the closer you get to crude goods, the more that these prices track commodity prices which are already available in traded indexes such as the CRB (Commodity Research Bureau). At all stages of production, the market places more emphasis on the index excluding food and energy, referred to as the core rate. Food and energy prices tend to be quite volatile and obscure trends in the underlying inflation rate. Though the market reaction is determined by the month/month changes, year/year changes are also noted by analysts. The index is not revised on a monthly basis, but annual revisions to seasonal adjustment factors can produce small adjustments to past releases. 15/07/09 12:30 Consumer Price Index (CPI) mm 0.5% 0.1% Jun Country: US Source: Bureau of Labor statistics, U.S. Department of Labor. Raw Data Available At: http://stats.bls.gov/news.release/cpi.toc.htm Release Time: 8:30 ET, about the 13th of each month for the prior month. The Consumer Price Index is a measure of the price level of a fixed market basket of goods and services purchased by consumers. CPI is the most widely cited inflation indicator, and it is used to calculate cost of living adjustments for government programs and it is the basis of COLAs for many private labor agreements as well. It has been criticized for overstating inflation, because it does not adjust for substitution effects and because the fixed basket does not reflect price changes in new technology goods which are often declining in price. Despite these criticisms, it remains the benchmark inflation index. 15/07/09 12:30 Core CPI yy 1.7% 1.8% Jun Country: US Source: Bureau of Labor statistics, U.S. Department of Labor. Raw Data Available At: http://stats.bls.gov/news.release/ppi.toc.htm Release Time: Around the 11th of each month at 8:30 ET for the prior month. The Producer Price Index measures prices of goods at the wholesale level. There are three broad subcategories within PPI: crude, intermediate, and finished. The market tracks the finished goods index most closely, as it represents prices for goods that are ready for sale to the end user. Goods prices at the crude and intermediate stages of production often provide an indication of coming (dis)inflationary pressures, but the closer you get to crude goods, the more that these prices track commodity prices which are already available in traded indexes such as the CRB (Commodity Research Bureau). At all stages of production, the market places more emphasis on the index excluding food and energy, referred to as the core rate. Food and energy prices tend to be quite volatile and obscure trends in the underlying inflation rate. Though the market reaction is determined by the month/month changes, year/year changes are also noted by analysts. The index is not revised on a monthly basis, but annual revisions to seasonal adjustment factors can produce small adjustments to past releases. 15/07/09 12:30 Consumer Price Index (CPI) yy -1.6% -1.3% Jun Country: US Source: Bureau of Labor statistics, U.S. Department of Labor. Raw Data Available At: http://stats.bls.gov/news.release/cpi.toc.htm Release Time: 8:30 ET, about the 13th of each month for the prior month. The Consumer Price Index is a measure of the price level of a fixed market basket of goods and services purchased by consumers. CPI is the most widely cited inflation indicator, and it is used to calculate cost of living adjustments for government programs and it is the basis of COLAs for many private labor agreements as well. It has been criticized for overstating inflation, because it does not adjust for substitution effects and because the fixed basket does not reflect price changes in new technology goods which are often declining in price. Despite these criticisms, it remains the benchmark inflation index. 15/07/09 12:30 New-York Fed Survey -6 -9.41 Jul Country: US Source: Chicago Purchasing Managers Association. Raw Data Available At: http://www.phil.frb.org/ Release Time: Last business day of the month at 10 ET for the current month. In Brief There are many regional manufacturing surveys, and they tend to be ranked in order of timeliness and the importance of the region. The Philadelphia Fed's survey is first each month, actually coming out during the third week of the month for which it is reporting. Several smaller surveys are then released before the Chicago purchasing managers' report on the last day of each month. A few, such as the Atlanta and Richmond Fed surveys, are released after the NAPM and are of little value. The purchasing managers' reports are measured like the national NAPM - 50% marks the breakeven line between an expanding and contracting manufacturing sector. For the Philadelphia and Atlanta Fed indexes, 0 is the breakeven mark. These surveys can be of some help in forecasting the national NAPM - particularly the Philadelphia and Chicago surveys which are more closely watched due to their timeliness and the fact that these regions represent a reasonable cross section of national manufacturing activities. In Depth The market has been bombarded with a bevy of surveys purporting to measure manufacturing activity in every nook and cranny of the country. First it was Philadelphia, then Chicago, and Detroit, Milwaukee, New York, Cincinnati, Richmond, Atlanta, Boston, and there might as well have been a Nome survey. This hodge-podge of releases is begging for someone - namely us - to come along and cut this group down to a more manageable size. Nuts and Bolts Let's start with the issue of what these manufacturing surveys are trying to measure and how they go about doing it. The leader of this pack of regional surveys is the ISM index which comes from the Institute for Supply Management (formerly the National Association of Purchasing Managers). It has been around since 1931 (1948 on an uninterrupted basis), it is national, and it is one of the most timely measures of manufacturing activity available. In other words, it sets the standards by which its progeny are measured. The ISM index is actually a composite of five sub-indexes - new orders, production, supplier deliveries, inventories, and employment. In surveying over 300 companies each month, the ISM asks for positive, negative, or unchanged readings on each of these indicators. The positive responses are added to one half of the unchanged responses to produce the diffusion index. For example, if 50% of respondents reported stronger orders, 40% reported weaker, and 10% unchanged, the diffusion index for orders would be 55%, the 50% positive plus half of the 10% unchanged. To calculate the total index, the ISM uses weights for the five indicators, which are as follows: 30% new orders, 25% production, 20% employment, 15% supplier deliveries, and 10% inventories. The Selection Criteria Since this methodology has made the ISM index one of the better leading indicators of economic activity over the years, we will measure the usefulness of the regional indexes based on their ability to help in forecasting the national index. In our effort to arrive at the most important regional indices, these criteria make eliminating most of the candidates easy for one simple reason - they are released after the national index. While regional economic developments are of interest to those who live in the region, they are not particularly important to the markets. If a region cannot help in forecasting national trends, then its data are not particularly useful. So say adios to Atlanta, Richmond, Kansas City, and who knows how many others which have cropped up in recent years. And the Winner Is... Let's focus on the regional surveys which precede the release of the national index on the first business day of each month (with data for the prior month). The contestants are Philadelphia, Chicago, Milwaukee, Detroit, New York, and the most recent addition to the bunch - the APICS survey. We looked at the correlation of all of these indexes to the national NAPM and found substantial differences in their forecasting ability. The winners are...drum roll please...Chicago and Philadelphia, in that order. The Chicago PMI (officially known as the Business Barometer) is a monthly composite index based on opinion surveys of more than 200 Chicago purchasing managers regarding the manufacturing industry. The survey responses are limited to three options: slower, faster and same. As such, the index will not capture if a component is growing but at a much slower rate or vice versa. The index is a composite of seven similarly constructed indexes including: new orders, production, supplier delivery times, backlogs, inventories, prices paid, and employment. New orders and orders backlog indices indicate future production activity. It signals factory-sector expansion when it is above 50 and contraction when below it. The index is seasonally adjusted for the effects of variations within the year, differences due to holidays and institutional changes. Because it is an opinion survey, it is often influenced by respondents' perception of current events, as opposed to actual hard data. Also, it does not capture technological and production changes, which make it possible for production to expand, while employment contracts. Because the Chicago PMI is released the day before the ISM, it is watched in order to predict the more important ISM report (the Chicago PMI has an impressive 91% correlation with the ISM national NAPM), which is in itself a good leading indicator of overall economic activity. It frequently moves markets. The Philadelphia Fed index, which is released on the third Thursday of the month (with data for the same month), was a distant second at 76%. Philly Fed's performance improved slightly to 78% when Briefing measured its results using the NAPM methodology. The Philly index as released is not a composite of its subindexes, as the NAPM is. Instead, the Philly Fed survey asks many questions, but the total index is based on the general question "are business conditions better or worse than last month." It is often the case that a weighted measure of the individual questions on specifics such as new orders and production moves in a different direction than the index based on the general question. The rest of the regional indexes fared poorly, ranging from correlations as poor as 55% (APICS) to 73% (Milwaukee). Chicago was the clear winner, but the Philly Fed index definitely deserves recognition, particularly since it is released so much earlier than the rest. In the future, then, we would recommend setting aside most of the regional manufacturing surveys and focussing on just Philly and Chicago, which offer the best hope of predicting the national index. And when you look at the Philly index, improve your chances by looking at the Philly numbers calculated on an NAPM basis, which Briefing will be happy to provide. 15/07/09 13:15 Capacity Utilization 67.9% 68.3% Jun Country: US Source: Federal Reserve. Raw Data Available At: http://www.federalreserve.gov/releases/G17/Current/g17.txt Release Time: 9:15 ET around the 15th of the month (data for month prior). The index of Industrial Production is a fixed-weight measure of the physical output of the nation's factories, mines, and utilities. Manufacturing production, the largest component of the total, can be accurately predicted using total manufacturing hours worked from the employment report. One of the bigger wildcards in this report is utility production, which can be quite volatile due to swings in the weather. Severe hot or cold spells can boost production as increased heating/cooling needs drive utility production up. In addition to production, this monthly report also provides a measure of capacity utilization. Though the rate of capacity utilization is seen as a critical gauge of the slack available in the economy, the market does not completely trust this measure. Capacity is very difficult to measure, and the Fed essentially assumes that growth in capacity in any given year follows a straight line. One can therefore predict the capacity utilization rate quite accurately based on the assumption for production growth. The 85% mark is seen as a key barrier over which inflationary pressures are generated, but given revisions to these data and the difficulties with capacity measurement, the 85% mark should be viewed cautiously. It would be appropriate to look for corroborating inflation indications from commodity prices and vendor deliveries. 15/07/09 13:15 Industrial Production mm -0.6% -1.1% Jun Country: US Source: Federal Reserve. Raw Data Available At: http://www.federalreserve.gov/releases/G17/Current/g17.txt Release Time: 9:15 ET around the 15th of the month (data for month prior). The index of Industrial Production is a fixed-weight measure of the physical output of the nation's factories, mines, and utilities. Manufacturing production, the largest component of the total, can be accurately predicted using total manufacturing hours worked from the employment report. One of the bigger wildcards in this report is utility production, which can be quite volatile due to swings in the weather. Severe hot or cold spells can boost production as increased heating/cooling needs drive utility production up. In addition to production, this monthly report also provides a measure of capacity utilization. Though the rate of capacity utilization is seen as a critical gauge of the slack available in the economy, the market does not completely trust this measure. Capacity is very difficult to measure, and the Fed essentially assumes that growth in capacity in any given year follows a straight line. One can therefore predict the capacity utilization rate quite accurately based on the assumption for production growth. The 85% mark is seen as a key barrier over which inflationary pressures are generated, but given revisions to these data and the difficulties with capacity measurement, the 85% mark should be viewed cautiously. It would be appropriate to look for corroborating inflation indications from commodity prices and vendor deliveries. 15/07/09 18:00 Protocol of last interest rate meeting Country: US 15/07/09 22:45 Consumer Price Index (CPI) mm 0.3% Q2 Country: NewZealand Source: Bureau of Labor statistics, U.S. Department of Labor. Raw Data Available At: http://stats.bls.gov/news.release/cpi.toc.htm Release Time: 8:30 ET, about the 13th of each month for the prior month. The Consumer Price Index is a measure of the price level of a fixed market basket of goods and services purchased by consumers. CPI is the most widely cited inflation indicator, and it is used to calculate cost of living adjustments for government programs and it is the basis of COLAs for many private labor agreements as well. It has been criticized for overstating inflation, because it does not adjust for substitution effects and because the fixed basket does not reflect price changes in new technology goods which are often declining in price. Despite these criticisms, it remains the benchmark inflation index. 15/07/09 22:45 Consumer Price Index (CPI) yy 3.0% Q2 Country: NewZealand Source: Bureau of Labor statistics, U.S. Department of Labor. Raw Data Available At: http://stats.bls.gov/news.release/cpi.toc.htm Release Time: 8:30 ET, about the 13th of each month for the prior month. The Consumer Price Index is a measure of the price level of a fixed market basket of goods and services purchased by consumers. CPI is the most widely cited inflation indicator, and it is used to calculate cost of living adjustments for government programs and it is the basis of COLAs for many private labor agreements as well. It has been criticized for overstating inflation, because it does not adjust for substitution effects and because the fixed basket does not reflect price changes in new technology goods which are often declining in price. Despite these criticisms, it remains the benchmark inflation index. 15/07/09 23:30 Tankan Survey -50.0 Jul Country: Japan Source: Bank of Japan. Raw Data Available At: http://www2.boj.or.jp/en/dlong/tk/faqtk.htm When in December the Bank of Japan is publishing the latest results of its Tankan, once again the world will take them as an indicator of the state of the Japanese economy and as signal in which direction future monetary policy may go. The Tankan is a short-term economic survey of Japanese enterprises published four times a year. Figures for several series are available from 1957 onward, but the coverage of firms varied over time. For example, while in the early 1990s more than 8,000 enterprises were included, nowadays the survey covers about 9,000. Those are divided into four major groups: Large, small and medium-sized as well as principal enterprises. The survey contains questions about quantitative data as well as qualitative judgements concerning the following developments: 1. Business conditions 2. Supply and demand conditions for products and inventories as well as prices 3. Sales 4. Corporate profits 5. Fixed investments and production capacity 6. Employment conditions 7. Corporate finance as well as the lending attitude of financial institutions and changes in interest rates on loans. The qualitative judgements are the basis on which the Bank of Japan calculates so-called diffusion indexes. Firms choose between several alternatives, for example 1. favourable/non-favourable for business conditions 2. excessive/insufficient for demand conditions, inventory levels, production capacity and employment 3. easy/tight for corporate finance 4. accommodative/severe for the lending attitude of financial institutions. The diffusion indexes are constructed by subtracting the portion of responses with a negative tone from those with a positive one. The Tankan may give an overall impression of the business climate in Japan, but its reliance is weakened by at least two aspects: First, the construction of data from qualitative judgements somewhat disguises the fact that these only describe a rough tendency of momentary views of parts of the business community - soft information which can be no substitute for strong numbers. Second, as far as the firms are aware of the role of the Tankan as an indicator not only for the general public but also for policy decisions they may be tempted to influence it in one direction or the other by choosing their responses respectively. 16/07/09 09:00 ZEW Economic Sentiment 9.7 Jul Country: Switzerland Source: ZEW - The Centre for European Economic Research. Raw Data Available At: http://www.zew.de/ The ZEW (Zentrum für Europäische Wirtschaftsforschung - Centre for European Economic Research) is a non-profit economic research institute with the legal form of a limited liability company (GmbH). It was founded in 1990 on the initiative of the government of the federal state Baden-Württemberg, trade and industry, and the Mannheim University. In April 1991 the institute took up work and has expanded rapidly since then. The ZEW Index measures investors' expectations of economic growth. The ZEW index has a good reputation of anticipating the results of the broader IFO index that is widely regarded as an important leading indicator of the economy. The IFO index is available later in each month. 16/07/09 12:30 Initial Jobless Claims 565.0k L/W Country: US Source: The Employment and Training Administration of the Department of Labor. Raw Data Available At: http://www.dol.gov/opa/media/press/eta/main.htm Release Time: 8:30 ET each Thursday (data for week ended prior Saturday). This survey measures the attitudes and expectations concerning both present and future economic conditions of 500 consumers. The Michigan index is almost identical to the Conference Board Consumer Confidence index, though there are two monthly releases, a preliminary and final reading. Like the Conference Board index, it has two subindexes - expectations and current conditions. The expectations index is a component of the Conference Board's Leading Indicators index. 16/07/09 13:00 Capital Flow -53.2b May Country: US The Capital Account records a nation's incoming and outgoing investment flows such as payments for entire or parts of companies (direct or portfolio investment), stocks, bonds, bank accounts, real estate and factories. The balance of payments is influenced by many factors, including the financial and economic climate of other countries. Short-term capital movements Short-term flows into liquid assets such as bank deposits and Treasury bills are easily reversed and are sometimes characterised as "hot money". Since flows can change direction at the drop of an interest rate, they can cause severe volatility in the currency markets. Long-term capital movements Long-term capital includes portfolio investment (stocks and shares) and direct investment (such as building a factory overseas). However, it is perhaps increasingly unrealistic to distinguish between investment in stocks and shares (long-term capital) and the acquisition of Treasury bills (short-term capital). An outflow today implies current-account income in the future. Indeed, with global deregulation, it is easier for companies to raise their market share by setting up production facilities overseas. The initial direct investment shows as a capital-account outflow. Subsequently remitted profits add to current-account inflows and boost GNP relative to GDP. The value of goods sold, however, does not show up in external trade or increase GDP in the way that exports from home would. 16/07/09 14:00 Philadelphia Fed Survey -5.0 -2.2 Jul Country: US Source: Chicago Purchasing Managers Association. Raw Data Available At: http://www.phil.frb.org/ Release Time: Last business day of the month at 10 ET for the current month. In Brief There are many regional manufacturing surveys, and they tend to be ranked in order of timeliness and the importance of the region. The Philadelphia Fed's survey is first each month, actually coming out during the third week of the month for which it is reporting. Several smaller surveys are then released before the Chicago purchasing managers' report on the last day of each month. A few, such as the Atlanta and Richmond Fed surveys, are released after the NAPM and are of little value. The purchasing managers' reports are measured like the national NAPM - 50% marks the breakeven line between an expanding and contracting manufacturing sector. For the Philadelphia and Atlanta Fed indexes, 0 is the breakeven mark. These surveys can be of some help in forecasting the national NAPM - particularly the Philadelphia and Chicago surveys which are more closely watched due to their timeliness and the fact that these regions represent a reasonable cross section of national manufacturing activities. In Depth The market has been bombarded with a bevy of surveys purporting to measure manufacturing activity in every nook and cranny of the country. First it was Philadelphia, then Chicago, and Detroit, Milwaukee, New York, Cincinnati, Richmond, Atlanta, Boston, and there might as well have been a Nome survey. This hodge-podge of releases is begging for someone - namely us - to come along and cut this group down to a more manageable size. Nuts and Bolts Let's start with the issue of what these manufacturing surveys are trying to measure and how they go about doing it. The leader of this pack of regional surveys is the ISM index which comes from the Institute for Supply Management (formerly the National Association of Purchasing Managers). It has been around since 1931 (1948 on an uninterrupted basis), it is national, and it is one of the most timely measures of manufacturing activity available. In other words, it sets the standards by which its progeny are measured. The ISM index is actually a composite of five sub-indexes - new orders, production, supplier deliveries, inventories, and employment. In surveying over 300 companies each month, the ISM asks for positive, negative, or unchanged readings on each of these indicators. The positive responses are added to one half of the unchanged responses to produce the diffusion index. For example, if 50% of respondents reported stronger orders, 40% reported weaker, and 10% unchanged, the diffusion index for orders would be 55%, the 50% positive plus half of the 10% unchanged. To calculate the total index, the ISM uses weights for the five indicators, which are as follows: 30% new orders, 25% production, 20% employment, 15% supplier deliveries, and 10% inventories. The Selection Criteria Since this methodology has made the ISM index one of the better leading indicators of economic activity over the years, we will measure the usefulness of the regional indexes based on their ability to help in forecasting the national index. In our effort to arrive at the most important regional indices, these criteria make eliminating most of the candidates easy for one simple reason - they are released after the national index. While regional economic developments are of interest to those who live in the region, they are not particularly important to the markets. If a region cannot help in forecasting national trends, then its data are not particularly useful. So say adios to Atlanta, Richmond, Kansas City, and who knows how many others which have cropped up in recent years. And the Winner Is... Let's focus on the regional surveys which precede the release of the national index on the first business day of each month (with data for the prior month). The contestants are Philadelphia, Chicago, Milwaukee, Detroit, New York, and the most recent addition to the bunch - the APICS survey. We looked at the correlation of all of these indexes to the national NAPM and found substantial differences in their forecasting ability. The winners are...drum roll please...Chicago and Philadelphia, in that order. The Chicago PMI (officially known as the Business Barometer) is a monthly composite index based on opinion surveys of more than 200 Chicago purchasing managers regarding the manufacturing industry. The survey responses are limited to three options: slower, faster and same. As such, the index will not capture if a component is growing but at a much slower rate or vice versa. The index is a composite of seven similarly constructed indexes including: new orders, production, supplier delivery times, backlogs, inventories, prices paid, and employment. New orders and orders backlog indices indicate future production activity. It signals factory-sector expansion when it is above 50 and contraction when below it. The index is seasonally adjusted for the effects of variations within the year, differences due to holidays and institutional changes. Because it is an opinion survey, it is often influenced by respondents' perception of current events, as opposed to actual hard data. Also, it does not capture technological and production changes, which make it possible for production to expand, while employment contracts. Because the Chicago PMI is released the day before the ISM, it is watched in order to predict the more important ISM report (the Chicago PMI has an impressive 91% correlation with the ISM national NAPM), which is in itself a good leading indicator of overall economic activity. It frequently moves markets. The Philadelphia Fed index, which is released on the third Thursday of the month (with data for the same month), was a distant second at 76%. Philly Fed's performance improved slightly to 78% when Briefing measured its results using the NAPM methodology. The Philly index as released is not a composite of its subindexes, as the NAPM is. Instead, the Philly Fed survey asks many questions, but the total index is based on the general question "are business conditions better or worse than last month." It is often the case that a weighted measure of the individual questions on specifics such as new orders and production moves in a different direction than the index based on the general question. The rest of the regional indexes fared poorly, ranging from correlations as poor as 55% (APICS) to 73% (Milwaukee). Chicago was the clear winner, but the Philly Fed index definitely deserves recognition, particularly since it is released so much earlier than the rest. In the future, then, we would recommend setting aside most of the regional manufacturing surveys and focussing on just Philly and Chicago, which offer the best hope of predicting the national index. And when you look at the Philly index, improve your chances by looking at the Philly numbers calculated on an NAPM basis, which Briefing will be happy to provide. 17/07/09 01:30 Export Prices -16.0% -4.6% Q2 Country: Australia 17/07/09 01:30 Import Prices -6.0% -2.8% Q2 Country: Australia 17/07/09 09:00 International Trade Balance mm 2.7b May Country: EMU Source: The Census Bureau and the Bureau of Economic Analysis of the Department of Commerce. Raw Data Available At: http://www.census.gov/foreign-trade/www/press.html Release Time: 8:30 ET around the 20th of the month (data for two months prior). The trade report is most widely watched for trends in the overall trade balance. But trends in both exports and imports of goods and services bear watching as well. The export data in particular are important to watch for indications that a strengthening competitive position at home and/or strengthening economies overseas are boosting U.S. growth. Imports provide an indication of domestic demand, but given the severe lag of this report relative to other consumption indicators, it is not particularly valuable for this purpose. The volatility in the monthly trade balance can play an important role in GDP forecasts. Net exports are a relatively volatile component of GDP, and the trade report provides the only early clues to the net export performance each quarter. 17/07/09 11:00 Core CPI mm 0.4% Jun Country: Canada Source: Bureau of Labor statistics, U.S. Department of Labor. Raw Data Available At: http://stats.bls.gov/news.release/ppi.toc.htm Release Time: Around the 11th of each month at 8:30 ET for the prior month. The Producer Price Index measures prices of goods at the wholesale level. There are three broad subcategories within PPI: crude, intermediate, and finished. The market tracks the finished goods index most closely, as it represents prices for goods that are ready for sale to the end user. Goods prices at the crude and intermediate stages of production often provide an indication of coming (dis)inflationary pressures, but the closer you get to crude goods, the more that these prices track commodity prices which are already available in traded indexes such as the CRB (Commodity Research Bureau). At all stages of production, the market places more emphasis on the index excluding food and energy, referred to as the core rate. Food and energy prices tend to be quite volatile and obscure trends in the underlying inflation rate. Though the market reaction is determined by the month/month changes, year/year changes are also noted by analysts. The index is not revised on a monthly basis, but annual revisions to seasonal adjustment factors can produce small adjustments to past releases. 17/07/09 11:00 Core CPI yy 2.0% Jun Country: Canada Source: Bureau of Labor statistics, U.S. Department of Labor. Raw Data Available At: http://stats.bls.gov/news.release/ppi.toc.htm Release Time: Around the 11th of each month at 8:30 ET for the prior month. The Producer Price Index measures prices of goods at the wholesale level. There are three broad subcategories within PPI: crude, intermediate, and finished. The market tracks the finished goods index most closely, as it represents prices for goods that are ready for sale to the end user. Goods prices at the crude and intermediate stages of production often provide an indication of coming (dis)inflationary pressures, but the closer you get to crude goods, the more that these prices track commodity prices which are already available in traded indexes such as the CRB (Commodity Research Bureau). At all stages of production, the market places more emphasis on the index excluding food and energy, referred to as the core rate. Food and energy prices tend to be quite volatile and obscure trends in the underlying inflation rate. Though the market reaction is determined by the month/month changes, year/year changes are also noted by analysts. The index is not revised on a monthly basis, but annual revisions to seasonal adjustment factors can produce small adjustments to past releases. 17/07/09 11:00 Consumer Price Index (CPI) mm 0.7% Jun Country: Canada Source: Bureau of Labor statistics, U.S. Department of Labor. Raw Data Available At: http://stats.bls.gov/news.release/cpi.toc.htm Release Time: 8:30 ET, about the 13th of each month for the prior month. The Consumer Price Index is a measure of the price level of a fixed market basket of goods and services purchased by consumers. CPI is the most widely cited inflation indicator, and it is used to calculate cost of living adjustments for government programs and it is the basis of COLAs for many private labor agreements as well. It has been criticized for overstating inflation, because it does not adjust for substitution effects and because the fixed basket does not reflect price changes in new technology goods which are often declining in price. Despite these criticisms, it remains the benchmark inflation index. 17/07/09 11:00 Consumer Price Index (CPI) yy 0.1% Jun Country: Canada Source: Bureau of Labor statistics, U.S. Department of Labor. Raw Data Available At: http://stats.bls.gov/news.release/cpi.toc.htm Release Time: 8:30 ET, about the 13th of each month for the prior month. The Consumer Price Index is a measure of the price level of a fixed market basket of goods and services purchased by consumers. CPI is the most widely cited inflation indicator, and it is used to calculate cost of living adjustments for government programs and it is the basis of COLAs for many private labor agreements as well. It has been criticized for overstating inflation, because it does not adjust for substitution effects and because the fixed basket does not reflect price changes in new technology goods which are often declining in price. Despite these criticisms, it remains the benchmark inflation index. 17/07/09 12:30 Building Permits 0.53m 0.518m Jun Country: US Source: The Census Bureau of the Department of Commerce. Raw Data Available At: http://www.census.gov/const/www/newresconstindex.html Release Time: 8:30 ET around the 16th of the month (data for one month prior). Housing Starts are a measure of the number of residential units on which construction is begun each month. A start in construction is defined as the beginning of excavation of the foundation for the building and is comprised primarily of residential housing. Building permits are permits taken out in order to allow excavation. An increase in building permits and starts usually occurs a few months after a reduction in mortgage rates. Permits lead starts, but permits are not required in all regions of the country, and the level of permits therefore tends to be less than the level of starts over time. The monthly national report is broken down by region: Northeast, Midwest, South, and West. Briefing recommends analyzing the regional data because they are subject to a high degree of volatility. The high volatility can be attributed to weather changes and/or natural disasters. For example, an unexpectedly high level of rain in South could delay housing starts for the region. 17/07/09 12:30 Housing Starts yy 0.54m 0.532m Jun Country: US Source: The Census Bureau of the Department of Commerce. Raw Data Available At: http://www.census.gov/const/www/newresconstindex.html Release Time: 8:30 ET around the 16th of the month (data for one month prior). Housing Starts are a measure of the number of residential units on which construction is begun each month. A start in construction is defined as the beginning of excavation of the foundation for the building and is comprised primarily of residential housing. Building permits are permits taken out in order to allow excavation. An increase in building permits and starts usually occurs a few months after a reduction in mortgage rates. Permits lead starts, but permits are not required in all regions of the country, and the level of permits therefore tends to be less than the level of starts over time. The monthly national report is broken down by region: Northeast, Midwest, South, and West. Briefing recommends analyzing the regional data because they are subject to a high degree of volatility. The high volatility can be attributed to weather changes and/or natural disasters. For example, an unexpectedly high level of rain in South could delay housing starts for the region. 17/07/09 12:30 Leading Economic Indicators -0.1% Jun Country: Canada Source: The Conference Board. Raw Data Available At: http://www.tcb-indicators.org/ Release Time: 8:30 ET around the third week of the month for the month prior. In Brief The Leading Indicators report is, for the most part, a compendium of previously announced economic indicators: new orders, jobless claims, money supply, average workweek, building permits, and stock prices. Therefore, the report is extremely predictable and of very little interest to the market. Though this series does have some predictive qualities, it is a common criticism that it has predicted "nine of the last six" recessions. The Commerce Department previously published the leading indicators series. The collection and publishing of these data is now done by the non-profit Conference Board, which also produces the Consumer Confidence index. In Depth Purpose The purpose of the leading index is straightforward: It is designed to signal turning points in the business cycle. Composition The index of leading indicators includes the ten economic statistics listed below. 1. The interest rate spread between 10-year Treasury notes and the federal funds rate. 2. The inflation-adjusted, M2 measure of the money supply. 3. The average manufacturing workweek. 4. Manufacturers' new orders for consumer goods and materials. 5. The S&P 500 measure of stock prices. 6. The vendor performance component of the NAPM index. 7. The average level of weekly initial claims for unemployment insurance. 8. Building permits. 9. The University of Michigan index of consumer expectations. 10. Manufacturers' new orders for nondefense capital goods. The Conference Board, the organization that produces the leading index, standardizes these variables according to their individual weights in order to construct a composite leading index. Note that we have listed the components in order of importance. The difference between 10-year Treasuries and the fed funds rate carries the most weight; historically, this approximation of the slope of the yield curve has proven relatively more successful than other components at predicting future economic activity. Along those same lines, orders for nondefense capital goods carry the smallest weight because they have typically proven relatively poorer at pointing to changes in the direction of economic growth at large. Performance The leading index receives plenty of criticism. Indeed, skeptics often joke that it has correctly signalled nine of the last six recessions. Meanwhile, in its literature, The Conference Board cites the lead times with which the leading index has correctly predicted economic downturns. It is thus fair to ask whether the leading index is useless or priceless. The answer lies somewhere in between. The charge that the index predicts recessions that do not come to fruition--and fails to warn of those that do--is hardly a fair criticism. No forecaster, even armed with an arsenal of economic statistics, has a perfect track record when it comes to predicting recessions. It is therefore unreasonable to assume that a ten- component index can do any better. That said, the index does have some reliability problems. For example, it failed to turn down prior to the 1990-91 recession, and in 1995 it signalled a downturn that never came to pass. Usefulness The leading index is more useful now that The Conference Board has taken control of it (the Department of Commerce stopped producing it at the end of 1996). Conference Board researchers quickly scrapped two of the old components--the change in sensitive materials prices and unfilled orders for durable goods--and added the interest-rate spread that appears in our list above. The index now lacks a wholesale price term, which some see as critical to determining future demand and inflation trends, but on net the new index emits less pronounced false signals and does a better job than it used to. Briefing finds the leading index most helpful when we can make a statement like this: The leading index has decreased only once during the past year. Of course, even a strong trend like that does not guarantee that a recession will not form over the coming six to nine months. But we can get additional help from looking at the leading index with the coincident index, which is also published by The Conference Board, and alongside a couple of other leading indices published by Columbia University. Indeed, there exists much research that deals with the criteria for determining recession warnings (i.e., the leading index must fall during four of seven months and the coincident index must fall for three straight months). Results for the week of: 6/07/2009 - 10/07/2009 6 July 2009 - 10 July 2009 * GMT Time Date Hour Country Data Result Forecast Previous Period ********** 06/07/09 05:00 GMT Leading Economic Indicators 1.0 May Country: Japan Source: The Conference Board. Raw Data Available At: http://www.tcb-indicators.org/ Release Time: 8:30 ET around the third week of the month for the month prior. In Brief The Leading Indicators report is, for the most part, a compendium of previously announced economic indicators: new orders, jobless claims, money supply, average workweek, building permits, and stock prices. Therefore, the report is extremely predictable and of very little interest to the market. Though this series does have some predictive qualities, it is a common criticism that it has predicted "nine of the last six" recessions. The Commerce Department previously published the leading indicators series. The collection and publishing of these data is now done by the non-profit Conference Board, which also produces the Consumer Confidence index. In Depth Purpose The purpose of the leading index is straightforward: It is designed to signal turning points in the business cycle. Composition The index of leading indicators includes the ten economic statistics listed below. 1. The interest rate spread between 10-year Treasury notes and the federal funds rate. 2. The inflation-adjusted, M2 measure of the money supply. 3. The average manufacturing workweek. 4. Manufacturers' new orders for consumer goods and materials. 5. The S&P 500 measure of stock prices. 6. The vendor performance component of the NAPM index. 7. The average level of weekly initial claims for unemployment insurance. 8. Building permits. 9. The University of Michigan index of consumer expectations. 10. Manufacturers' new orders for nondefense capital goods. The Conference Board, the organization that produces the leading index, standardizes these variables according to their individual weights in order to construct a composite leading index. Note that we have listed the components in order of importance. The difference between 10-year Treasuries and the fed funds rate carries the most weight; historically, this approximation of the slope of the yield curve has proven relatively more successful than other components at predicting future economic activity. Along those same lines, orders for nondefense capital goods carry the smallest weight because they have typically proven relatively poorer at pointing to changes in the direction of economic growth at large. Performance The leading index receives plenty of criticism. Indeed, skeptics often joke that it has correctly signalled nine of the last six recessions. Meanwhile, in its literature, The Conference Board cites the lead times with which the leading index has correctly predicted economic downturns. It is thus fair to ask whether the leading index is useless or priceless. The answer lies somewhere in between. The charge that the index predicts recessions that do not come to fruition--and fails to warn of those that do--is hardly a fair criticism. No forecaster, even armed with an arsenal of economic statistics, has a perfect track record when it comes to predicting recessions. It is therefore unreasonable to assume that a ten-component index can do any better. That said, the index does have some reliability problems. For example, it failed to turn down prior to the 1990-91 recession, and in 1995 it signalled a downturn that never came to pass. Usefulness The leading index is more useful now that The Conference Board has taken control of it (the Department of Commerce stopped producing it at the end of 1996). Conference Board researchers quickly scrapped two of the old components--the change in sensitive materials prices and unfilled orders for durable goods--and added the interest-rate spread that appears in our list above. The index now lacks a wholesale price term, which some see as critical to determining future demand and inflation trends, but on net the new index emits less pronounced false signals and does a better job than it used to. Briefing finds the leading index most helpful when we can make a statement like this: The leading index has decreased only once during the past year. Of course, even a strong trend like that does not guarantee that a recession will not form over the coming six to nine months. But we can get additional help from looking at the leading index with the coincident index, which is also published by The Conference Board, and alongside a couple of other leading indices published by Columbia University. Indeed, there exists much research that deals with the criteria for determining recession warnings (i.e., the leading index must fall during four of seven months and the coincident index must fall for three straight months). ********** 06/07/09 14:00 Services PMI 45.6 44.0 Jun Country: US Source: Institute for Supply Management. Raw Data Available At: http://www.ism.ws/ISMReport/index.cfm Release Time: 10:00 ET on the first business day of the month for the prior month. ISM: Institute for Supply Management formerly NAPM: National Association of Purchasing Managers In Brief The ISM report is a national survey of purchasing managers which covers such indicators as new orders, production, employment, inventories, delivery times, prices, export orders, and import orders. Diffusion indexes are produced for each of these categories, with a reading over 50% indicating expansion relative to the prior month, and a sub-50% reading indicating contraction. The total index is calculated based on a weighted average of the following five sub- indexes, with weights in parentheses: new orders (30%), production (25%), employment (20%), deliveries (15%), and inventories (10%). The ISM is one of the first comprehensive economic releases of the month, typically preceding the employment report. Though it covers only the manufacturing sector, it can often provide accurate hints regarding the tone of subsequent releases. During periods of inflation concerns, the prices paid and vendor deliveries indexes often determine the bond market's reaction to the report. In Depth The Institute for Supply Management's monthly Report on Business is probably the most widely watched economic indicator produced by the private sector. There are two key reasons for the ISM's prominence. First, its longevity - the report was first produced in 1931, and after a break during World War II, it has produced continuously since 1948. Second , its leading quality - the ISM has been one of the better predictors of the business cycle over the years. More than 370 purchasing and supply management professionals in the non- manufacturing sector participate in the survey by completing a monthly questionnaire covering Business Activity, New Orders, Backlog of Orders, New Export Orders, Inventory Change, Inventory Sentiment, Imports, Prices, Employment, and Supplier Deliveries. The respondents are from more than 60 different sectors representing nine divisions from the Standard Industrial Code classification system including Agriculture, Forestry, & Fisheries; Mining; Construction; Transportation, Communications, Electric, Gas, and Sanitary Services; Wholesale Trade; Retail Trade; Finance, Insurance & Real Estate; Services; and Public Administration. Geographic location is also a consideration The results of the responses are compiled in the Non-Manufacturing NAPM Report on Business®by Ralph G. Kauffman, Ph.D., C.P.M, chair of the Non- Manufacturing Business Survey Committee. Following the initial release, this new report will be issued on the third business day of each month at 10:00 a.m. eastern Time via Business Wire and Xpedite Broadcast Fax. The National Association of Purchasing Management is a not-for-profit association that provides national and international leadership in purchasing and supply management research and education. NAPM provides its more than 44,000 members in its 180 affiliated associations with opportunities to expand their professional skills and knowledge. ********** 07/07/09 04:30 GMT Interest Rate Decision 3.0% Jul Country: Australia Source (U.S.): The Federal Reserve Open Market Committee - FOMC. Source (World): The Central Bank Monetary Policy Committee - MPC. The Federal Open Market Committee is a twelve-member committee made up of the seven members of the Board of Governors and five Federal Reserve Bank presidents. It meets eight times per year to determine the near-term direction of monetary policy, such as setting guidelines for the purchase and sale of government securities and setting policy relating to System operations in the foreign exchange markets. These changes in monetary policy are now announced immediately after FOMC meetings. Most importantly, the Fed determines interest rate policy at FOMC meetings. Market participants speculate about the possibility of an interest rate change at these meetings, and if the outcome is different from expectations, the impact on the markets can be dramatic and far-reaching. The interest rate set by the Fed the federal funds rate serves as a benchmark for all other rates. A change in the fed funds rate, the lending rate banks charge each other for the use of overnight funds, translates directly through to all other interest rates from Treasury bonds to mortgage loans. It also changes the dynamics of competition for investor dollars: when bonds yield 10 percent, they will attract more money away from stocks then when they only yield 5 percent. The level of interest rates affects the economy­ higher rates tend to slow activity; lower rates stimulate activity, a ripple effect that expands into all sectors of the economy. ********** 07/07/09 08:30 GMT Industrial Production mm 0.2% 0.3% May Country: UK Source: Federal Reserve. Raw Data Available At: http://www.federalreserve.gov/releases/G17/Current/g17.txt Release Time: 9:15 ET around the 15th of the month (data for month prior). The index of Industrial Production is a fixed-weight measure of the physical output of the nation's factories, mines, and utilities. Manufacturing production, the largest component of the total, can be accurately predicted using total manufacturing hours worked from the employment report. One of the bigger wildcards in this report is utility production, which can be quite volatile due to swings in the weather. Severe hot or cold spells can boost production as increased heating/cooling needs drive utility production up. In addition to production, this monthly report also provides a measure of capacity utilization. Though the rate of capacity utilization is seen as a critical gauge of the slack available in the economy, the market does not completely trust this measure. Capacity is very difficult to measure, and the Fed essentially assumes that growth in capacity in any given year follows a straight line. One can therefore predict the capacity utilization rate quite accurately based on the assumption for production growth. The 85% mark is seen as a key barrier over which inflationary pressures are generated, but given revisions to these data and the difficulties with capacity measurement, the 85% mark should be viewed cautiously. It would be appropriate to look for corroborating inflation indications from commodity prices and vendor deliveries. ********** 07/07/09 08:30 GMT Industrial Production yy -11.2% -12.3% May Country: UK Source: Federal Reserve. Raw Data Available At: http://www.federalreserve.gov/releases/G17/Current/g17.txt Release Time: 9:15 ET around the 15th of the month (data for month prior). The index of Industrial Production is a fixed-weight measure of the physical output of the nation's factories, mines, and utilities. Manufacturing production, the largest component of the total, can be accurately predicted using total manufacturing hours worked from the employment report. One of the bigger wildcards in this report is utility production, which can be quite volatile due to swings in the weather. Severe hot or cold spells can boost production as increased heating/cooling needs drive utility production up. In addition to production, this monthly report also provides a measure of capacity utilization. Though the rate of capacity utilization is seen as a critical gauge of the slack available in the economy, the market does not completely trust this measure. Capacity is very difficult to measure, and the Fed essentially assumes that growth in capacity in any given year follows a straight line. One can therefore predict the capacity utilization rate quite accurately based on the assumption for production growth. The 85% mark is seen as a key barrier over which inflationary pressures are generated, but given revisions to these data and the difficulties with capacity measurement, the 85% mark should be viewed cautiously. It would be appropriate to look for corroborating inflation indications from commodity prices and vendor deliveries. ********** 07/07/09 10:00 Factory Orders mm 0.9% 0.0% May Country: Germany Source: The Census Bureau of the Department of Commerce. Raw Data Available At: http://www.census.gov/ftp/pub/indicator/www/m3/index.htm Release Time: 10:00 ET around the first business day of the month (data for two months prior). Factory orders consist of the earlier announced durable goods report plus non- durable goods orders. The report is very predictable with nondurables the only new component. Nondurables consist of such items as food and tobacco products which grow at a fairly consistent monthly rate, so that market forecasts for this report are far more accurate than for the durable orders report. In addition to seeing nondurables for the first time, the market also watches for revisions to the durable orders data, which can be significant. At present, durable goods orders sum to about 54% of total orders. The final piece of new information in this report is factory inventories -- the first glimpse at the inventory picture each month (wholesales inventories are typically released a week later, with retail inventories released a few days after wholesale inventories). Though the inventory figure is not a market-mover, economists use this number to help forecast inventories in the quarterly GDP report. ********** 07/07/09 12:30 GMT Building Permits -5.4% May Country: Canada Source: The Census Bureau of the Department of Commerce. Raw Data Available At: http://www.census.gov/const/www/newresconstindex.html Release Time: 8:30 ET around the 16th of the month (data for one month prior). Housing Starts are a measure of the number of residential units on which construction is begun each month. A start in construction is defined as the beginning of excavation of the foundation for the building and is comprised primarily of residential housing. Building permits are permits taken out in order to allow excavation. An increase in building permits and starts usually occurs a few months after a reduction in mortgage rates. Permits lead starts, but permits are not required in all regions of the country, and the level of permits therefore tends to be less than the level of starts over time. The monthly national report is broken down by region: Northeast, Midwest, South, and West. Briefing recommends analyzing the regional data because they are subject to a high degree of volatility. The high volatility can be attributed to weather changes and/or natural disasters. For example, an unexpectedly high level of rain in South could delay housing starts for the region. ********** 07/07/09 14:00 Services PMI 48.4 Jun Country: Canada Source: Institute for Supply Management. Raw Data Available At: http://www.ism.ws/ISMReport/index.cfm Release Time: 10:00 ET on the first business day of the month for the prior month. ISM: Institute for Supply Management formerly NAPM: National Association of Purchasing Managers In Brief The ISM report is a national survey of purchasing managers which covers such indicators as new orders, production, employment, inventories, delivery times, prices, export orders, and import orders. Diffusion indexes are produced for each of these categories, with a reading over 50% indicating expansion relative to the prior month, and a sub-50% reading indicating contraction. The total index is calculated based on a weighted average of the following five sub- indexes, with weights in parentheses: new orders (30%), production (25%), employment (20%), deliveries (15%), and inventories (10%). The ISM is one of the first comprehensive economic releases of the month, typically preceding the employment report. Though it covers only the manufacturing sector, it can often provide accurate hints regarding the tone of subsequent releases. During periods of inflation concerns, the prices paid and vendor deliveries indexes often determine the bond market's reaction to the report. In Depth The Institute for Supply Management's monthly Report on Business is probably the most widely watched economic indicator produced by the private sector. There are two key reasons for the ISM's prominence. First, its longevity - the report was first produced in 1931, and after a break during World War II, it has produced continuously since 1948. Second , its leading quality - the ISM has been one of the better predictors of the business cycle over the years. More than 370 purchasing and supply management professionals in the non- manufacturing sector participate in the survey by completing a monthly questionnaire covering Business Activity, New Orders, Backlog of Orders, New Export Orders, Inventory Change, Inventory Sentiment, Imports, Prices, Employment, and Supplier Deliveries. The respondents are from more than 60 different sectors representing nine divisions from the Standard Industrial Code classification system including Agriculture, Forestry, & Fisheries; Mining; Construction; Transportation, Communications, Electric, Gas, and Sanitary Services; Wholesale Trade; Retail Trade; Finance, Insurance & Real Estate; Services; and Public Administration. Geographic location is also a consideration The results of the responses are compiled in the Non-Manufacturing NAPM Report on Business®by Ralph G. Kauffman, Ph.D., C.P.M, chair of the Non- Manufacturing Business Survey Committee. Following the initial release, this new report will be issued on the third business day of each month at 10:00 a.m. eastern Time via Business Wire and Xpedite Broadcast Fax. The National Association of Purchasing Management is a not-for-profit association that provides national and international leadership in purchasing and supply management research and education. NAPM provides its more than 44,000 members in its 180 affiliated associations with opportunities to expand their professional skills and knowledge. ********** 07/07/09 23:00 Consumer Confidence 53.0 Jun Country: UK Source: The Conference Board. Raw Data Available At: http://www.tcb-indicators.org/ Release Time: 10:00 ET on the last Tuesday of the month (data for current month). This survey measures the level of confidence individual households have in the performance of the economy now and in the future. It is a leading indicator of future spending and the business cycle. 5000 consumers in the nine census divisions across the country are surveyed each month. The level of consumer confidence is directly correlated to the strength of consumer spending, which accounts for two-thirds of the economy. It also correlates closely with joblessness, inflation, and real incomes. The report can occasionally be helpful in predicting sudden shifts in consumption patterns, though most small changes in the index are just noise. Only index changes of at least five points should be considered significant. The index consists of two subindexes - consumers' appraisal of current conditions and their expectations for the future. Expectations make up 60% of the total index, with current conditions accounting for the other 40%. The expectations index is typically seen as having better leading indicator qualities than the current conditions index. The more confident consumers are about the economy and their own personal finances, the more likely they are to spend. Note, changes in consumer confidence and retail sales do not move in tandem month by month. If the economy experiences a long-term expansion, buying intentions may decline even while the jobless rate declines because of the satisfaction of pent-up demand. Conversely, if inflation begins to accelerate, spending plans may increase for the short-term as consumers buy now to avoid having to pay higher prices later. Regional differences in consumer confidence are an indication of differing business cycles across the nation. This has implications for spending on durable goods and, more importantly, for residential real estate markets. Financial markets interpret rising consumer confidence as a precursor to higher consumer spending. Higher consumer spending could in turn spark inflation. Look for a change in the direction of the six month moving average of the index. Consumers do not usually have the necessary information to accurately assess income and job growth six months in the future. The report provides information on planned spending, which does not necessarily turn into actual spending, although it is unlikely that increasing consumer confidence would be followed by a decline in spending. The Consumer Confidence survey is not useful for any type of forecasting. ********** 07/07/09 23:50 Capital Account -24.2% -54.5% May Country: Japan The Capital Account records a nation's incoming and outgoing investment flows such as payments for entire or parts of companies (direct or portfolio investment), stocks, bonds, bank accounts, real estate and factories. The balance of payments is influenced by many factors, including the financial and economic climate of other countries. Short-term capital movements Short-term flows into liquid assets such as bank deposits and Treasury bills are easily reversed and are sometimes characterised as "hot money". Since flows can change direction at the drop of an interest rate, they can cause severe volatility in the currency markets. Long-term capital movements Long-term capital includes portfolio investment (stocks and shares) and direct investment (such as building a factory overseas). However, it is perhaps increasingly unrealistic to distinguish between investment in stocks and shares (long-term capital) and the acquisition of Treasury bills (short-term capital). An outflow today implies current-account income in the future. Indeed, with global deregulation, it is easier for companies to raise their market share by setting up production facilities overseas. The initial direct investment shows as a capital- account outflow. Subsequently remitted profits add to current-account inflows and boost GNP relative to GDP. The value of goods sold, however, does not show up in external trade or increase GDP in the way that exports from home would. ********** 07/07/09 23:50 Machinery Orders mm 2.1% -5.4% May Country: Japan The Japanese equivalent to Durable Goods Orders. ********** 08/07/09 01:00 Consumer Confidence 12.7% Jul Country: Australia Source: The Conference Board. Raw Data Available At: http://www.tcb-indicators.org/ Release Time: 10:00 ET on the last Tuesday of the month (data for current month). This survey measures the level of confidence individual households have in the performance of the economy now and in the future. It is a leading indicator of future spending and the business cycle. 5000 consumers in the nine census divisions across the country are surveyed each month. The level of consumer confidence is directly correlated to the strength of consumer spending, which accounts for two-thirds of the economy. It also correlates closely with joblessness, inflation, and real incomes. The report can occasionally be helpful in predicting sudden shifts in consumption patterns, though most small changes in the index are just noise. Only index changes of at least five points should be considered significant. The index consists of two subindexes - consumers' appraisal of current conditions and their expectations for the future. Expectations make up 60% of the total index, with current conditions accounting for the other 40%. The expectations index is typically seen as having better leading indicator qualities than the current conditions index. The more confident consumers are about the economy and their own personal finances, the more likely they are to spend. Note, changes in consumer confidence and retail sales do not move in tandem month by month. If the economy experiences a long-term expansion, buying intentions may decline even while the jobless rate declines because of the satisfaction of pent-up demand. Conversely, if inflation begins to accelerate, spending plans may increase for the short-term as consumers buy now to avoid having to pay higher prices later. Regional differences in consumer confidence are an indication of differing business cycles across the nation. This has implications for spending on durable goods and, more importantly, for residential real estate markets. Financial markets interpret rising consumer confidence as a precursor to higher consumer spending. Higher consumer spending could in turn spark inflation. Look for a change in the direction of the six month moving average of the index. Consumers do not usually have the necessary information to accurately assess income and job growth six months in the future. The report provides information on planned spending, which does not necessarily turn into actual spending, although it is unlikely that increasing consumer confidence would be followed by a decline in spending. The Consumer Confidence survey is not useful for any type of forecasting. ********** 08/07/09 05:45 Unemployment Rate 3.6% 3.5% Jun Country: Switzerland Source: Bureau of Labor Statistics, U.S. Department of Labor. Raw Data Available At: http://stats.bls.gov/news.release/empsit.toc.htm Release Time: First Friday of the month at 8:30 ET for the prior month. In Brief The employment report is actually two separate reports which are the results of two separate surveys. The household survey is a survey of roughly 60,000 households. This survey produces the unemployment rate. The establishment survey is a survey of 375,000 businesses. This survey produces the nonfarm payrolls, average workweek, and average hourly earnings figures, to name a few. Both surveys cover the payroll period which includes the 12th of each month. The reports both measure employment levels, just from different angles. Due to the vastly different size of the survey samples (the establishment survey not only surveys more businesses, but each business employs many individuals), the measures of employment may differ markedly from month to month. The household survey is used only for the unemployment measure - the market focusses primarily on the more comprehensive establishment survey. Together, these two surveys make up the employment report, the most timely and broad indicator of economic activity released each month. Total payrolls are broken down into sectors such as manufacturing, mining, construction, services, and government. The markets follows these components closely as indicators of the trends in sectors of the economy; the manufacturing sector is watched the most closely as it often leads the business cycle. The data also include breakdowns of hours worked, overtime, and average hourly earnings. The average workweek (also known as hours worked) is important for two reasons. First, it is a critical determinant of such monthly indicators as industrial production and personal income. Second, it is considered a useful indicator of labor market conditions: a rising workweek early in the business cycle may be the first indication that employers are preparing to boost their payrolls, while late in the cycle a rising workweek may indicate that employers are having difficulty finding qualified applicants for open positions. Average earnings are closely followed as an indicator of potential inflation. Like the price of any good or service, the price of labor reacts to an overly accommodative monetary policy. If the price of labor is rising sharply, it may be an indication that too much money is chasing too few goods, or in this case employees. In Depth The employment report is really two reports - the household survey and the establishment survey. These two surveys contain a wealth of timely information which justify this report's status as the most important economic release of the month. This same wealth of information can nevertheless turn into a dearth of knowledge if it is not placed in the proper context. Household and Establishment Surveys The household and establishment surveys differ due to the source of the data, as the names suggest. The household survey is a survey of households and the establishment survey is a surveys of businesses. The establishment survey, which is sometimes referred to as the payrolls survey, is favored by the market for a simple reason - it is far more comprehensive. Both surveys attempt to measure employment conditions at the roughly the same point in time - the household survey covers the calendar week which includes the 12th of the month while the establishment survey covers the pay period (be it a week, two weeks, or longer) which includes the 12th. But the establishment survey covers 390,000 businesses which employ 47 million people, while the household survey covers just 50,000 individuals. With a sample size which is 940 times larger than the household survey, it is hardly surprising that the market is more interested in the establishment survey. Aside from the sample size, the surveys differ in other significant ways. The household survey counts farm workers, the self-employed, unpaid family workers, and private household workers as employed; the establishment survey does not. The household survey can only count one individual as employed once, even if that person holds two jobs. The establishment survey will double count an individual who appears on the payrolls of two companies. There are other, less significant differences, but let's turn now to the statistics produced by the two surveys. The Household Survey The Unemployment Rate As we noted earlier, the household survey is not nearly as reliable as the establishment survey due to the small size of the survey sample. This survey nevertheless receives attention, primarily because it is responsible for the one figure which is guaranteed to lead the nightly news - the unemployment rate. The unemployment rate demands little explanation, though it is worth noting that the rate can occasionally sees significant monthly changes which are due to flukes in the data. The rate is simply the result of dividing the number of people unemployed (labor force less employed) by the number of people in the labor force. The problem is that the employment and labor force measures in the household survey are far more volatile than even nonfarm payrolls. The reason, of course, is the small survey sample size. It is therefore useful to look at the labor force and employment figures themselves to determine if changes in the unemployment rate are due to aberrant swings in one or both of these series. Beyond the basics of tallying up the labor force and employment, the household survey breaks down these totals in every way imaginable - by gender, race, age, type of job, duration of unemployment, and on and on. These breakdowns seldom are of interest to the financial markets. Perhaps the only two exceptions are the discouraged worker and part-time worker measures. Discouraged Workers Discouraged workers are people who have dropped out of the labor force because they have become discouraged about their job prospects. During hard times, this statistic is often watched alongside the unemployment rate. If the job situation gets exceptionally bleak, it is possible to see the unemployment rate remaining stable not because people are finding jobs, but because they have given up looking and dropped out of the labor force. Part-Time Workers The issue of part time employment has arisen in recent years as many analysts have argued that strong payroll growth reflected the increase in the number of workers holding multiple part-time jobs. Since the payroll data do not differentiate between full and part-time workers, it is possible that a sudden surge in part-time employment which reflected poor full-time job prospects would actually boost payroll growth. In reality, it does not appear that this has happened, as part-time employment has been relatively steady in recent years. This figure nevertheless receives attention from time to time. The Big Picture Given the wealth of data contained in the employment report, it is important to take all of these indicators into account when passing judgment on the report. Looking at payrolls along is often misleading, as the workweek, earnings, and household employment measures may be telling a different story. Taken together, however, and taken with the caveats concerning monthly volatility and revisions, the employment report offers the best monthly glimpse of the economy. ********** 08/07/09 09:00 Gross Domestic Product (GDP) qq -2.5% -1.8% Q1 Country: EMU Source: Bureau of Economic Analysis, U.S. Department of Commerce. Raw Data Available At: http://www.bea.doc.gov/bea/dn1.htm Release Time: Third or fourth week of the month at 8:30 ET for the prior quarter, with subsequent revisions released in the second and third months of the quarter. Gross Domestic Product (GDP) is the broadest measure of economic activity. Annualized quarterly percent changes in GDP reflect the growth rate of total economic output. The figures can be quite volatile from quarter to quarter. Inventory and net export swings in particular can produce significant volatility in GDP. The final sales figure, which excludes inventories, can sometimes be helpful in identifying underlying growth trends as inventories represent unsold goods, and a large inventory increase will boost GDP but might be indicative of weakness rather than strength. The broad components of GDP are: consumption, investment, net exports, government purchases, and inventories. Consumption is by far the largest component, totalling roughly 2/3rds of GDP. In addition to the GDP figures, there are GDP deflators, which measure the change in prices in total GDP and for each component. Though the consumer price index is a more closely watched inflation indicator, the GDP deflator is another key inflation measure. Unlike CPI, it has the advantage of not being a fixed basket of goods and services, so that changes in consumption patterns or the introduction of new goods and services will be reflected in the deflator. With both GDP and the deflator, the market tends to focus on the quarter/quarter change. Year/year changes are also cited frequently, though they do not provide the most timely indications of economic activity or inflation. The bond market often reacts to GDP, though the price moves are typically small, as much of the GDP data is easily predicted using monthly economic releases such as personal consumption, durable goods shipments, construction spending, international trade, and inventories. Quarterly GDP reports are broken down into three announcements: advance, preliminary, and final. After the final revision, GDP is not revised again until the annual benchmark revisions each July. These revisions can be quite large and usually affect the past five years of data. ********** 08/07/09 09:00 Gross Domestic Product (GDP) yy -4.8% -1.7% Q1 Country: EMU Source: Bureau of Economic Analysis, U.S. Department of Commerce. Raw Data Available At: http://www.bea.doc.gov/bea/dn1.htm Release Time: Third or fourth week of the month at 8:30 ET for the prior quarter, with subsequent revisions released in the second and third months of the quarter. Gross Domestic Product (GDP) is the broadest measure of economic activity. Annualized quarterly percent changes in GDP reflect the growth rate of total economic output. The figures can be quite volatile from quarter to quarter. Inventory and net export swings in particular can produce significant volatility in GDP. The final sales figure, which excludes inventories, can sometimes be helpful in identifying underlying growth trends as inventories represent unsold goods, and a large inventory increase will boost GDP but might be indicative of weakness rather than strength. The broad components of GDP are: consumption, investment, net exports, government purchases, and inventories. Consumption is by far the largest component, totalling roughly 2/3rds of GDP. In addition to the GDP figures, there are GDP deflators, which measure the change in prices in total GDP and for each component. Though the consumer price index is a more closely watched inflation indicator, the GDP deflator is another key inflation measure. Unlike CPI, it has the advantage of not being a fixed basket of goods and services, so that changes in consumption patterns or the introduction of new goods and services will be reflected in the deflator. With both GDP and the deflator, the market tends to focus on the quarter/quarter change. Year/year changes are also cited frequently, though they do not provide the most timely indications of economic activity or inflation. The bond market often reacts to GDP, though the price moves are typically small, as much of the GDP data is easily predicted using monthly economic releases such as personal consumption, durable goods shipments, construction spending, international trade, and inventories. Quarterly GDP reports are broken down into three announcements: advance, preliminary, and final. After the final revision, GDP is not revised again until the annual benchmark revisions each July. These revisions can be quite large and usually affect the past five years of data. ********** 08/07/09 10:00 GMT Industrial Production mm 0.4% -1.9% May Country: Germany Source: Federal Reserve. Raw Data Available At: http://www.federalreserve.gov/releases/G17/Current/g17.txt Release Time: 9:15 ET around the 15th of the month (data for month prior). The index of Industrial Production is a fixed-weight measure of the physical output of the nation's factories, mines, and utilities. Manufacturing production, the largest component of the total, can be accurately predicted using total manufacturing hours worked from the employment report. One of the bigger wildcards in this report is utility production, which can be quite volatile due to swings in the weather. Severe hot or cold spells can boost production as increased heating/cooling needs drive utility production up. In addition to production, this monthly report also provides a measure of capacity utilization. Though the rate of capacity utilization is seen as a critical gauge of the slack available in the economy, the market does not completely trust this measure. Capacity is very difficult to measure, and the Fed essentially assumes that growth in capacity in any given year follows a straight line. One can therefore predict the capacity utilization rate quite accurately based on the assumption for production growth. The 85% mark is seen as a key barrier over which inflationary pressures are generated, but given revisions to these data and the difficulties with capacity measurement, the 85% mark should be viewed cautiously. It would be appropriate to look for corroborating inflation indications from commodity prices and vendor deliveries. ********** 08/07/09 12:15 GMT Housing Starts yy 128.4k Jun Country: Canada Source: The Census Bureau of the Department of Commerce. Raw Data Available At: http://www.census.gov/const/www/newresconstindex.html Release Time: 8:30 ET around the 16th of the month (data for one month prior). Housing Starts are a measure of the number of residential units on which construction is begun each month. A start in construction is defined as the beginning of excavation of the foundation for the building and is comprised primarily of residential housing. Building permits are permits taken out in order to allow excavation. An increase in building permits and starts usually occurs a few months after a reduction in mortgage rates. Permits lead starts, but permits are not required in all regions of the country, and the level of permits therefore tends to be less than the level of starts over time. The monthly national report is broken down by region: Northeast, Midwest, South, and West. Briefing recommends analyzing the regional data because they are subject to a high degree of volatility. The high volatility can be attributed to weather changes and/or natural disasters. For example, an unexpectedly high level of rain in South could delay housing starts for the region. ********** 08/07/09 19:00 GMT Consumer Credit mm -10.0b -15.68b May Country: US Source: Federal Reserve. Raw Data Available At: http://www.census.gov/const/www/c30index.html Release Time: 15:00 ET on the fifth business day of the month (data for two months prior). This monthly measure of consumer debt is volatile and subject to massive revisions. It is also released well after every other consumer spending indicator, including weekly chain store sales, auto sales, consumer confidence, retail sales, and personal consumption. For these reasons, the market almost never reacts to the consumer credit report. Consumer credit is broken down into three categories: auto, revolving (ie, credit card), and other. Since we already have indications on total consumer spending well before this release, there is little to be gained from learning what portion of spending was financed through acquisition of debt. Periods of strong spending can be accompanied by relatively weak credit growth and vice versa, so this measure fails even as a coincident or lagging indicator. ********** 09/07/09 01:30 GMT Unemployment Rate 5.7% Jun Country: Australia Source: Bureau of Labor Statistics, U.S. Department of Labor. Raw Data Available At: http://stats.bls.gov/news.release/empsit.toc.htm Release Time: First Friday of the month at 8:30 ET for the prior month. In Brief The employment report is actually two separate reports which are the results of two separate surveys. The household survey is a survey of roughly 60,000 households. This survey produces the unemployment rate. The establishment survey is a survey of 375,000 businesses. This survey produces the nonfarm payrolls, average workweek, and average hourly earnings figures, to name a few. Both surveys cover the payroll period which includes the 12th of each month. The reports both measure employment levels, just from different angles. Due to the vastly different size of the survey samples (the establishment survey not only surveys more businesses, but each business employs many individuals), the measures of employment may differ markedly from month to month. The household survey is used only for the unemployment measure - the market focusses primarily on the more comprehensive establishment survey. Together, these two surveys make up the employment report, the most timely and broad indicator of economic activity released each month. Total payrolls are broken down into sectors such as manufacturing, mining, construction, services, and government. The markets follows these components closely as indicators of the trends in sectors of the economy; the manufacturing sector is watched the most closely as it often leads the business cycle. The data also include breakdowns of hours worked, overtime, and average hourly earnings. The average workweek (also known as hours worked) is important for two reasons. First, it is a critical determinant of such monthly indicators as industrial production and personal income. Second, it is considered a useful indicator of labor market conditions: a rising workweek early in the business cycle may be the first indication that employers are preparing to boost their payrolls, while late in the cycle a rising workweek may indicate that employers are having difficulty finding qualified applicants for open positions. Average earnings are closely followed as an indicator of potential inflation. Like the price of any good or service, the price of labor reacts to an overly accommodative monetary policy. If the price of labor is rising sharply, it may be an indication that too much money is chasing too few goods, or in this case employees. In Depth The employment report is really two reports - the household survey and the establishment survey. These two surveys contain a wealth of timely information which justify this report's status as the most important economic release of the month. This same wealth of information can nevertheless turn into a dearth of knowledge if it is not placed in the proper context. Household and Establishment Surveys The household and establishment surveys differ due to the source of the data, as the names suggest. The household survey is a survey of households and the establishment survey is a surveys of businesses. The establishment survey, which is sometimes referred to as the payrolls survey, is favored by the market for a simple reason - it is far more comprehensive. Both surveys attempt to measure employment conditions at the roughly the same point in time - the household survey covers the calendar week which includes the 12th of the month while the establishment survey covers the pay period (be it a week, two weeks, or longer) which includes the 12th. But the establishment survey covers 390,000 businesses which employ 47 million people, while the household survey covers just 50,000 individuals. With a sample size which is 940 times larger than the household survey, it is hardly surprising that the market is more interested in the establishment survey. Aside from the sample size, the surveys differ in other significant ways. The household survey counts farm workers, the self-employed, unpaid family workers, and private household workers as employed; the establishment survey does not. The household survey can only count one individual as employed once, even if that person holds two jobs. The establishment survey will double count an individual who appears on the payrolls of two companies. There are other, less significant differences, but let's turn now to the statistics produced by the two surveys. The Household Survey The Unemployment Rate As we noted earlier, the household survey is not nearly as reliable as the establishment survey due to the small size of the survey sample. This survey nevertheless receives attention, primarily because it is responsible for the one figure which is guaranteed to lead the nightly news - the unemployment rate. The unemployment rate demands little explanation, though it is worth noting that the rate can occasionally sees significant monthly changes which are due to flukes in the data. The rate is simply the result of dividing the number of people unemployed (labor force less employed) by the number of people in the labor force. The problem is that the employment and labor force measures in the household survey are far more volatile than even nonfarm payrolls. The reason, of course, is the small survey sample size. It is therefore useful to look at the labor force and employment figures themselves to determine if changes in the unemployment rate are due to aberrant swings in one or both of these series. Beyond the basics of tallying up the labor force and employment, the household survey breaks down these totals in every way imaginable - by gender, race, age, type of job, duration of unemployment, and on and on. These breakdowns seldom are of interest to the financial markets. Perhaps the only two exceptions are the discouraged worker and part-time worker measures. Discouraged Workers Discouraged workers are people who have dropped out of the labor force because they have become discouraged about their job prospects. During hard times, this statistic is often watched alongside the unemployment rate. If the job situation gets exceptionally bleak, it is possible to see the unemployment rate remaining stable not because people are finding jobs, but because they have given up looking and dropped out of the labor force. Part-Time Workers The issue of part time employment has arisen in recent years as many analysts have argued that strong payroll growth reflected the increase in the number of workers holding multiple part-time jobs. Since the payroll data do not differentiate between full and part-time workers, it is possible that a sudden surge in part-time employment which reflected poor full-time job prospects would actually boost payroll growth. In reality, it does not appear that this has happened, as part-time employment has been relatively steady in recent years. This figure nevertheless receives attention from time to time. The Big Picture Given the wealth of data contained in the employment report, it is important to take all of these indicators into account when passing judgment on the report. Looking at payrolls along is often misleading, as the workweek, earnings, and household employment measures may be telling a different story. Taken together, however, and taken with the caveats concerning monthly volatility and revisions, the employment report offers the best monthly glimpse of the economy. ********** 09/07/09 01:30 GMT Non-Farm Payroll -1700 Jun Country: Australia Source: Bureau of Labor Statistics, U.S. Department of Labor. Raw Data Available At: http://stats.bls.gov/news.release/empsit.toc.htm Release Time: First Friday of the month at 8:30 ET for the prior month. In Brief The employment report is actually two separate reports which are the results of two separate surveys. The household survey is a survey of roughly 60,000 households. This survey produces the unemployment rate. The establishment survey is a survey of 375,000 businesses. This survey produces the nonfarm payrolls, average workweek, and average hourly earnings figures, to name a few. Both surveys cover the payroll period which includes the 12th of each month. The reports both measure employment levels, just from different angles. Due to the vastly different size of the survey samples (the establishment survey not only surveys more businesses, but each business employs many individuals), the measures of employment may differ markedly from month to month. The household survey is used only for the unemployment measure - the market focusses primarily on the more comprehensive establishment survey. Together, these two surveys make up the employment report, the most timely and broad indicator of economic activity released each month. Total payrolls are broken down into sectors such as manufacturing, mining, construction, services, and government. The markets follows these components closely as indicators of the trends in sectors of the economy; the manufacturing sector is watched the most closely as it often leads the business cycle. The data also include breakdowns of hours worked, overtime, and average hourly earnings. The average workweek (also known as hours worked) is important for two reasons. First, it is a critical determinant of such monthly indicators as industrial production and personal income. Second, it is considered a useful indicator of labor market conditions: a rising workweek early in the business cycle may be the first indication that employers are preparing to boost their payrolls, while late in the cycle a rising workweek may indicate that employers are having difficulty finding qualified applicants for open positions. Average earnings are closely followed as an indicator of potential inflation. Like the price of any good or service, the price of labor reacts to an overly accommodative monetary policy. If the price of labor is rising sharply, it may be an indication that too much money is chasing too few goods, or in this case employees. In Depth The employment report is really two reports - the household survey and the establishment survey. These two surveys contain a wealth of timely information which justify this report's status as the most important economic release of the month. This same wealth of information can nevertheless turn into a dearth of knowledge if it is not placed in the proper context. Household and Establishment Surveys The household and establishment surveys differ due to the source of the data, as the names suggest. The household survey is a survey of households and the establishment survey is a surveys of businesses. The establishment survey, which is sometimes referred to as the payrolls survey, is favored by the market for a simple reason - it is far more comprehensive. Both surveys attempt to measure employment conditions at the roughly the same point in time - the household survey covers the calendar week which includes the 12th of the month while the establishment survey covers the pay period (be it a week, two weeks, or longer) which includes the 12th. But the establishment survey covers 390,000 businesses which employ 47 million people, while the household survey covers just 50,000 individuals. With a sample size which is 940 times larger than the household survey, it is hardly surprising that the market is more interested in the establishment survey. Aside from the sample size, the surveys differ in other significant ways. The household survey counts farm workers, the self-employed, unpaid family workers, and private household workers as employed; the establishment survey does not. The household survey can only count one individual as employed once, even if that person holds two jobs. The establishment survey will double count an individual who appears on the payrolls of two companies. There are other, less significant differences, but let's turn now to the statistics produced by the two surveys. The Establishment Survey Nonfarm Payrolls Without question, the single most important piece of data contained in the employment report generally and the establishment survey specifically is nonfarm payrolls. As the name implies, nonfarm payrolls measure the number of people on the payrolls of all non-agricultural businesses. The monthly changes in payrolls can be quite volatile, occasionally varying by better than 200K from one month to the next. Even with this volatility and the possibility of large revisions to past data, the payrolls figures offer the most timely and comprehensive snapshot of the economy. Average Workweek The workweek, also referred to as hours worked, is an often underrated indicator in the establishment survey. The average number of hours worked by employees on nonfarm payrolls is an important determinant of both industrial production and personal income in any given month. The workweek typically sees changes of a tenth or two each month, but can see much larger swings, such as the four tenth decline reported for October. To understand the importance of these changes in the workweek, note that a one tenth decline in the average workweek of 120 mln workers (roughly the current level of employment) results in 12 mln fewer hours worked. To create a similar decline in manhours through a change in employment, payrolls would have to fall 340K. For the purposes of production and income calculations, a one tenth of an hour change in the workweek is equivalent to a 340K change in employment. Needless to say, the workweek data are therefore critical in judging the overall strength or weakness of the employment report. Aggregate Hours Worked The aggregate hours worked index simply brings together the two series we just noted. By calculating an index which looks at both employment and the workweek, we get a complete picture of the total hours worked each month. This indicator is seen as a monthly proxy for GDP. By definition, the quarterly change in the amount of goods produced is equal to the change in manhours plus the change in productivity. As productivity is somewhat predictable from quarter to quarter, the aggregate hours worked index provides a helpful monthly read on the overall economy. Average Hourly Earnings The last indicator from the establishment survey which is worthy of close inspection is average hourly earnings, which is important for two reasons. Alongside total manhours, the average earnings figure gives us a good indication of personal income growth during the month. Second, the earnings figures are closely watched during periods of strong economic growth for evidence of increasing wage pressures. Such has certainly been the case over the past year, as the market's reaction to the employment data has often turned on the change in hourly earnings and its implications for the inflation outlook. ********** 09/07/09 06:00 GMT Consumer Price Index (CPI) mm 0.4% -0.1% Jun Country: Germany Source: Bureau of Labor statistics, U.S. Department of Labor. Raw Data Available At: http://stats.bls.gov/news.release/cpi.toc.htm Release Time: 8:30 ET, about the 13th of each month for the prior month. The Consumer Price Index is a measure of the price level of a fixed market basket of goods and services purchased by consumers. CPI is the most widely cited inflation indicator, and it is used to calculate cost of living adjustments for government programs and it is the basis of COLAs for many private labor agreements as well. It has been criticized for overstating inflation, because it does not adjust for substitution effects and because the fixed basket does not reflect price changes in new technology goods which are often declining in price. Despite these criticisms, it remains the benchmark inflation index. ********** 09/07/09 06:00 GMT Consumer Price Index (CPI) yy 0.1% 0.0% Jun Country: Germany Source: Bureau of Labor statistics, U.S. Department of Labor. Raw Data Available At: http://stats.bls.gov/news.release/cpi.toc.htm Release Time: 8:30 ET, about the 13th of each month for the prior month. The Consumer Price Index is a measure of the price level of a fixed market basket of goods and services purchased by consumers. CPI is the most widely cited inflation indicator, and it is used to calculate cost of living adjustments for government programs and it is the basis of COLAs for many private labor agreements as well. It has been criticized for overstating inflation, because it does not adjust for substitution effects and because the fixed basket does not reflect price changes in new technology goods which are often declining in price. Despite these criticisms, it remains the benchmark inflation index. ********** 09/07/09 06:00 GMT Export mm 1.5% -4.8% May Country: Germany Source: The Census Bureau and the Bureau of Economic Analysis of the Department of Commerce. Raw Data Available At: http://www.census.gov/foreign-trade/www/press.html Release Time: 8:30 ET around the 20th of the month (data for two months prior). The trade report is most widely watched for trends in the overall trade balance. But trends in both exports and imports of goods and services bear watching as well. The export data in particular are important to watch for indications that a strengthening competitive position at home and/or strengthening economies overseas are boosting U.S. growth. Imports provide an indication of domestic demand, but given the severe lag of this report relative to other consumption indicators, it is not particularly valuable for this purpose. The volatility in the monthly trade balance can play an important role in GDP forecasts. Net exports are a relatively volatile component of GDP, and the trade report provides the only early clues to the net export performance each quarter. ********** 09/07/09 06:00 GMT Harm. Index of Consumer Prices mm 0.4% - 0.1% Jun Country: Germany Source: EU Eurostat. Raw Data Available At: ttp://europa.eu.int/comm/eurostat/ HICP is the inflation indicator used by the European Central Bank: The method for calculating the CPI varies in different countries and can cause problems for international comparisons. To address this problem, a harmonized index of consumer prices (HICP) have been developed within EU, based on coordinated methodology. HICP is a fundamental indicator for the European Central Bank (ECB) in evaluating EMU's monetary policy goals. HICP is also used to follow up the convergence criteria for price stability with regards to membership in EMU. 1996 is the base year and the index is calculated starting in 1995. Certain entries that are currently treated particularly differently in the calculation of national CPIs have been excluded. One particular difference compared with the CPI is that interest costs for owner-occupied homes are not included in the HICP. In addition, certain costs of owner-occupied homes (repairs, real-estate taxes, write-offs, insurance and ground rents), fees for tenant-owned flats, as well as lotteries, pools and tote betting are excluded. Some entries are included in the HICP but not in the CPI. These include childcare, elder care, hospital care and certain financial services (services where the fee is proportional to the size of the transaction). HICP is based on a completely harmonized product classification, COICOP (Classification Of Individual Consumption by Purpose). Harmonized rules for coverage, consideration of new products, updating the product sample, adjustments for changes in quality, and index formulas for the calculations are also used in calculating the HICP. The methods for calculating the index numbers and price changes for the HICP differ to a certain extent from the CPI. Similar to the CPI, the HICP is a chained index with yearly links but a long-term index is not calculated. Instead, yearly links in the HICP are calculated in the same way as the CPI's short-term index. ********** 09/07/09 06:00 GMT Harm. Index of Consumer Prices yy 0.0% 0.0% Jun Country: Germany Source: EU Eurostat. Raw Data Available At: ttp://europa.eu.int/comm/eurostat/ HICP is the inflation indicator used by the European Central Bank: The method for calculating the CPI varies in different countries and can cause problems for international comparisons. To address this problem, a harmonized index of consumer prices (HICP) have been developed within EU, based on coordinated methodology. HICP is a fundamental indicator for the European Central Bank (ECB) in evaluating EMU's monetary policy goals. HICP is also used to follow up the convergence criteria for price stability with regards to membership in EMU. 1996 is the base year and the index is calculated starting in 1995. Certain entries that are currently treated particularly differently in the calculation of national CPIs have been excluded. One particular difference compared with the CPI is that interest costs for owner-occupied homes are not included in the HICP. In addition, certain costs of owner-occupied homes (repairs, real-estate taxes, write-offs, insurance and ground rents), fees for tenant-owned flats, as well as lotteries, pools and tote betting are excluded. Some entries are included in the HICP but not in the CPI. These include childcare, elder care, hospital care and certain financial services (services where the fee is proportional to the size of the transaction). HICP is based on a completely harmonized product classification, COICOP (Classification Of Individual Consumption by Purpose). Harmonized rules for coverage, consideration of new products, updating the product sample, adjustments for changes in quality, and index formulas for the calculations are also used in calculating the HICP. The methods for calculating the index numbers and price changes for the HICP differ to a certain extent from the CPI. Similar to the CPI, the HICP is a chained index with yearly links but a long-term index is not calculated. Instead, yearly links in the HICP are calculated in the same way as the CPI's short-term index. ********** 09/07/09 06:00 GMT Import mm 0.8% -5.8% May Country: Germany Source: The Census Bureau and the Bureau of Economic Analysis of the Department of Commerce. Raw Data Available At: http://www.census.gov/foreign-trade/www/press.html Release Time: 8:30 ET around the 20th of the month (data for two months prior). The trade report is most widely watched for trends in the overall trade balance. But trends in both exports and imports of goods and services bear watching as well. The export data in particular are important to watch for indications that a strengthening competitive position at home and/or strengthening economies overseas are boosting U.S. growth. Imports provide an indication of domestic demand, but given the severe lag of this report relative to other consumption indicators, it is not particularly valuable for this purpose. The volatility in the monthly trade balance can play an important role in GDP forecasts. Net exports are a relatively volatile component of GDP, and the trade report provides the only early clues to the net export performance each quarter. ********** 09/07/09 08:30 GMT International Trade Balance mm -6.65b - 7.00b May Country: UK Source: The Census Bureau and the Bureau of Economic Analysis of the Department of Commerce. Raw Data Available At: http://www.census.gov/foreign-trade/www/press.html Release Time: 8:30 ET around the 20th of the month (data for two months prior). The trade report is most widely watched for trends in the overall trade balance. But trends in both exports and imports of goods and services bear watching as well. The export data in particular are important to watch for indications that a strengthening competitive position at home and/or strengthening economies overseas are boosting U.S. growth. Imports provide an indication of domestic demand, but given the severe lag of this report relative to other consumption indicators, it is not particularly valuable for this purpose. The volatility in the monthly trade balance can play an important role in GDP forecasts. Net exports are a relatively volatile component of GDP, and the trade report provides the only early clues to the net export performance each quarter. ********** 09/07/09 11:00 GMT Interest Rate Decision 0.5% 0.5% Jul Country: UK Source (U.S.): The Federal Reserve Open Market Committee - FOMC. Source (World): The Central Bank Monetary Policy Committee - MPC. The Federal Open Market Committee is a twelve-member committee made up of the seven members of the Board of Governors and five Federal Reserve Bank presidents. It meets eight times per year to determine the near-term direction of monetary policy, such as setting guidelines for the purchase and sale of government securities and setting policy relating to System operations in the foreign exchange markets. These changes in monetary policy are now announced immediately after FOMC meetings. Most importantly, the Fed determines interest rate policy at FOMC meetings. Market participants speculate about the possibility of an interest rate change at these meetings, and if the outcome is different from expectations, the impact on the markets can be dramatic and far-reaching. The interest rate set by the Fed the federal funds rate serves as a benchmark for all other rates. A change in the fed funds rate, the lending rate banks charge each other for the use of overnight funds, translates directly through to all other interest rates from Treasury bonds to mortgage loans. It also changes the dynamics of competition for investor dollars: when bonds yield 10 percent, they will attract more money away from stocks then when they only yield 5 percent. The level of interest rates affects the economy­ higher rates tend to slow activity; lower rates stimulate activity, a ripple effect that expands into all sectors of the economy. ********** 09/07/09 12:30 GMT Jobless Claims 4-weeks 610.0k 614.0k L/W Country: US Source:The Employment and Training Administration of the Department of Labor. Raw Data Available At: http://www.dol.gov/opa/media/press/eta/main.htm Release Time: 8:30 ET each Thursday (data for week ended prior Saturday). This survey measures the attitudes and expectations concerning both present and future economic conditions of 500 consumers. The Michigan index is almost identical to the Conference Board Consumer Confidence index, though there are two monthly releases, a preliminary and final reading. Like the Conference Board index, it has two subindexes - expectations and current conditions. The expectations index is a component of the Conference Board's Leading Indicators index. ********** 09/07/09 14:00 GMT Wholsale Inventories -1.1% -1.4% May Country: US ********** 09/07/09 14:00 GMT Wholesale Trade 0.0% -0.4% May Country: US Source: The Census Bureau of the Department of Commerce. Raw Data Available At: http://www.census.gov/svsd/www/mwts.html Release Time: 10:00 ET around the fifth business day of the month (data for two months prior). The wholesale trade report includes sales and inventory statistics from the second stage of the manufacturing process. The sales figures say close to nothing about personal consumption and therefore do not move the market. Wholesale inventories sometimes swing enough to change the aggregate inventory profile (aggregate inventory is the sum of inventory at the manufacturing, wholesale, and retail levels), which may affect the GDP outlook. In that event they can elicit a small market reaction. More often than not, however, this release goes unnoticed except by market economists. ********** 10/07/09 08:30 GMT Core PPI mm 0.2% 0.2% Jun Country: UK Source: Bureau of Labor statistics, U.S. Department of Labor. Raw Data Available At: http://stats.bls.gov/news.release/ppi.toc.htm Release Time: Around the 11th of each month at 8:30 ET for the prior month. The Producer Price Index measures prices of goods at the wholesale level. There are three broad subcategories within PPI: crude, intermediate, and finished. The market tracks the finished goods index most closely, as it represents prices for goods that are ready for sale to the end user. Goods prices at the crude and intermediate stages of production often provide an indication of coming (dis)inflationary pressures, but the closer you get to crude goods, the more that these prices track commodity prices which are already available in traded indexes such as the CRB (Commodity Research Bureau). At all stages of production, the market places more emphasis on the index excluding food and energy, referred to as the core rate. Food and energy prices tend to be quite volatile and obscure trends in the underlying inflation rate. Though the market reaction is determined by the month/month changes, year/year changes are also noted by analysts. The index is not revised on a monthly basis, but annual revisions to seasonal adjustment factors can produce small adjustments to past releases. ********** 10/07/09 08:30 GMT Core PPI yy 1.1% 1.2% Jun Country: UK Source: Bureau of Labor statistics, U.S. Department of Labor. Raw Data Available At: http://stats.bls.gov/news.release/ppi.toc.htm Release Time: Around the 11th of each month at 8:30 GMT ET for the prior month. The Producer Price Index measures prices of goods at the wholesale level. There are three broad subcategories within PPI: crude, intermediate, and finished. The market tracks the finished goods index most closely, as it represents prices for goods that are ready for sale to the end user. Goods prices at the crude and intermediate stages of production often provide an indication of coming (dis)inflationary pressures, but the closer you get to crude goods, the more that these prices track commodity prices which are already available in traded indexes such as the CRB (Commodity Research Bureau). At all stages of production, the market places more emphasis on the index excluding food and energy, referred to as the core rate. Food and energy prices tend to be quite volatile and obscure trends in the underlying inflation rate. Though the market reaction is determined by the month/month changes, year/year changes are also noted by analysts. The index is not revised on a monthly basis, but annual revisions to seasonal adjustment factors can produce small adjustments to past releases. ********** 10/07/09 08:30 GMT Producer Price Index (PPI) mm 0.8% 0.4% Jun Country: UK Source: Bureau of Labor statistics, U.S. Department of Labor. Raw Data Available At: http://stats.bls.gov/news.release/ppi.toc.htm Release Time: Around the 11th of each month at 8:30 ET for the prior month. The Producer Price Index measures prices of goods at the wholesale level. There are three broad subcategories within PPI: crude, intermediate, and finished. The market tracks the finished goods index most closely, as it represents prices for goods that are ready for sale to the end user. Goods prices at the crude and intermediate stages of production often provide an indication of coming (dis)inflationary pressures, but the closer you get to crude goods, the more that these prices track commodity prices which are already available in traded indexes such as the CRB (Commodity Research Bureau). At all stages of production, the market places more emphasis on the index excluding food and energy, referred to as the core rate. Food and energy prices tend to be quite volatile and obscure trends in the underlying inflation rate. Though the market reaction is determined by the month/month changes, year/year changes are also noted by analysts. The index is not revised on a monthly basis, but annual revisions to seasonal adjustment factors can produce small adjustments to past releases. ********** 10/07/09 08:30 GMT Producer Price Index (PPI) yy -12.3% -9.4% Jun Country: UK Source: Bureau of Labor statistics, U.S. Department of Labor. Raw Data Available At: http://stats.bls.gov/news.release/ppi.toc.htm Release Time: Around the 11th of each month at 8:30 ET for the prior month. The Producer Price Index measures prices of goods at the wholesale level. There are three broad subcategories within PPI: crude, intermediate, and finished. The market tracks the finished goods index most closely, as it represents prices for goods that are ready for sale to the end user. Goods prices at the crude and intermediate stages of production often provide an indication of coming (dis)inflationary pressures, but the closer you get to crude goods, the more that these prices track commodity prices which are already available in traded indexes such as the CRB (Commodity Research Bureau). At all stages of production, the market places more emphasis on the index excluding food and energy, referred to as the core rate. Food and energy prices tend to be quite volatile and obscure trends in the underlying inflation rate. Though the market reaction is determined by the month/month changes, year/year changes are also noted by analysts. The index is not revised on a monthly basis, but annual revisions to seasonal adjustment factors can produce small adjustments to past releases. ********** 10/07/09 11:00 GMT Non-Farm Payroll -41.8k Jun Country: Canada Source: Bureau of Labor Statistics, U.S. Department of Labor. Raw Data Available At: http://stats.bls.gov/news.release/empsit.toc.htm Release Time: First Friday of the month at 8:30 ET for the prior month. In Brief The employment report is actually two separate reports which are the results of two separate surveys. The household survey is a survey of roughly 60,000 households. This survey produces the unemployment rate. The establishment survey is a survey of 375,000 businesses. This survey produces the nonfarm payrolls, average workweek, and average hourly earnings figures, to name a few. Both surveys cover the payroll period which includes the 12th of each month. The reports both measure employment levels, just from different angles. Due to the vastly different size of the survey samples (the establishment survey not only surveys more businesses, but each business employs many individuals), the measures of employment may differ markedly from month to month. The household survey is used only for the unemployment measure - the market focusses primarily on the more comprehensive establishment survey. Together, these two surveys make up the employment report, the most timely and broad indicator of economic activity released each month. Total payrolls are broken down into sectors such as manufacturing, mining, construction, services, and government. The markets follows these components closely as indicators of the trends in sectors of the economy; the manufacturing sector is watched the most closely as it often leads the business cycle. The data also include breakdowns of hours worked, overtime, and average hourly earnings. The average workweek (also known as hours worked) is important for two reasons. First, it is a critical determinant of such monthly indicators as industrial production and personal income. Second, it is considered a useful indicator of labor market conditions: a rising workweek early in the business cycle may be the first indication that employers are preparing to boost their payrolls, while late in the cycle a rising workweek may indicate that employers are having difficulty finding qualified applicants for open positions. Average earnings are closely followed as an indicator of potential inflation. Like the price of any good or service, the price of labor reacts to an overly accommodative monetary policy. If the price of labor is rising sharply, it may be an indication that too much money is chasing too few goods, or in this case employees. In Depth The employment report is really two reports - the household survey and the establishment survey. These two surveys contain a wealth of timely information which justify this report's status as the most important economic release of the month. This same wealth of information can nevertheless turn into a dearth of knowledge if it is not placed in the proper context. Household and Establishment Surveys The household and establishment surveys differ due to the source of the data, as the names suggest. The household survey is a survey of households and the establishment survey is a surveys of businesses. The establishment survey, which is sometimes referred to as the payrolls survey, is favored by the market for a simple reason - it is far more comprehensive. Both surveys attempt to measure employment conditions at the roughly the same point in time - the household survey covers the calendar week which includes the 12th of the month while the establishment survey covers the pay period (be it a week, two weeks, or longer) which includes the 12th. But the establishment survey covers 390,000 businesses which employ 47 million people, while the household survey covers just 50,000 individuals. With a sample size which is 940 times larger than the household survey, it is hardly surprising that the market is more interested in the establishment survey. Aside from the sample size, the surveys differ in other significant ways. The household survey counts farm workers, the self-employed, unpaid family workers, and private household workers as employed; the establishment survey does not. The household survey can only count one individual as employed once, even if that person holds two jobs. The establishment survey will double count an individual who appears on the payrolls of two companies. There are other, less significant differences, but let's turn now to the statistics produced by the two surveys. The Establishment Survey Nonfarm Payrolls Without question, the single most important piece of data contained in the employment report generally and the establishment survey specifically is nonfarm payrolls. As the name implies, nonfarm payrolls measure the number of people on the payrolls of all non-agricultural businesses. The monthly changes in payrolls can be quite volatile, occasionally varying by better than 200K from one month to the next. Even with this volatility and the possibility of large revisions to past data, the payrolls figures offer the most timely and comprehensive snapshot of the economy. Average Workweek The workweek, also referred to as hours worked, is an often underrated indicator in the establishment survey. The average number of hours worked by employees on nonfarm payrolls is an important determinant of both industrial production and personal income in any given month. The workweek typically sees changes of a tenth or two each month, but can see much larger swings, such as the four tenth decline reported for October. To understand the importance of these changes in the workweek, note that a one tenth decline in the average workweek of 120 mln workers (roughly the current level of employment) results in 12 mln fewer hours worked. To create a similar decline in manhours through a change in employment, payrolls would have to fall 340K. For the purposes of production and income calculations, a one tenth of an hour change in the workweek is equivalent to a 340K change in employment. Needless to say, the workweek data are therefore critical in judging the overall strength or weakness of the employment report. Aggregate Hours Worked The aggregate hours worked index simply brings together the two series we just noted. By calculating an index which looks at both employment and the workweek, we get a complete picture of the total hours worked each month. This indicator is seen as a monthly proxy for GDP. By definition, the quarterly change in the amount of goods produced is equal to the change in manhours plus the change in productivity. As productivity is somewhat predictable from quarter to quarter, the aggregate hours worked index provides a helpful monthly read on the overall economy. Average Hourly Earnings The last indicator from the establishment survey which is worthy of close inspection is average hourly earnings, which is important for two reasons. Alongside total manhours, the average earnings figure gives us a good indication of personal income growth during the month. Second, the earnings figures are closely watched during periods of strong economic growth for evidence of increasing wage pressures. Such has certainly been the case over the past year, as the market's reaction to the employment data has often turned on the change in hourly earnings and its implications for the inflation outlook. ********** 10/07/09 11:00 GMT Unemployment 8.4% Jun Country: Canada ********** 10/07/09 12:30 GMT Export Prices 0.4% 0.6% Jun Country: US ********** 10/07/09 12:30 GMT Import Prices 1.6% 1.3% Jun Country: US ********** 10/07/09 12:30 GMT International Trade Balance mm -30.0b - 29.16b May Country: US Source: The Census Bureau and the Bureau of Economic Analysis of the Department of Commerce. Raw Data Available At: http://www.census.gov/foreign-trade/www/press.html Release Time: 8:30 GMT ET around the 20th of the month (data for two months prior). The trade report is most widely watched for trends in the overall trade balance. But trends in both exports and imports of goods and services bear watching as well. The export data in particular are important to watch for indications that a strengthening competitive position at home and/or strengthening economies overseas are boosting U.S. growth. Imports provide an indication of domestic demand, but given the severe lag of this report relative to other consumption indicators, it is not particularly valuable for this purpose. The volatility in the monthly trade balance can play an important role in GDP forecasts. Net exports are a relatively volatile component of GDP, and the trade report provides the only early clues to the net export performance each quarter. ********** 10/07/09 12:30 GMT Export mm 30.79b May Country: Canada Source: The Census Bureau and the Bureau of Economic Analysis of the Department of Commerce. Raw Data Available At: http://www.census.gov/foreign-trade/www/press.html Release Time: 8:30 ET around the 20th of the month (data for two months prior). The trade report is most widely watched for trends in the overall trade balance. But trends in both exports and imports of goods and services bear watching as well. The export data in particular are important to watch for indications that a strengthening competitive position at home and/or strengthening economies overseas are boosting U.S. growth. Imports provide an indication of domestic demand, but given the severe lag of this report relative to other consumption indicators, it is not particularly valuable for this purpose. The volatility in the monthly trade balance can play an important role in GDP forecasts. Net exports are a relatively volatile component of GDP, and the trade report provides the only early clues to the net export performance each quarter. ********** 10/07/09 12:30 GMT Import mm 30.96 May Country: Canada Source: The Census Bureau and the Bureau of Economic Analysis of the Department of Commerce. Raw Data Available At: http://www.census.gov/foreign-trade/www/press.html Release Time: 8:30 ET around the 20th of the month (data for two months prior). The trade report is most widely watched for trends in the overall trade balance. But trends in both exports and imports of goods and services bear watching as well. The export data in particular are important to watch for indications that a strengthening competitive position at home and/or strengthening economies overseas are boosting U.S. growth. Imports provide an indication of domestic demand, but given the severe lag of this report relative to other consumption indicators, it is not particularly valuable for this purpose. The volatility in the monthly trade balance can play an important role in GDP forecasts. Net exports are a relatively volatile component of GDP, and the trade report provides the only early clues to the net export performance each quarter. ********** 10/07/09 12:30 GMT House Prices -0.6% May Country: Canada ********** 10/07/09 12:30 GMT International Trade Balance mm -0.18b May Country: Canada Source: The Census Bureau and the Bureau of Economic Analysis of the Department of Commerce. Raw Data Available At: http://www.census.gov/foreign-trade/www/press.html Release Time: 8:30 ET around the 20th of the month (data for two months prior). The trade report is most widely watched for trends in the overall trade balance. But trends in both exports and imports of goods and services bear watching as well. The export data in particular are important to watch for indications that a strengthening competitive position at home and/or strengthening economies overseas are boosting U.S. growth. Imports provide an indication of domestic demand, but given the severe lag of this report relative to other consumption indicators, it is not particularly valuable for this purpose. The volatility in the monthly trade balance can play an important role in GDP forecasts. Net exports are a relatively volatile component of GDP, and the trade report provides the only early clues to the net export performance each quarter. ********** 10/07/09 13:55 GMT U.Michigan Consumer Sentiment 71.0 70.8 Jul Country: US Source: The University of Michigan. Release Time: Preliminary: 10:00 ET on the second Friday of the month (data for current month); Final: 10:00 ET on the fourth Friday of the month (data for current month). This survey measures the attitudes and expectations concerning both present and future economic conditions of 500 consumers. The Michigan index is almost identical to the Conference Board Consumer Confidence index, though there are two monthly releases, a preliminary and final reading. Like the Conference Board index, it has two subindexes - expectations and current conditions. The expectations index is a component of the Conference Board's Leading Indicators index. Consumer spending accounts for two-thirds of the economy, so the markets follow any indicator relating to consumer behavior and attitudes. The more confident consumers are about the economy and their own personal finances, the more likely they are to spend. It is interesting to note that changes in consumer sentiment and retail sales don't move in tandem. Results for the week of: 28/06/2009 - 03/07/2009 28 June 2009 - 3 July 2009 * GMT Time Date Hour Country Data Result Forecast Previous Period 28/06/2009 10:45 PM New Zealand International Trade Balance mm 350.0M 276.0M May 28/06/2009 10:45 PM New Zealand Building Permits 11.2% May 28/06/2009 11:50 PM Japan Retail Sales yy -2.9% May 29/06/2009 8:30 AM U.K. Consumer Credit mm 0.314B May 29/06/2009 9:00 AM Europe Economic Sentiment 69.3 June 29/06/2009 9:00 AM Europe Service Sentiment -23.0 June 29/06/2009 4:00 PM USA Mid-West Mnfg Activity 81.0 May 29/06/2009 11:15 PM Japan Manufacturing PMI 46.6 June 29/06/2009 11:30 PM Japan House hold Spending -1.3% May 29/06/2009 11:30 PM Japan Unemployment Rate 5.0% May 30/06/2009 5:00 AM Japan Construction Orders 25.9%- May 30/06/2009 5:00 AM Japan Housing Starts yy 32.4%- May 30/06/2009 8:00 AM Europe M3 Money Supply yy 4.6% 4.9% May 30/06/2009 8:00 AM Germany Unemployment Rate 8.3% 8.2% June 30/06/2009 8:30 AM U.K. Gross Domestic Product (GDP) qq 1.9%- Quarter 1 30/06/2009 8:30 AM U.K. Gross Domestic Product (GDP) yy 4.1%- Quarter 1 30/06/2009 9:00 AM Europe Harm. Index of Consumer Prices yy -0.2% 0.0% June 30/06/2009 12:30 PM Canada Gross Domestic Product (GDP) mm -0.3% April 30/06/2009 12:30 PM Canada Producer Price Index (PPI) mm -0.5% May 30/06/2009 12:30 PM Canada Producer Price Index (PPI) yy -2.2% May 30/06/2009 1:00 PM USA House Prices -1.9% -2.2% April 30/06/2009 1:45 PM USA Chicago PMI 38.3 34.9 June 30/06/2009 2:00 PM USA Consumer Confidence 57.0 54.9 June 30/06/2009 11:50 PM Japan Tankan Survey -6.9% -6.6% Quarter 2 01/07/2009 Canada Market Holiday 01/07/2009 1:30 AM Australia Building Permits 5.1% May 01/07/2009 1:30 AM Australia Retail Sales mm 0.3% May 01/07/2009 4:30 AM Swiss Manufacturing PMI 39.8 June 01/07/2009 7:55 AM Germany Manufacturing PMI 39.6 June 01/07/2009 8:00 AM Europe Manufacturing PMI 42.4 40.7 June 01/07/2009 12:15 PM USA ADP employment -411K -532K June 01/07/2009 1:10 PM U.K. Services PMI 45.4% June 01/07/2009 2:00 PM USA Manufacturing PMI 44.0 42.8 May 01/07/2009 2:00 PM USA Pending Homes Sales 2.4% 6.7% May 01/07/2009 2:00 PM USA Pending Homes Sales 2.4% 6.7% May 01/07/2009 2:00 PM USA Construction Spending 0.5%- 0.8%- May 02/07/2009 9:00 AM Europe Producer Price Index (PPI) mm 1.0%- May 02/07/2009 9:00 AM Europe Producer Price Index (PPI) yy 4.6%- May 02/07/2009 9:00 AM Europe Unemployment 9.4% 9.2% May 02/07/2009 12:30 PM USA Non-Farm Payroll -368.0K -345.0K June 02/07/2009 12:30 PM USA Unemployment 9.6% 9.4% June 02/07/2009 12:30 PM USA Initial Jobless Claims Last Week 02/07/2009 2:00 PM USA New orders XD 1.4% May 02/07/2009 2:00 PM USA Durable Goods Orders 1.8% May 03/07/2009 USA Market Holiday 03/07/2009 7:15 AM Swiss Consumer Price Index (CPI) mm 0.2% June 03/07/2009 7:15 AM Swiss Consumer Price Index (CPI) yy -1.0% June 03/07/2009 7:55 AM Germany Services PMI 45.2 July 03/07/2009 8:00 AM Europe Services PMI 44.5 44.8 June 03/07/2009 8:00 AM Europe Composite PMI 44.0 June 03/07/2009 8:30 AM U.K. Services PMI 51.7 June 03/07/2009 9:00 AM Europe Retail Sales mm 0.2% May 03/07/2009 9:00 AM Europe Retail Sales yy 2.3%- May Results for the week of: 22/06/2009 - 26/06/2009 22 June 2009 - 26 June 2009 * GMT time Date Hour Country Data Result Forecast Previous Period 22/06/2009 8:00 AM Germany IFO Business Climate: index 85.9 85.2 84.2 June 23/06/2009 6:00 AM Germany GFK Consumer Sentiment 2.5 2.5 July 23/06/2009 6:15 AM Swiss International Trade Balance yy 2551.4m May 23/06/2009 7:25 AM Germany Manufacturing PMI 41.0 39.6 June 23/06/2009 7:25 AM Germany Services PMI 46.0 45.2 June 23/06/2009 7:55 AM Europe Manufacturing PMI 42.3 40.7 June 23/06/2009 7:55 AM Europe Services PMI 45.8 44.8 June 23/06/2009 2:00 PM USA Existing Home Sales (Units) 4.8m 4.68m May 23/06/2009 2:00 PM USA House Prices -1.1% April 23/06/2009 2:00 PM USA Richmond Fed srvs -29 June 23/06/2009 11:50 PM Japan International Trade Balance yy -85.0% May 24/06/2009 USA Building Permits 0.518m May 24/06/2009 2:00 AM New Zealand Consumer Confidence 96 Quarter 2 24/06/2009 8:00 AM Europe Capital Flow 71.1b April 24/06/2009 8:00 AM Europe Current Account -3.5b April 24/06/2009 12:20 PM USA Durable Goods Orders -0.2% 1.7% May 24/06/2009 12:30 PM USA New orders XD 0.4% 0.8% May 24/06/2009 12:30 PM USA New orders XT 0.2% 0.4% May 24/06/2009 2:00 PM USA New Home sales 0.36m 0.352m May 24/06/2009 6:15 PM USA Interest Rate Decision 0.25% 0.25% July 24/06/2009 10:45 PM New Zealand Current Account -1.200b -4.030b Quarter 1 25/06/2009 9:00 AM Europe Factory Orders yy -26.9% April 25/06/2009 9:00 AM Europe Factory Orders mm -0.3% -0.8% April 25/06/2009 12:30 PM USA Initial Jobless Claims 608.0k 25/06/2009 12:30 PM USA Gross Domestic Product (GDP) qq -5.7% -5.7% Quarter 1 25/06/2009 12:30 PM USA Core PCE qq 1.5% 1.5% Quarter 1 25/06/2009 10:45 PM New Zealand Gross Domestic Product (GDP) yy -2.3% -1.9% Quarter 1 25/06/2009 11:30 PM Japan Consumer Price Index (CPI) mm -0.1% May 25/06/2009 11:30 PM Japan Consumer Price Index (CPI) yy -0.1% May 26/06/2009 9:30 AM Swiss KOF Purchasing Manager ind -1.86 June 26/06/2009 12:30 PM USA Core PCE yy 1.9% May 26/06/2009 12:30 PM USA Personal Consumption Exp. mm 0.1% May 26/06/2009 12:30 PM USA Personal Consumption Exp. yy 0.4% May 26/06/2009 12:30 PM USA Core PCE mm 0.2% 0.3% May Results for the week of: 15/06/2009 - 19/06/2009 15 June 2009 - 19 June 2009 * GMT time Date Hour Country Data Result Forecast Previous Period 15/06/2009 Japan Protocol of last interest rate meeting June 15/06/2009 7:15 AM Swiss Producer Price Index (PPI) mm -0.3% 0.2% -0.2% May 15/06/2009 7:15 AM Swiss Producer Price Index (PPI) yy -5% -4.6% -3.6% May 15/06/2009 12:30 PM USA New-York Fed Survey -9.41% -4.5% -4.55 June 15/06/2009 1:00 PM USA Capital Flow -53.2b -23.2 May 16/06/2009 1:00 AM Australia Protocol of last interest rate meeting 16/06/2009 4:00 AM Japan Interest Rate Decision 0.10% 0.10% 16/06/2009 7:15 AM Swiss Factory Orders yy -8.8% Quarter 1 16/06/2009 8:30 AM U.K. Retail Price Index (RPI) yy -1.1% -1.5% -1.2% May 16/06/2009 8:30 AM U.K. RPI ex. Mortgage (RPIX) mm 0.6% 0.3% 0.4% May 16/06/2009 8:30 AM U.K. RPI ex. Mortgage (RPIX) yy 1.6% 1.3% 1.7% May 16/06/2009 8:30 AM U.K. Consumer Price Index (CPI) mm 0.6% 0.3% 0.2% May 16/06/2009 8:30 AM U.K. Consumer Price Index (CPI) yy 2.2% 2% 2.3% May 16/06/2009 8:30 AM U.K. Retail Price Index (RPI) mm 0.6% 0.2% 0.1% May 16/06/2009 9:00 AM Europe Harm. Index of Consumer Prices yy 0% 0.0% 0.6% May 16/06/2009 9:00 AM Europe Core HICP mm 0% -0.1% 0.4% May 16/06/2009 9:00 AM Europe Core HICP yy 1.5% 1.5% 1.7% May 16/06/2009 9:00 AM Europe Harm. Index of Consumer Prices mm 0.1% 0.0% 0.4% May 16/06/2009 9:00 AM Germany ZEW Economic Sentiment 44.8 35 31.1 June 16/06/2009 12:30 PM USA Building Permits 0.518m 0.5m 0.498m May 16/06/2009 12:30 PM USA House Prices 17.2 -12.8% May 16/06/2009 12:30 PM USA Core PPI yy 3.0% 3.2% 3.4% May 16/06/2009 12:30 PM USA Housing Starts yy 0.532m 0.49m 0.458m May 16/06/2009 12:30 PM USA Core PPI mm -0.1% 0.1% 0.1% May 16/06/2009 12:30 PM USA Producer Price Index (PPI) yy -5.0% -3.7% -3.7% May 16/06/2009 12:30 PM USA Producer Price Index (PPI) mm 0.2% 0.6% 0.3% May 16/06/2009 1:15 PM USA Capacity Utilization 68.3% 68.4% 69.1% May 16/06/2009 1:15 PM USA Industrial Production mm -1.1% -0.9% -0.5% May 17/06/2009 12:30 AM Australia Leading Economic Indicators 0.7% 0.4% April 17/06/2009 7:15 AM Swiss Retail Sales yy 1.2% 1.2% April 17/06/2009 8:30 AM U.K. Initial Jobless Claims 39.3k 60.0k 57.1k May 17/06/2009 8:30 AM U.K. ILO Unemployment 7.2% 7.3% 7.1% April 17/06/2009 8:30 AM U.K. Protocol of last interest rate meeting 17/06/2009 9:00 AM Europe International Trade Balance mm 2.7b -1.3b 0.4b April 17/06/2009 9:00 AM Swiss ZEW Economic Sentiment 9.7% -3.9% June 17/06/2009 12:30 PM Canada Leading Economic Indicators -0.1% -0.6% -1.1% May 17/06/2009 12:30 PM Canada Wholesale Trade -0.6% -0.5% -0.6% April 17/06/2009 12:30 PM USA Consumer Price Index (CPI) mm 0.1% 0.3% 0.0% May 17/06/2009 12:30 PM USA Core CPI yy 1.8% 1.8% 1.9% May 17/06/2009 12:30 PM USA Consumer Price Index (CPI) yy -1.3% -0.9% -0.7% May 17/06/2009 12:30 PM USA Current Account -101.5b -85.0b -132.8b Quarter 1 17/06/2009 12:30 PM USA Core CPI mm 0.1% 0.1% 0.3% May 17/06/2009 4:00 PM USA Fed Chairman Bernanke Speaks 17/06/2009 11:30 PM Japan Tankan Survey -50.0 -69.0 June 18/06/2009 7:30 AM Swiss Interest Rate Decision 0.25% 0.25% Quarter 2 18/06/2009 8:30 AM U.K. Consumer Credit mm 19.861b 18.95b 8.468b May 18/06/2009 8:30 AM U.K. Retail Sales mm -0.6% 0.4% 0.9% May 18/06/2009 8:30 AM U.K. Retail Sales yy -1.6% -0.2% 2.6% May 18/06/2009 10:00 AM U.K. CBI Orders -51.0 -45.0 -56.0 June 18/06/2009 11:00 AM Canada Consumer Price Index (CPI) mm 0.7% -0.1% May 18/06/2009 11:00 AM Canada Consumer Price Index (CPI) yy 0.1% 0.4% May 18/06/2009 12:30 PM USA Initial Jobless Claims 608k 600k 601k Last Week 18/06/2009 2:00 PM USA Leading Economic Indicators 1.2% 0.9% 1.0% May 18/06/2009 2:00 PM USA Philadelphia Fed Survey -2.2 -17 -22.6 June 18/06/2009 11:50 PM Japan Protocol of last interest rate meeting May 19/06/2009 6:00 AM Germany Producer Price Index (PPI) mm 0.0% -0.1% -1.4% May 19/06/2009 6:00 AM Germany Producer Price Index (PPI) yy -3.6% -3.6% -2.7% May 19/06/2009 12:30 PM Canada Core Retail Sales mm -0.5% 0.0% -0.2% April 19/06/2009 12:30 PM Canada Retail Sales mm -0.8% 0.1% 0.3% April Results for the week of: 07/06/2009 - 12/06/2009 7 June 2009 - 12 June 2009 Time * GMT Date Hour Country Data Result Forecast Previous Period 07/06/2009 11:50 PM Japan Current Account -39.0% -48.8% April 08/06/2009 5:45 AM Swiss Unemployment Rate 3.5% 3.4% May 08/06/2009 10:00 AM Germany Factory Orders mm 0.0% 3.3% April 08/06/2009 12:15 PM Canada Housing Starts yy 117.4k May 09/06/2009 5:00 AM Japan Leading Economic Indicators 2.1 April 09/06/2009 6:00 AM Germany International Trade Balance mm 9.2b 8.9b April 09/06/2009 10:00 AM Germany Industrial Production mm -0.1% 0.0% April 09/06/2009 2:00 PM USA IBD Consumer Sentiment 48.6 June 09/06/2009 2:00 PM USA Wholsale Inventories -1.0% -1.6% April 09/06/2009 2:00 PM USA Wholesale Trade -2.4% April 09/06/2009 11:50 PM Japan Machinery Orders mm 0.4% -1.3% April 10/06/2009 12:30 AM Australia Consumer Confidence -4.3% June 10/06/2009 6:00 AM Germany Consumer Price Index (CPI) yy 0.0% 0.7% May 10/06/2009 6:00 AM Germany Harm. Index of Consumer Prices mm -0.2% 0.1% May 10/06/2009 6:00 AM Germany Harm. Index of Consumer Prices yy -0.1% 0.8% May 10/06/2009 6:00 AM Germany Consumer Price Index (CPI) mm -0.1% 0.0% May 10/06/2009 8:30 AM U.K. Industrial Production mm -0.2% -0.6% April 10/06/2009 8:30 AM U.K. Industrial Production yy -12.5% -12.4% April 10/06/2009 8:30 AM U.K. International Trade Balance mm -6.4b -6.589b April 10/06/2009 12:30 PM Canada House Prices -0.5% April 10/06/2009 12:30 PM Canada International Trade Balance mm 1.11b April 10/06/2009 12:30 PM USA International Trade Balance mm -29.0b -27.58b April 10/06/2009 6:00 PM USA Fed Beige Book 10/06/2009 6:00 PM USA Budget -195.0b -165.93b May 10/06/2009 9:00 PM New Zealand Interest Rate Decision 2.25% 2.5% 10/06/2009 11:50 PM Japan Gross Domestic Product (GDP) qq -4.0% -4.0% Quarter 1 10/06/2009 11:50 PM Japan Gross Domestic Product (GDP) yy -15.0% -15.2% Quarter 1 11/06/2009 1:30 AM Australia Non-Farm Payroll 27300 May 11/06/2009 1:30 AM Australia Unemployment 5.4% May 11/06/2009 6:00 AM Germany Wholesale Price Index (WPI) mm 0.1% 0.1% May 11/06/2009 6:00 AM Germany Wholesale Price Index (WPI) yy -8.9% -8.1% May 11/06/2009 12:30 PM USA Initial Jobless Claims 621.0k Last Week 11/06/2009 12:30 PM USA Core Retail Sales mm 0.3% -0.5% May 11/06/2009 12:30 PM USA Retail Sales mm 0.2% -0.4% May 11/06/2009 2:00 PM USA Business Inventories -0.8% -1.0% April 11/06/2009 10:45 PM New Zealand Retail Sales mm -0.4% April 11/06/2009 10:45 PM New Zealand Retail Sales yy -1.9% April 11/06/2009 10:45 PM New Zealand Core Retail Sales mm 0.5% April 12/06/2009 5:00 AM Japan CBI Confidence 32.4 May 12/06/2009 9:00 AM Europe Industrial Production mm -0.4% -2.0% April 12/06/2009 9:00 AM Europe Industrial Production yy -19.9 -20.2% April 12/06/2009 12:30 PM USA Export Prices 0.4% 0.5% May 12/06/2009 12:30 PM USA Import Prices 1.0% 1.6% May 12/06/2009 1:55 PM USA U.Michigan Consumer Sentiment 69.9 68.7 June Results for the week of: 1/06/2009 - 05/06/2009 1 June 2009 - 5 June 2009 * GMT time Date Hour Country Data Result Forecast Previous Period 01/06/2009 Swiss Market Holiday 01/06/2009 New Zealand Market Holiday 01/06/2009 1:30 AM Australia Business Inventories -1.2% -1.4% -1.9% Quarter 1 01/06/2009 1:30 AM Australia Retail Sales mm 0.3% 0.5% 2.2% April 01/06/2009 7:50 AM Germany Manufacturing PMI 39.6 39.1 35.4 May 01/06/2009 8:00 AM Europe Manufacturing PMI 40.7 40.5 36.8 May 01/06/2009 8:25 AM U.K. Manufacturing PMI 45.4 44.0 42.9 May 01/06/2009 12:30 PM Canada Producer Price Index (PPI) mm 0.1% 0.3% April 01/06/2009 12:30 PM Canada Producer Price Index (PPI) yy -0.1% April 01/06/2009 12:30 PM Canada Gross Domestic Product (GDP) mm -0.3% -0.1% March 01/06/2009 12:30 PM Canada Gross Domestic Product (GDP) yy -6.6% -3.4% Quarter 1 01/06/2009 12:30 PM Canada Gross Domestic Product (GDP) qq -0.8% Quarter 1 01/06/2009 12:30 PM USA Personal Consumption Exp. mm 0.0% April 01/06/2009 12:30 PM USA Personal Consumption Exp. yy 0.6% April 01/06/2009 12:30 PM USA Personal Income -0.2% -0.3% April 01/06/2009 12:30 PM USA Personal Consumption -0.2% -0.2% April 01/06/2009 12:30 PM USA Core PCE mm 0.2% 0.2% April 01/06/2009 12:30 PM USA Core PCE yy 1.8% April 01/06/2009 2:00 PM USA Construction Spending -1.5% 0.3% April 01/06/2009 2:00 PM USA Manufacturing PMI 42.0 40.1 May 02/06/2009 1:30 AM Australia Building Permits 3.5% April 02/06/2009 4:30 AM Australia Interest Rate Decision 3.00% June 02/06/2009 5:45 AM Swiss Gross Domestic Product (GDP) qq -1.5% -0.3% Quarter 1 02/06/2009 5:45 AM Swiss Gross Domestic Product (GDP) yy -1.7% -0.6% Quarter 1 02/06/2009 7:30 AM Swiss Manufacturing PMI 36.5 34.7 May 02/06/2009 8:30 AM U.K. Consumer Credit mm 0.1b 0.129b April 02/06/2009 9:00 AM Europe Unemployment Rate 9.1% 8.9% April 02/06/2009 2:00 PM USA Pending Homes Sales 0.7% 3.2% April 03/06/2009 1:30 AM Australia Gross Domestic Product (GDP) mm -0.5% Quarter 1 03/06/2009 1:30 AM Australia Gross Domestic Product (GDP) yy 0.3% Quarter 1 03/06/2009 7:50 AM Germany Services PMI 46.0 43.8 May 03/06/2009 8:00 AM Europe Services PMI 44.7 43.8 May 03/06/2009 8:00 AM Europe Manufacturing PMI 43.9 41.4 May 03/06/2009 8:30 AM U.K. Services PMI 49.5 48.7 May 03/06/2009 9:00 AM Europe Gross Domestic Product (GDP) yy -4.6% -1.5% Quarter 1 03/06/2009 9:00 AM Europe Producer Price Index (PPI) mm -0.8% -0.7% April 03/06/2009 9:00 AM Europe Producer Price Index (PPI) yy -4.5% -3.1% April 03/06/2009 9:00 AM Europe Gross Domestic Product (GDP) qq -2.5% -1.6% Quarter 1 03/06/2009 12:15 PM USA ADP employment -550.0K -491.0K May 03/06/2009 2:00 PM USA Durable Goods Orders 1.9% April 03/06/2009 2:00 PM USA New orders XD 1.0% April 03/06/2009 2:00 PM USA Factory Orders mm 0.5% -0.9% April 03/06/2009 2:00 PM USA Manufacturing PMI 45.0 43.7 May 04/06/2009 1:30 AM Australia International Trade Balance mm 2498m April 04/06/2009 9:00 AM Europe Retail Sales mm 0.2% -0.6% April 04/06/2009 9:00 AM Europe Retail Sales yy -3.3% -4.2% April 04/06/2009 11:00 AM U.K. Interest Rate Decision 0.5% 0.5% June 04/06/2009 11:45 AM Europe Interest Rate Decision 1.0% 1.0% June 04/06/2009 12:30 PM Canada Building Permits 23.5% April 04/06/2009 12:30 PM USA Initial Jobless Claims 623.0K Last Week 04/06/2009 12:30 PM USA Productivity and Costs 1.0% 0.8% Quarter 1 04/06/2009 12:45 PM USA Fed Chairman Bernanke Speaks 04/06/2009 1:00 PM Canada Interest Rate Decision 0.25% June 04/06/2009 2:00 PM Canada Services PMI 53.7 April 05/06/2009 7:15 AM Swiss Consumer Price Index (CPI) mm 0.3% 0.9% May 05/06/2009 7:15 AM Swiss Consumer Price Index (CPI) yy -0.9% -0.3% May 05/06/2009 8:30 AM U.K. Producer Price Index (PPI) yy -5.0% May 05/06/2009 8:30 AM U.K. Core PPI mm 0.4% May 05/06/2009 8:30 AM U.K. Core PPI yy 2.4% May 05/06/2009 8:30 AM U.K. Producer Price Index (PPI) mm 0.5% -1.0% May 05/06/2009 11:00 AM Canada Unemployment Rate 8.0% May 05/06/2009 11:00 AM Canada Non-Farm Payroll 35.9k May 05/06/2009 12:30 PM USA Non-Farm Payroll -520.0K -539.0K May 05/06/2009 12:30 PM USA Unemployment Rate 9.2% 8.9% May 05/06/2009 7:00 PM USA Consumer Credit mm -5.0b -11.1b April Results for the week of: 25/05/2009 - 29/05/2009 25 May 2009 - 29 May 2009 * GMT time Date Hour Country Data Result Forecast Previous Period 25/05/2009 12:00 AM U.K. Market Holiday 25/05/2009 12:00 AM USA Market Holiday 25/05/2009 8:00 AM Germany IFO Business Climate: index 85 83.7 May 25/05/2009 10:45 PM New Zealand International Trade Balance mm 386m 324m April 26/05/2009 6:00 AM Germany Gross Domestic Product (GDP) qq -2.1% Quarter 1 26/05/2009 6:00 AM Germany Gross Domestic Product (GDP) yy -1.7% Quarter 1 26/05/2009 6:00 AM Germany GFK Consumer Sentiment 2.5 2.5 June 26/05/2009 7:15 AM Swiss Non-Farm Payroll 3.963m Quarter 1 26/05/2009 8:00 AM Europe Current Account -8.1b March 26/05/2009 8:00 AM Europe Capital Flow 48b March 26/05/2009 9:00 AM Europe Factory Orders mm -0.6% March 26/05/2009 9:00 AM Europe Factory Orders yy -34.5% March 26/05/2009 1:00 PM USA House Prices -18.5% -18.6% March 26/05/2009 2:00 PM USA Consumer Confidence 42 39.2 May 26/05/2009 2:00 PM USA Richmond Fed srvs -29 May 26/05/2009 11:50 PM Japan Protocol of last interest rate meeting 26/05/2009 11:50 PM Japan International Trade Balance mm -53.2b 11b April 27/05/2009 2:00 PM USA Existing Home Sales (Units) 4.65m 4.57m April 27/05/2009 11:50 PM Japan Retail Sales yy -3.3% -3.9% April 28/05/2009 6:15 AM Swiss International Trade Balance mm 120.5m April 28/05/2009 8:00 AM Germany Unemployment Rate 8.4% 8.3% May 28/05/2009 9:00 AM Europe Economic Sentiment 69 67.2 May 28/05/2009 9:00 AM Europe Service Sentiment -23 -24 May 28/05/2009 9:00 AM Europe Industrial Sentiment -33 -35 May 28/05/2009 10:00 AM U.K. CBI Sales -11 3 May 28/05/2009 12:30 PM USA New orders XD -0.6% -0.8% April 28/05/2009 12:30 PM USA New orders XT -0.3% -0.7% April 28/05/2009 12:30 PM USA Durable Goods Orders -0.2% -0.8% April 28/05/2009 12:30 PM USA Initial Jobless Claims 631k Last Week 28/05/2009 2:00 PM USA New Home sales 0.36m 0.356m April 28/05/2009 3:00 PM USA KC Fed -6 May 28/05/2009 4:00 PM USA Mid-West Mnfg Activity 82 April 28/05/2009 11:15 PM Japan Manufacturing PMI 41.4 May 28/05/2009 11:30 PM Japan House hold Spending -0.6% -0.4% April 28/05/2009 11:30 PM Japan Consumer Price Index (CPI) yy -0.1% -0.1% April 28/05/2009 11:30 PM Japan Unemployment Rate 5% 4.8% April 29/05/2009 5:00 AM Japan Housing Starts yy -22.1% -20.7% April 29/05/2009 5:00 AM Japan Construction Orders -37.8 April 29/05/2009 8:00 AM Europe M3 Money Supply yy 5.6% April 29/05/2009 9:00 AM Europe Harm. Index of Consumer Prices yy 0.2% 0.6% May 29/05/2009 9:30 AM Swiss KOF Purchasing Manager ind -1.88 -1.86 May 29/05/2009 12:30 PM Canada Current Account -7.49b Quarter 1 29/05/2009 12:30 PM USA Gross Domestic Product (GDP) qq -5.6% -6.1% Quarter 1 29/05/2009 12:30 PM USA Core PCE qq 1.5% 1.5% Quarter 1 29/05/2009 12:30 PM USA Personal Consumption Exp. qq -1% -1% Quarter 1 29/05/2009 1:45 PM USA Chicago PMI 42 40.1 May Results for the week of: 17/05/2009 - 22/05/2009 17 May 2009 - 22 May 2009 * GMT time Date Hour Country Data Result Forecast Previous Period 17/05/2009 10:45 PM New Zealand Producer Price Index (PPI) yy 0.3% 1.4% Quarter 1 17/05/2009 11:30 PM Japan Tankan Survey -76.0 May 18/05/2009 Canada Market Holiday 18/05/2009 5:00 AM Japan Consumer Confidence 28.4 April 18/05/2009 9:00 AM Europe International Trade Balance mm -2.0 March 18/05/2009 3:30 PM USA Treasury Secretary Speaks 18/05/2009 10:10 PM Australia Reserve Bank of Australia Governor Speech 19/05/2009 1:30 AM Australia Protocol of last interest rate meeting 19/05/2009 2:30 AM Australia Treasury Secretary Speaks 19/05/2009 8:30 AM U.K. Consumer Price Index (CPI) mm 0.2% April 19/05/2009 8:30 AM U.K. Retail Price Index (RPI) yy -0.4% April 19/05/2009 8:30 AM U.K. Consumer Price Index (CPI) yy 2.9% April 19/05/2009 8:30 AM U.K. RPI ex. Mortgage (RPIX) mm 0.2% April 19/05/2009 8:30 AM U.K. Retail Price Index (RPI) mm 0.0% April 19/05/2009 8:30 AM U.K. RPI ex. Mortgage (RPIX) yy 2.2% April 19/05/2009 9:00 AM Germany ZEW Economic Sentiment 18.00 13.00 May 19/05/2009 12:30 PM USA Building Permits 0.52m 0.516m April 19/05/2009 12:30 PM USA Housing Starts yy 0.52m 0.51m April 19/05/2009 11:50 PM Japan Gross Domestic Product (GDP) yy -12.1% Quarter 1 19/05/2009 11:50 PM Japan Gross Domestic Product (GDP) qq -3.2% Quarter 1 20/05/2009 12:30 AM Australia Consumer Confidence 8.3% May 20/05/2009 6:00 AM Germany Producer Price Index (PPI) mm -0.2% -0.7% April 20/05/2009 6:00 AM Germany Producer Price Index (PPI) yy -1.6% -0.5% April 20/05/2009 8:30 AM U.K. Protocol of last interest rate meeting 20/05/2009 9:00 AM Swiss ZEW Economic Sentiment -27.7% May 20/05/2009 10:00 AM U.K. CBI Orders -57.0% May 20/05/2009 11:00 AM Canada Consumer Price Index (CPI) mm 0.2% April 20/05/2009 11:00 AM Canada Consumer Price Index (CPI) yy 1.2% April 20/05/2009 11:00 AM Canada Core CPI mm 0.3% April 20/05/2009 11:00 AM Canada Core CPI yy 2.00% April 20/05/2009 12:30 PM Canada Leading Economic Indicators -1.3% April 20/05/2009 6:00 PM USA Protocol of last interest rate meeting 21/05/2009 Japan Protocol of last interest rate meeting May 21/05/2009 Swiss Market Holiday 21/05/2009 7:28 AM Germany Services PMI 44.1 43.8 May 21/05/2009 7:28 AM Germany Manufacturing PMI 36.00 35.4 May 21/05/2009 7:58 AM Europe Manufacturing PMI 37.4 36.8 May 21/05/2009 7:58 AM Europe Services PMI 44.2 43.8 May 21/05/2009 8:30 AM U.K. Retail Sales mm 0.3% April 21/05/2009 8:30 AM U.K. Retail Sales yy 1.5% April 21/05/2009 12:30 PM Canada Wholesale Trade -0.6% March 21/05/2009 12:30 PM USA Initial Jobless Claims 637k 21/05/2009 2:00 PM USA Leading Economic Indicators 0.3% -0.3% April 21/05/2009 2:00 PM USA Philadelphia Fed Survey -17.2% -24.4% May 22/05/2009 8:30 AM U.K. Gross Domestic Product (GDP) qq -1.9% Quarter 1 22/05/2009 8:30 AM U.K. Gross Domestic Product (GDP) qq -1.9% Quarter 1 22/05/2009 8:30 AM U.K. Gross Domestic Product (GDP) yy -1.4% Quarter 1 22/05/2009 12:30 PM Canada Core Retail Sales mm 0.6% March 22/05/2009 12:30 PM Canada Retail Sales mm 0.2% March 22/05/2009 6:00 PM USA Fed Chairman Bernanke Speaks Results for the week of: 11/05/2009 - 15/05/2009 11 May 2009 - 15 May 2009 * GMT time Date Hour Country Data Result Forecast Previous Period 11/05/2009 1:30 AM Australia Business Confidence -14 -13 April 11/05/2009 12:30 PM Canada House Prices -0.7% March 11/05/2009 11:30 PM USA Fed Chairman Bernanke Speaks 12/05/2009 5:00 AM Japan Leading Economic Indicators -2.0 March 12/05/2009 6:00 AM Germany Consumer Price Index (CPI) mm 0.0% -0.1% April 12/05/2009 6:00 AM Germany Harm. Index of Consumer Prices mm 0.0% -0.2% April 12/05/2009 6:00 AM Germany Wholesale Price Index (WPI) mm -0.9% April 12/05/2009 6:00 AM Germany Wholesale Price Index (WPI) yy -8.0% April 12/05/2009 6:00 AM Germany Harm. Index of Consumer Prices yy 0.7% 0.4% April 12/05/2009 6:00 AM Germany Consumer Price Index (CPI) yy 0.7% 0.5% April 12/05/2009 8:30 AM U.K. International Trade Balance yy -7.2b -7.315b March 12/05/2009 8:30 AM U.K. Industrial Production mm -0.8% -1.0% March 12/05/2009 8:30 AM U.K. Industrial Production yy -12.7% -12.5% March 12/05/2009 12:30 PM Canada International Trade Balance yy 0.126b March 12/05/2009 12:30 PM USA International Trade Balance yy -28.25b -25.97b March 12/05/2009 2:00 PM USA IBD Consumer Sentiment 49.1 May 12/05/2009 6:00 PM USA Budget -18.0b 159.28b April 12/05/2009 11:50 PM Japan Current Account -58.4% -55.6% March 13/05/2009 12:30 AM Australia Consumer Confidence 8.3% May 13/05/2009 8:30 AM U.K. Initial Jobless Claims 78.0k 73.7k April 13/05/2009 8:30 AM U.K. ILO Unemployment 6.9% 6.7% March 13/05/2009 9:00 AM Europe Industrial Production mm -1.0% -2.3% March 13/05/2009 9:00 AM Europe Industrial Production yy -17.0% -18.4% March 13/05/2009 9:30 AM U.K. Bank of England Quarterly Inflation Report 13/05/2009 12:30 PM USA Retail Sales mm 0.2% -1.2% April 13/05/2009 12:30 PM USA Core Retail Sales mm 0.1% -0.9% April 13/05/2009 2:00 PM USA Business Inventories -1.0% -1.3% March 14/05/2009 7:15 AM Swiss Producer Price Index (PPI) mm -0.5% April 14/05/2009 7:15 AM Swiss Producer Price Index (PPI) yy -2.8% April 14/05/2009 12:30 PM USA Initial Jobless Claims 601.0k Last Week 14/05/2009 12:30 PM USA Producer Price Index (PPI) yy -3.5% April 14/05/2009 12:30 PM USA Producer Price Index (PPI) mm 0.2% -1.2% April 14/05/2009 12:30 PM USA Core PPI mm 0.1% 0.0% April 14/05/2009 12:30 PM USA Core PPI yy 3.8% April 14/05/2009 10:45 PM New Zealand Retail Sales mm 0.2% March 14/05/2009 10:45 PM New Zealand Retail Sales yy -6.9% March 14/05/2009 10:45 PM New Zealand Core Retail Sales mm -0.1% March 14/05/2009 11:50 PM Japan Machinery Orders mm -4.5% 1.4% March 15/05/2009 6:00 AM Germany Gross Domestic Product (GDP) yy -5.9% -1.7% Quarter 1 15/05/2009 6:00 AM Germany Gross Domestic Product (GDP) qq -3.1% -2.1% Quarter 1 15/05/2009 7:15 AM Swiss Retail Sales mm -3.8% March 15/05/2009 9:00 AM Europe Harm. Index of Consumer Prices mm 0.4% 0.4% April 15/05/2009 9:00 AM Europe Harm. Index of Consumer Prices yy 0.6% 0.6% April 15/05/2009 9:00 AM Europe Gross Domestic Product (GDP) qq -2.0% -1.6% Quarter 1 15/05/2009 9:00 AM Europe Gross Domestic Product (GDP) yy -4.0% -1.5% Quarter 1 15/05/2009 9:00 AM Europe Core HICP mm 0.3% 0.6% April 15/05/2009 9:00 AM Europe Core HICP yy 1.6% 1.5% April 15/05/2009 12:30 PM USA Core CPI yy 1.8% 1.8% April 15/05/2009 12:30 PM USA Core CPI mm 0.2% 0.2% April 15/05/2009 12:30 PM USA Consumer Price Index (CPI) mm 0.0% -0.1% April 15/05/2009 12:30 PM USA Consumer Price Index (CPI) yy -0.4% -0.4% April 15/05/2009 1:00 PM USA Capital Flow -97.0b March 15/05/2009 1:15 PM USA Capacity Utilization 68.9% 69.3% April 15/05/2009 1:15 PM USA Industrial Production mm -0.7% -1.5% April 15/05/2009 1:55 PM USA U.Michigan Consumer Sentiment 65.1 May Results for the week of: 04/05/2009 - 08/05/2009 4 May 2009 - 8 May 2009 * GMT time 04/05/2009 12:00 AM Japan Market Holiday 04/05/2009 12:00 AM U.K. Market Holiday 04/05/2009 4:30 AM Australia House Prices -0.8% Quarter 1 04/05/2009 6:00 AM Germany Retail Sales mm -0.1% -0.2% March 04/05/2009 6:00 AM Germany Retail Sales yy -3.2% -5.3% March 04/05/2009 7:30 AM Swiss Manufacturing PMI 33.8 32.6 April 04/05/2009 7:50 AM Germany Manufacturing PMI 35.0 32.4 April 04/05/2009 7:55 AM Europe Manufacturing PMI 36.7 33.9 April 04/05/2009 2:00 PM USA Construction Spending -1.4% -0.9% March 04/05/2009 2:00 PM USA Pending Homes Sales -0.4% 2.1% March 05/05/2009 Japan Market Holiday 05/05/2009 5:45 AM Swiss Consumer Confidence -28.0 -23.0 Quarter 2 05/05/2009 7:30 AM Australia Interest Rate Decision 3.0% 3.0% May 05/05/2009 9:00 AM Europe Producer Price Index (PPI) mm -0.5% -0.5% March 05/05/2009 9:00 AM Europe Producer Price Index (PPI) yy -2.9% -1.8% March 05/05/2009 2:00 PM USA Manufacturing PMI 42.0 40.8 April 05/05/2009 2:00 PM USA Fed Chairman Bernanke Speaks 06/05/2009 4:30 AM Australia Retail Sales mm 0.5% -2.0% March 06/05/2009 4:30 AM Australia International Trade Balance mm 1850m 2109m March 06/05/2009 7:55 AM Europe Services PMI 43.1 40.9 April 06/05/2009 7:55 AM Germany Services PMI 43.5 42.3 April 06/05/2009 8:30 AM U.K. Services PMI 46.0 45.5 April 06/05/2009 9:00 AM Europe Retail Sales yy -2.6% -4.0% March 06/05/2009 9:00 AM Europe Retail Sales mm 0.0% -0.6% March 06/05/2009 12:15 PM USA ADP employment -700.0k -742.0k April 06/05/2009 12:30 PM Canada Building Permits -15.9% March 06/05/2009 2:00 PM Canada Manufacturing PMI 43.2 April 07/05/2009 4:30 AM Australia Unemployment Rate 5.9% 5.7% April 07/05/2009 7:15 AM Swiss Consumer Price Index (CPI) mm 0.6% -0.3% April 07/05/2009 7:15 AM Swiss Consumer Price Index (CPI) yy -0.6% -0.4% April 07/05/2009 10:00 AM Germany Factory Orders mm -0.5% -3.5% March 07/05/2009 11:00 AM U.K. Interest Rate Decision 0.5% 0.5% May 07/05/2009 11:45 AM Europe Interest Rate Decision 1.0% 1.25% May 07/05/2009 12:30 PM USA Jobless Claims 4-weeks 631.0k Last Week 07/05/2009 1:30 PM USA Fed Chairman Bernanke Speaks 07/05/2009 7:00 PM USA Consumer Credit mm -2.5b -7.48b March 07/05/2009 11:50 PM Japan Protocol of last interest rate meeting April 08/05/2009 1:30 AM Australia Protocol of last interest rate meeting 08/05/2009 5:45 AM Swiss Unemployment Rate 3.4% 3.3% April 08/05/2009 6:00 AM Germany International Trade Balance mm 8.0b 8.9b March 08/05/2009 8:30 AM U.K. Producer Price Index (PPI) mm 0.2% 0.1% April 08/05/2009 8:30 AM U.K. Producer Price Index (PPI) yy 0.7% 2.0% April 08/05/2009 8:30 AM U.K. Core PPI mm 0.1% 0.2% April 08/05/2009 8:30 AM U.K. Core PPI yy 2.2% 3.3% April 08/05/2009 10:00 AM Germany Industrial Production mm -1.5% -2.9% March 08/05/2009 11:00 AM Canada Non-Farm Payroll -61.3k April 08/05/2009 11:00 AM Canada Unemployment Rate 8.0% April 08/05/2009 12:15 PM Canada Housing Starts yy 154.7k April 08/05/2009 12:30 PM USA Unemployment Rate 8.8% 8.5% April 08/05/2009 12:30 PM USA Non-Farm Payroll -631.0k -663.0k April 08/05/2009 2:00 PM USA Wholesale Trade 0.6% March 08/05/2009 2:00 PM USA Wholsale Inventories -1.0% -1.5% March Results for the week of: 27/04/2009 - 01/05/2009 27 April 2009 - 1 May 2009 * GMT time Date Hour Country Data Result Forecast Previous Period 27/04/2009 6:00 AM Germany GFK Consumer Sentiment 2.3 2.4 May 27/04/2009 4:00 PM USA Mid-West Mnfg Activity 83.8 March 27/04/2009 11:50 PM Japan Retail Sales yy -5.8% March 28/04/2009 10:00 AM U.K. CBI Sales -44.0 April 28/04/2009 1:00 PM USA House Prices -19.1% -19% February 28/04/2009 2:00 PM USA Consumer Confidence 29.0 26.0 April 28/04/2009 2:00 PM USA Richmond Fed srvs -28.0 April 28/04/2009 10:45 PM New Zealand International Trade Balance mm 489.0m March 28/04/2009 10:45 PM New Zealand International Trade Balance yy -5.16b March 29/04/2009 Japan Market Holiday 29/04/2009 8:00 AM Europe M3 Money Supply yy 5.7 5.9 March 29/04/2009 9:00 AM Europe Economic Sentiment 65.2 64.6 April 29/04/2009 9:00 AM Europe Industrial Sentiment -36.0 -38.0 April 29/04/2009 9:00 AM Europe Service Sentiment -25.0 April 29/04/2009 9:30 AM Swiss KOF Purchasing Manager ind -1.79 April 29/04/2009 12:30 PM USA Personal Consumption Exp. qq -1.3% -4.9% Quarter 1 29/04/2009 12:30 PM USA Core PCE qq 1.6% 0.9% Quarter 1 29/04/2009 12:30 PM USA Gross Domestic Product (GDP) qq -5.0% -6.3% Quarter 1 29/04/2009 6:15 PM USA Interest Rate Decision 0% 0% May 29/04/2009 9:00 PM New Zealand Interest Rate Decision 2.5% 3.00% April 29/04/2009 11:15 PM Japan Housing Starts yy -24.9 March 30/04/2009 Japan Interest Rate Decision 0.1% April 30/04/2009 2:15 AM Japan Manufacturing PMI 33.8 April 30/04/2009 5:00 AM Japan Construction Orders -24.9% March 30/04/2009 6:00 AM U.K. House Prices 0.9% April 30/04/2009 8:00 AM Germany Unemployment Rate 8.3% 8.1% April 30/04/2009 9:00 AM Europe Unemployment Rate 8.7% 8.5% March 30/04/2009 12:30 PM Canada Producer Price Index (PPI) mm 0.4% March 30/04/2009 12:30 PM Canada Core PPI yy 1.6% March 30/04/2009 12:30 PM Canada Gross Domestic Product (GDP) mm -0.7% February 30/04/2009 12:30 PM USA Core PCE yy 1.8% March 30/04/2009 12:30 PM USA Initial Jobless Claims 640.0 Last Week 30/04/2009 12:30 PM USA Personal Consumption Exp. mm 0.3% March 30/04/2009 12:30 PM USA Personal Consumption Exp. yy 1.0% March 30/04/2009 12:30 PM USA Personal Income -0.2% -0.2% March 30/04/2009 12:30 PM USA Personal Consumption 0% 0.2% March 30/04/2009 12:30 PM USA Core PCE mm 0.2% 0.2% March 30/04/2009 1:45 PM USA Chicago PMI 34.0 31.4 April 30/04/2009 3:00 PM USA KC Fed -21.0 April 01/05/2009 Germany Market Holiday 01/05/2009 Swiss Market Holiday 01/05/2009 8:28 AM U.K. Manufacturing PMI 39.1 April 01/05/2009 8:30 AM U.K. Consumer Credit mm -0.245b March 01/05/2009 1:55 PM USA U.Michigan Consumer Sentiment 59.9 57.3 April 01/05/2009 2:00 PM USA Durable Goods Orders March 01/05/2009 2:00 PM USA Factory Orders mm -0.8% 1.8% March 01/05/2009 2:00 PM USA New orders XD March 01/05/2009 2:00 PM USA Manufacturing PMI 38 36.3 April 01/05/2009 11:30 PM Japan Consumer Price Index (CPI) yy 0.0% March 01/05/2009 11:30 PM Japan Unemployment Rate 4.4% March 01/05/2009 11:30 PM Japan House hold Spending -3.5% March Results for the week of: 20/04/2009 - 24/04/2009 20 April 2009 - 24 April 2009 * GMT Date Hour Country Data Result Forecast Previous Period 20/04/2009 1:30 AM Australia Producer Price Index (PPI) mm 0.6% 1.3% Quarter 1 20/04/2009 1:30 AM Australia Producer Price Index (PPI) yy 5.0% 6.4% Quarter 1 20/04/2009 2:00 PM USA Leading Economic Indicators -0.2% -0.4% March 21/04/2009 1:30 AM Australia Reserve Bank of Australia Governor Speech 21/04/2009 1:30 AM Australia Protocol of last interest rate meeting 21/04/2009 6:00 AM Germany Producer Price Index (PPI) yy 0.1% 0.9% March 21/04/2009 6:00 AM Germany Producer Price Index (PPI) mm -0.2% -0.5% March 21/04/2009 8:30 AM U.K. Consumer Price Index (CPI) mm 0.2% 0.9% March 21/04/2009 8:30 AM U.K. Consumer Price Index (CPI) yy 2.9% 3.2% March 21/04/2009 8:30 AM U.K. Retail Price Index (RPI) mm -0.2% 0.6% March 21/04/2009 8:30 AM U.K. RPI ex. Mortgage (RPIX) mm 1.0% March 21/04/2009 8:30 AM U.K. Retail Price Index (RPI) yy -0.6% 0.0% March 21/04/2009 8:30 AM U.K. RPI ex. Mortgage (RPIX) yy 2.1% 2.5% March 21/04/2009 9:00 AM Germany ZEW Economic Sentiment 1 -3.5 April 21/04/2009 12:30 PM Canada Wholesale Trade -4.2% February 21/04/2009 1:00 PM Canada Interest Rate Decision 0.5% April 21/04/2009 11:50 PM Japan International Trade Balance mm -5.0b 82.4b March 22/04/2009 1:30 AM Australia Consumer Price Index (CPI) mm 0.5% -0.3% Quarter 1 22/04/2009 1:30 AM Australia Consumer Price Index (CPI) yy 2.8% 3.7% Quarter 1 22/04/2009 8:30 AM U.K. ILO Unemployment 6.7% 6.5% February 22/04/2009 8:30 AM U.K. Protocol of last interest rate meeting 22/04/2009 8:30 AM U.K. Initial Jobless Claims 110.0k 138.4k March 22/04/2009 11:30 AM U.K. Budget 22/04/2009 12:30 PM Canada Leading Economic Indicators -1.1% March 22/04/2009 2:00 PM USA House Prices -6.3% February 23/04/2009 6:15 AM Swiss International Trade Balance mm 719.5m March 23/04/2009 7:28 AM Germany Manufacturing PMI 33 32.4 April 23/04/2009 7:28 AM Germany Services PMI 42.6 42.3 April 23/04/2009 7:55 AM Europe Services PMI 41 40.9 April 23/04/2009 7:58 AM Europe Manufacturing PMI 34.5 33.9 April 23/04/2009 8:00 AM Europe Current Account -12.7b February 23/04/2009 8:00 AM Europe Capital Flow -22.8b February 23/04/2009 8:00 AM U.K. Retail Sales yy 0.9% 0.4% March 23/04/2009 8:00 AM Germany Manufacturing PMI 33.0 32.4 April 23/04/2009 9:00 AM Europe Factory Orders mm -2.3% -3.4% February 23/04/2009 9:00 AM Europe Factory Orders yy -35.0% -34.1% February 23/04/2009 9:00 AM Swiss ZEW Economic Sentiment -57.1 April 23/04/2009 10:00 AM U.K. CBI Orders -58.0% April 23/04/2009 12:30 PM Canada Core Retail Sales mm 1.3% February 23/04/2009 12:30 PM Canada Retail Sales mm 1.9% February 23/04/2009 12:30 PM USA Initial Jobless Claims 610k Last Week 23/04/2009 2:00 PM USA Existing Home Sales (Units) 4.65m 4.72m March 24/04/2009 12:00 AM USA Building Permits -0.9% March 24/04/2009 4:00 AM USA Treasury Secretary Speaks 24/04/2009 8:00 AM Germany IFO Business Climate: index 82.3 82.1 April 24/04/2009 8:30 AM U.K. Gross Domestic Product (GDP) qq -1.4% -1.6% Quarter 1 24/04/2009 8:30 AM U.K. Retail Sales yy 0.9% 0.4% March 24/04/2009 8:30 AM U.K. Gross Domestic Product (GDP) yy -3.7% -2.0% Quarter 1 24/04/2009 8:30 AM U.K. Retail Sales mm -0.5% -1.9% March 24/04/2009 12:30 PM USA New orders XD 1.8% March 24/04/2009 12:30 PM USA Durable Goods Orders -1.4% 3.5% March 24/04/2009 2:00 PM USA New Home sales 0.34m 0.337m March Results for the week of: 13/04/2009 - 17/04/2009 13 April 2009 - 17 April 2009 * GMT time Date Hour Country Data Result Forecast Previous Period 13/04/2009 Australia Market Holiday 13/04/2009 U.K. Market Holiday 13/04/2009 Germany Market Holiday 13/04/2009 Swiss Market Holiday 13/04/2009 New Zealand Market Holiday 13/04/2009 10:45 PM New Zealand Core Retail Sales mm -0.3% -1.1% February 13/04/2009 10:45 PM New Zealand Core Retail Sales yy -4.2% -3.7% February 14/04/2009 1:30 AM Australia Business Confidence -22 March 14/04/2009 12:30 PM USA Core PPI yy 4.0% March 14/04/2009 12:30 PM USA Retail Sales mm 0.4% -0.1% March 14/04/2009 12:30 PM USA Producer Price Index (PPI) yy -1.3% March 14/04/2009 12:30 PM USA Producer Price Index (PPI) mm 0.0% 0.1% March 14/04/2009 12:30 PM USA Core PPI mm 0.1% 0.2% March 14/04/2009 12:30 PM USA Core Retail Sales mm 0.1% 0.7% March 14/04/2009 2:00 PM USA Business Inventories -1.1% -1.1% February 14/04/2009 5:30 PM USA Fed Chairman Bernanke Speaks 15/04/2009 6:00 AM Germany Wholesale Price Index (WPI) mm -0.3% -0.1% March 15/04/2009 6:00 AM Germany Wholesale Price Index (WPI) yy -7.4% -5.7% March 15/04/2009 12:30 PM USA Core CPI mm 0.1% 0.4% March 15/04/2009 12:30 PM USA Core CPI yy 1.7% 1.8% March 15/04/2009 12:30 PM USA Consumer Price Index (CPI) yy -0.1% 0.2% March 15/04/2009 12:30 PM USA New-York Fed Survey -35.0 -38.23 April 15/04/2009 12:30 PM USA Core CPI mm 0.1% 0.2% March 15/04/2009 1:00 PM USA Capital Flow -148.9b February 15/04/2009 1:15 PM USA Capacity Utilization 69.7% 70.2% March 15/04/2009 1:15 PM USA Industrial Production mm -1.0% -1.5% March 15/04/2009 6:00 PM USA Fed Beige Book 15/04/2009 11:30 PM Japan Tankan Survey April 16/04/2009 7:15 AM Swiss Producer Price Index (PPI) mm -0.6% March 16/04/2009 7:15 AM Swiss Producer Price Index (PPI) yy -1.8% March 16/04/2009 9:00 AM Europe Core HICP mm 0.5% 0.4% March 16/04/2009 9:00 AM Europe Core HICP yy 1.3% 1.7% March 16/04/2009 9:00 AM Europe Industrial Production mm -2.4% -3.5% February 16/04/2009 9:00 AM Europe Industrial Production yy -17.5% -17.3% February 16/04/2009 12:30 PM USA Housing Starts yy 0.55m 0.583m March 16/04/2009 12:30 PM USA Building Permits 0.55m 0.564m March 16/04/2009 12:30 PM USA Jobless Claims 4-weeks 655.0k 654.0k Last Week 16/04/2009 2:00 PM USA Philadelphia Fed Survey -32.0 -35.0 April 16/04/2009 10:45 PM New Zealand Consumer Price Index (CPI) mm 0.3% -0.5% 16/04/2009 10:45 PM New Zealand Consumer Price Index (CPI) yy 3.0% 3.4% 17/04/2009 1:30 AM Australia Import Prices -0.2% 10.8% Quarter 1 17/04/2009 1:30 AM Australia Export Prices -4.7% 15.9% Quarter 1 17/04/2009 3:00 AM Japan ECB President Trichet Speaks 17/04/2009 5:00 AM Japan Consumer Confidence 26.7 March 17/04/2009 7:15 AM Swiss Retail Sales mm 1.2% February 17/04/2009 9:00 AM Europe International Trade Balance mm -6.0b -10.5b February 17/04/2009 11:00 AM Canada Consumer Price Index (CPI) mm 0.2% 0.5% March 17/04/2009 11:00 AM Canada Consumer Price Index (CPI) yy 1.9% 1.9% March 17/04/2009 11:00 AM Canada Consumer Price Index (CPI) mm 0.3% 0.7% March 17/04/2009 11:00 AM Canada Consumer Price Index (CPI) yy 1.4% 1.4% March 17/04/2009 1:55 PM USA U.Michigan Consumer Sentiment 58.5 57.3 April 17/04/2009 4:30 PM USA Fed Chairman Bernanke Speaks Results for the week of: 06/04/2009 - 10/04/2009 6 April 2009 - 10 April 2009 * GMT time Date Hour Country Data Result Forecast Previous Period 06/04/2009 5:00 AM Japan Leading Economic Indicators -2.3 February 06/04/2009 9:00 AM Europe Retail Sales yy -2.2% February 06/04/2009 9:00 AM Europe Producer Price Index (PPI) mm -0.5% -0.8% February 06/04/2009 9:00 AM Europe Producer Price Index (PPI) yy -0.9% -0.5% February 06/04/2009 9:00 AM Europe Retail Sales mm -0.5% 0.1% February 06/04/2009 12:30 PM Canada Building Permits -4.6% February 06/04/2009 2:00 PM Canada Services PMI 45.2 March 06/04/2009 4:00 PM USA Mid-West Mnfg Activity 85.6 February 07/04/2009 Japan Interest Rate Decision 0.1% April 07/04/2009 8:30 AM U.K. Industrial Production yy -11.4 February 07/04/2009 8:30 AM U.K. Industrial Production mm -2.6% February 07/04/2009 9:00 AM Europe Gross Domestic Product (GDP) qq -1.5% -0.2% Quarter 4 07/04/2009 9:00 AM Europe Gross Domestic Product (GDP) yy -1.3% 0.6% Quarter 4 07/04/2009 2:00 PM USA IBD Consumer Sentiment 45.3 April 07/04/2009 7:00 PM USA Consumer Credit mm 1.4b 1.76b February 07/04/2009 11:00 PM U.K. Consumer Confidence 43.0 April 07/04/2009 11:50 PM Japan Current Account February 08/04/2009 3:30 AM Australia Consumer Confidence -0.2% April 08/04/2009 6:00 AM Germany International Trade Balance mm 7.5b 8.3b February 08/04/2009 10:00 AM Germany Factory Orders mm -3.0% -8.0% February 08/04/2009 12:15 PM Canada Housing Starts yy 134.6k March 08/04/2009 2:00 PM USA Wholsale Inventories -0.5% -0.9% February 08/04/2009 2:00 PM USA Wholesale Trade -2.2% February 08/04/2009 11:50 PM Japan Machinery Orders mm -3.2% February 09/04/2009 4:30 AM Australia Unemployment 5.2% March 09/04/2009 5:45 AM Swiss Jobless Claims 4-weeks 3.3% 3.1% March 09/04/2009 6:00 AM Germany Harm. Index of Consumer Prices yy 0.4% 1.0% March 09/04/2009 6:00 AM Germany Consumer Price Index (CPI) mm -0.1% 0.6% March 09/04/2009 6:00 AM Germany Consumer Price Index (CPI) yy 0.5% 1.0% March 09/04/2009 6:00 AM Germany Harm. Index of Consumer Prices mm -0.2% 0.7% March 09/04/2009 8:30 AM U.K. Core CPI mm 0.0% March 09/04/2009 8:30 AM U.K. Core CPI yy 3.7% March 09/04/2009 8:30 AM U.K. Producer Price Index (PPI) yy 0.5% March 09/04/2009 8:30 AM U.K. Producer Price Index (PPI) mm 0.6% March 09/04/2009 8:30 AM U.K. Wholesale Trade -7.745 February 09/04/2009 10:00 AM Germany Industrial Production mm -2.3% -7.5% February 09/04/2009 11:00 AM U.K. Interest Rate Decision 0.5% 0.5% April 09/04/2009 11:00 AM Canada Non-Farm Payroll -82.6k March 09/04/2009 11:00 AM Canada Unemployment 7.7% March 09/04/2009 12:30 PM Canada International Trade Balance mm -0.99b February 09/04/2009 12:30 PM Canada House Prices -0.6% February 09/04/2009 12:30 PM USA Import Prices 1.0% -0.2% March 09/04/2009 12:30 PM USA Jobless Claims 4-weeks 669.0k Last Week 09/04/2009 12:30 PM USA Export Prices -0.1% -0.1% March 09/04/2009 12:30 PM USA International Trade Balance mm -37.0b -36.03b February 09/04/2009 11:50 PM Japan Protocol of last interest rate meeting March 10/04/2009 Australia Market Holiday 10/04/2009 Europe Market Holiday 10/04/2009 U.K. Market Holiday 10/04/2009 Canada Market Holiday 10/04/2009 France Market Holiday 10/04/2009 Germany Market Holiday 10/04/2009 USA Market Holiday 10/04/2009 Swiss Market Holiday 10/04/2009 New Zealand Market Holiday Results for the week of: 29/03/2009 - 04/04/2009 29 March 2009 - 4 April 2009 * GMT Date Hour Country Data Result Forecast Previous Period 29/03/2009 11:50 PM Japan Industrial Production mm - prel -10 February 30/03/2009 8:30 AM U.K. Consumer Credit mm 0.403b February 30/03/2009 9:00 AM Europe Economic Sentiment 65.4 March 30/03/2009 9:00 AM Europe Industrial Sentiment -36 March 30/03/2009 9:00 AM Europe Service Sentiment -23 March 30/03/2009 11:15 PM Japan Manufacturing PMI 31.6 March 30/03/2009 11:30 PM Japan Unemployment Rate 4.1% February 30/03/2009 11:30 PM Japan House hold Spending -5.9% February 31/03/2009 5:00 AM Japan Construction Orders -38.3% February 31/03/2009 5:00 AM Japan Housing Starts yy -18.7% February 31/03/2009 8:00 AM Germany Unemployment Rate 7.9% March 31/03/2009 9:00 AM Europe Harm. Index of Consumer Prices yy 0.9% 1.2% March 31/03/2009 12:30 PM Canada Gross Domestic Product (GDP) mm -1% January 31/03/2009 12:30 PM Canada Producer Price Index (PPI) yy 1.2% February 31/03/2009 12:30 PM Canada Producer Price Index (PPI) mm -0.1% February 31/03/2009 1:00 PM USA House Prices -18.6% -18.5% January 31/03/2009 1:45 PM USA Chicago PMI 35 34.2 March 31/03/2009 2:00 PM USA Consumer Confidence 27.5 25 March 31/03/2009 11:50 PM Japan Tankan Survey -0.2% Quarter 1 01/04/2009 7:30 AM Swiss Manufacturing PMI 32.6 March 01/04/2009 7:55 AM Europe Manufacturing PMI 33.5 March 01/04/2009 7:55 AM Germany Manufacturing PMI 32.1 March 01/04/2009 8:30 AM U.K. Manufacturing PMI 34.7 March 01/04/2009 9:00 AM Europe Unemployment Rate 8.2% February 01/04/2009 12:15 PM USA ADP employment -605k -697k March 01/04/2009 2:00 PM USA Construction Spending -2% -3.3% February 01/04/2009 2:00 PM USA Manufacturing PMI 36 35.8 March 01/04/2009 2:00 PM USA Pending Homes Sales -3% -7.7% February 02/04/2009 12:50am JPY Monetary Base y/y 6.8% 6.4% 02/04/2009 1:30am AUD Trade Balance 0.70B 0.97B 02/04/2009 3:00am NZD ANZ Commodity Prices m/m -4.6% 02/04/2009 All Day ALL G20 Meetings 02/04/2009 9:00am CHF Gov Board Member Hildebrand Speaks 02/04/2009 9:30am GBP BOE Credit Conditions Survey 02/04/2009 9:30am GBP Construction PMI 27.6 27.8 02/04/2009 12:45pm EUR Minimum Bid Rate 1.00% 1.50% 02/04/2009 1:30pm EUR ECB Press Conference 02/04/2009 1:30pm USD Unemployment Claims 653K 652K 02/04/2009 3:00pm EUR ECB President Trichet Speaks 02/04/2009 3:00pm USD Factory Orders m/m 1.5% -1.9% 02/04/2009 3:30pm USD Natural Gas Storage 3B 02/04/2009 11:30pm AUD AIG Services Index 32.2 03/04/2009 7:00am EUR German Import Prices m/m -0.3% -0.5% 03/04/2009 8:15am CHF CPI m/m 0.0% 0.2% 03/04/2009 9:00am EUR Final Services PMI 40.1 40.1 03/04/2009 9:30am GBP Services PMI 43.6 43.2 03/04/2009 1:30pm USD Non-Farm Employment Change -656K -651K 03/04/2009 1:30pm USD Unemployment Rate 8.5% 8.1% 03/04/2009 1:30pm USD Average Hourly Earnings m/m 0.2% 0.2% 03/04/2009 3:00pm USD ISM Non-Manufacturing PMI 41.9 41.6 03/04/2009 5:00pm USD Fed Chairman Bernanke Speaks 04/04/2009 3:00pm Daylight Saving Time Shift 04/04/2009 Daylight Saving Time Shift Results for the week of: 23/03/2009 - 27/03/2009 23 March 2009 - 27 March 2009 * GMT time Date Hour Country Data Result Forecast Previous Period 23/03/2009 10:00 AM Europe International Trade Balance mm -8.9b -0.7b January 23/03/2009 12:30 PM Canada Leading Economic Indicators -0.8% February 23/03/2009 2:00 PM USA Existing Home Sales (Units) 4.45m 4.49m February 23/03/2009 11:50 PM Japan Protocol of last interest rate meeting February 24/03/2009 8:58 AM Europe Manufacturing PMI 33.5 March 24/03/2009 8:58 AM Europe Services PMI 39.2 March 24/03/2009 9:30 AM U.K. Retail Price Index (RPI) yy 0.1% February 24/03/2009 9:30 AM U.K. RPI ex. Mortgage (RPIX) mm -0.8% February 24/03/2009 9:30 AM U.K. Consumer Price Index (CPI) mm -0.7% February 24/03/2009 9:30 AM U.K. RPI ex. Mortgage (RPIX) yy 2.4% February 24/03/2009 9:30 AM U.K. Consumer Price Index (CPI) yy 3.0% February 24/03/2009 9:30 AM U.K. Retail Price Index (RPI) mm -1.3% February 24/03/2009 10:00 AM Europe Factory Orders mm -5.2% January 24/03/2009 10:00 AM Europe Factory Orders yy -22.3% January 24/03/2009 2:00 PM USA House Prices -8.7% January 24/03/2009 2:00 PM USA Richmond Fed srvs -28 January 24/03/2009 2:00 PM USA Fed Chairman Bernanke Speaks 24/03/2009 11:50 PM Japan International Trade Balance mm -952.6b February 25/03/2009 7:30 AM Australia Reserve Bank of Australia Governor Speech 25/03/2009 9:00 AM Germany IFO Business Climate: index 82.6 March 25/03/2009 11:00 AM U.K. CBI Sales -25.0 March 25/03/2009 12:30 PM USA New orders XD -2.0% -1.6% February 25/03/2009 12:30 PM USA Durable Goods Orders -2.0% -4.5% February 25/03/2009 2:00 PM USA New Home sales 0.3m 0.309m February 26/03/2009 7:00 AM Germany GFK Consumer Sentiment 2.6 April 26/03/2009 9:30 AM U.K. Retail Sales mm 0.7% February 26/03/2009 9:30 AM U.K. Retail Sales yy 3.6% February 26/03/2009 12:30 PM USA Initial Jobless Claims 26/03/2009 12:30 PM USA Core PCE qq 0.8% 0.8% Quarter 4 26/03/2009 12:30 PM USA Personal Consumption Exp. qq -5.0% -5.0% Quarter 4 26/03/2009 12:30 PM USA Gross Domestic Product (GDP) qq -6.5% -6.2% Quarter 4 26/03/2009 3:00 PM USA KC Fed -24.0 March 26/03/2009 11:30 PM Japan Consumer Price Index (CPI) yy 0.0% February 26/03/2009 11:50 PM Japan Retail Sales yy -2.4% February 27/03/2009 7:00 AM Germany Import Prices February 27/03/2009 9:00 AM Europe M3 Money Supply yy 5.9% February 27/03/2009 9:30 AM U.K. Gross Domestic Product (GDP) yy -1.9% Quarter 4 27/03/2009 9:30 AM U.K. Gross Domestic Product (GDP) qq -1.5% Quarter 4 27/03/2009 9:30 AM U.K. Capital Account -7.723b Quarter 4 27/03/2009 10:30 AM Swiss KOF Purchasing Manager ind -1.41 March 27/03/2009 12:30 PM USA Personal Consumption Exp. yy 0.7% February 27/03/2009 12:30 PM USA Personal Income -0.1% 0.4% February 27/03/2009 12:30 PM USA Consumer Spending 0.6% 0.2% February 27/03/2009 12:30 PM USA Core PCE mm 0.1% 0.1% February 27/03/2009 12:30 PM USA Core CPI yy 1.6% February 27/03/2009 12:30 PM USA Personal Consumption Exp. mm 0.2% February 27/03/2009 1:55 PM USA U.Michigan Consumer Sentiment 56.8 56.3 March Results for the week of: 16/03/2009 - 20/03/2009 16 March 2009 - 20 March 2009 * GMT time Date Hour Country Data Result Forecast Previous Period 16/03/2009 12:10 AM Europe Core HICP yy 1.6% 1.8% February 16/03/2009 12:10 AM Europe Harm. Index of Consumer Prices mm 0.4% -0.8% February 16/03/2009 10:00 AM Europe Harm. Index of Consumer Prices yy 1.2% 1.1% February 16/03/2009 10:00 AM Europe Core HICP mm -1.1% February 16/03/2009 12:30 PM Canada Capacity Utilization 77.4% Quarter 4 16/03/2009 12:30 PM USA New-York Fed Survey -33 -34.65 March 16/03/2009 1:00 PM USA Capital Flow 74b January 16/03/2009 1:15 PM USA Capacity Utilization 71.3% 72% February 16/03/2009 1:15 PM USA Industrial Production mm -1% -1.8% February 17/03/2009 12:30 AM Australia Protocol of last interest rate meeting February 17/03/2009 8:15 AM Swiss Factory Orders yy 3.1% Quarter 4 17/03/2009 10:00 AM Germany ZEW Economic Sentiment -90% -86.2% March 17/03/2009 12:30 PM USA Producer Price Index (PPI) yy -1% February 17/03/2009 12:30 PM USA Core PPI mm 0.1% 0.4% February 17/03/2009 12:30 PM USA Producer Price Index (PPI) mm 0.3% 0.8% February 17/03/2009 12:30 PM USA Core PPI yy 4.2% February 17/03/2009 12:30 PM USA Housing Starts yy 0.46m 0.466m February 17/03/2009 12:30 PM USA Building Permits 0.51m 0.531m February 18/03/2009 Japan Interest Rate Decision 0.1% March 18/03/2009 8:15 AM Swiss Retail Sales mm 3.6% January 18/03/2009 9:30 AM U.K. Initial Jobless Claims 85k 73.8k February 18/03/2009 9:30 AM U.K. Unemployment Rate 6.5% 6.3% January 18/03/2009 9:30 AM U.K. Protocol of last interest rate meeting February 18/03/2009 12:30 PM Canada Wholesale Trade -3.4% January 18/03/2009 12:30 PM USA Core CPI mm 0.1% 0.2% February 18/03/2009 12:30 PM USA Consumer Price Index (CPI) mm 0.3% 0.3% February 18/03/2009 12:30 PM USA Core CPI yy 1.7% 1.7% February 18/03/2009 12:30 PM USA Consumer Price Index (CPI) yy 0.0% 0.0% February 18/03/2009 12:30 PM USA Current Account -136.7b -174.1b Quarter 4 18/03/2009 6:15 PM USA Interest Rate Decision 0% 0% 18/03/2009 11:30 PM Japan Tankan Survey -74 March 19/03/2009 Japan Protocol of last interest rate meeting March 19/03/2009 7:15 AM Swiss International Trade Balance mm 2031.0m February 19/03/2009 10:00 AM Europe Industrial Production mm -4.0% -2.6% January 19/03/2009 10:00 AM Europe Industrial Production yy -15.5% -12.0% January 19/03/2009 10:00 AM Swiss ZEW Economic Sentiment -57.7 March 19/03/2009 11:00 AM U.K. CBI Orders -55 -56 March 19/03/2009 11:00 AM Canada Consumer Price Index (CPI) yy 1.1% February 19/03/2009 11:00 AM Canada Core CPI mm -0.4% February 19/03/2009 11:00 AM Canada Core CPI yy 1.9% February 19/03/2009 11:00 AM Canada Consumer Price Index (CPI) mm -0.3% February 19/03/2009 12:30 PM USA Initial Jobless Claims 654k 19/03/2009 2:00 PM USA Philadelphia Fed Survey -37.8 -41.3 March 19/03/2009 2:00 PM USA Leading Economic Indicators -0.4% 0.4% February 20/03/2009 Japan Market Holiday 20/03/2009 7:00 AM Germany Producer Price Index (PPI) mm -0.2% -1.2% February 20/03/2009 7:00 AM Germany Producer Price Index (PPI) yy 1.4% 2.0% February 20/03/2009 9:00 AM Europe Current Account 1.4b January 20/03/2009 9:00 AM Europe Capital Flow 1.4b January 20/03/2009 12:30 PM Canada Core Retail Sales mm -3.2% January 20/03/2009 12:30 PM Canada Retail Sales mm -5.4% January 20/03/2009 4:00 PM USA Fed Chairman Bernanke Speaks Results for week of 08/03/2009 - 13/03/2009 8 March 2009 - 13 March 2009 * GMT time Date Hour Country Data Result Forecast Previous Period 08/03/2009 11:50 PM Japan Current Account -92.1% January 09/03/2009 6:45 AM Swiss Unemployment Rate 2.9% February 10/03/2009 1:30 AM Australia Consumer Confidence -4.6% March 10/03/2009 5:00 AM Japan Leading Economic Indicators -2.0 January 10/03/2009 7:00 AM Germany Consumer Price Index (CPI) yy 1.0% 0.9% February 10/03/2009 7:00 AM Germany Export mm -4.0% -3.7% January 10/03/2009 7:00 AM Germany Harm. Index of Consumer Prices mm 0.7% -0.6% February 10/03/2009 7:00 AM Germany Harm. Index of Consumer Prices yy 1.0% 0.9% February 10/03/2009 7:00 AM Germany Import mm -4.0% -4.1% January 10/03/2009 7:00 AM Germany Consumer Price Index (CPI) mm 0.6% -0.5% February 10/03/2009 7:00 AM Germany International Trade Balance mm 9.9b 10.7b January 10/03/2009 9:30 AM U.K. Industrial Production mm -1.2% -1.7% January 10/03/2009 9:30 AM U.K. Industrial Production yy -10.0% -9.4% January 10/03/2009 10:00 AM Europe Producer Price Index (PPI) mm -0.2% -1.3% January 10/03/2009 10:00 AM Europe Producer Price Index (PPI) yy 0.6% 1.8% January 10/03/2009 2:00 PM USA Wholsale Inventories -1.0% -1.4% January 10/03/2009 2:00 PM USA Wholesale Trade -3.6% January 11/03/2009 9:30 AM U.K. International Trade Balance mm -7.4b -7.3b January 11/03/2009 11:00 AM Germany Factory Orders mm -2.2% -6.9% January 11/03/2009 12:30 PM Canada House Prices -0.1% January 11/03/2009 6:00 PM USA Budget -200.0b -175.5b February 11/03/2009 10:00 PM New Zealand Interest Rate Decision 3.0% 3.5% March 11/03/2009 11:50 PM Japan Gross Domestic Product (GDP) qq -12.7% -12.7% Quarter 4 12/03/2009 2:30 AM Australia Unemployment Rate 5.0% 4.8% February 12/03/2009 11:00 AM Germany Industrial Production mm -3.0% -4.6% January 12/03/2009 12:30 PM USA Core Retail Sales mm -0.2% 0.9% February 12/03/2009 12:30 PM USA Retail Sales mm -0.4% 1.0% February 12/03/2009 12:30 PM USA Initial Jobless Claims 639.0k Last Week 12/03/2009 2:00 PM USA Business Inventories -1.0% -1.3% January 12/03/2009 11:45 PM New Zealand Retail Sales mm 0.0% -1.0% January 12/03/2009 11:45 PM New Zealand Core Retail Sales mm 0.3% -0.6% January 12/03/2009 11:45 PM New Zealand Retail Sales yy -3.0% -0.9% January 13/03/2009 5:00 AM Japan Consumer Confidence 26.4 February 13/03/2009 8:15 AM Swiss Producer Price Index (PPI) yy -0.9% February 13/03/2009 8:15 AM Swiss Producer Price Index (PPI) mm -0.8% February 13/03/2009 10:00 AM Europe Retail Sales mm 0.2% 0.0% January 13/03/2009 10:00 AM Europe Retail Sales yy -2.3% -1.6% January 13/03/2009 11:00 AM Canada Unemployment Rate 7.2% February 13/03/2009 11:00 AM Canada Non-Farm Payroll -129.0k February 13/03/2009 12:30 PM Canada Export mm 35.3b January 13/03/2009 12:30 PM Canada Import mm 35.7b January 13/03/2009 12:30 PM Canada International Trade Balance mm -0.46b January 13/03/2009 12:30 PM USA International Trade Balance mm -38.2b -39.9b January 13/03/2009 12:30 PM USA Export Prices 0.0% 0.5% February 13/03/2009 12:30 PM USA Import Prices -0.5% -1.1% February 13/03/2009 1:55 PM USA U.Michigan Consumer Sentiment 55.0 56.3 March Results for the week of: 02/03/2009 - 06/03/2009 2 March 2009 - 6 March 2009 * GMT Time Date Hour Country Data Result Forecast Previous Period 02/03/2009 12:30 AM Australia Business Inventories 0.7% Quarter 4 02/03/2009 8:30 AM Swiss Manufacturing PMI 35.0 February 02/03/2009 8:50 AM Germany Manufacturing PMI 32.2 32.0 February 02/03/2009 9:00 AM Europe Manufacturing PMI 33.6 34.4 February 02/03/2009 9:30 AM U.K. Manufacturing PMI 35.8 February 02/03/2009 9:30 AM U.K. Consumer Credit mm 0.297b January 02/03/2009 10:00 AM Europe Harm. Index of Consumer Prices yy 1.0% February 02/03/2009 1:30 PM Canada Gross Domestic Product (GDP) mm -0.7% December 02/03/2009 1:30 PM Canada Gross Domestic Product (GDP) yy 1.3% Quarter 4 02/03/2009 1:30 PM Canada Gross Domestic Product (GDP) qq 0.3% Quarter 4 02/03/2009 1:30 PM USA Personal Consumption 0.3% -1.0% January 02/03/2009 1:30 PM USA Core PCE mm 0.1% 0.0% January 02/03/2009 1:30 PM USA Core PCE yy 1.7% January 02/03/2009 1:30 PM USA Personal Consumption Exp. mm -0.5% January 02/03/2009 1:30 PM USA Personal Consumption Exp. yy 0.6% January 02/03/2009 1:30 PM USA Personal Income -0.2% -0.2% January 02/03/2009 3:00 PM USA Construction Spending -1.4% -1.4% January 02/03/2009 3:00 PM USA Manufacturing PMI 34.3 35.6 March 03/03/2009 12:30 AM Australia Retail Sales mm 3.8% January 03/03/2009 3:30 AM Australia Interest Rate Decision 3.25% March 03/03/2009 6:45 AM Swiss Gross Domestic Product (GDP) qq 0.0% Quarter 4 03/03/2009 6:45 AM Swiss Gross Domestic Product (GDP) yy 1.6% Quarter 4 03/03/2009 10:00 AM Europe Producer Price Index (PPI) mm -1.3% January 03/03/2009 10:00 AM Europe Producer Price Index (PPI) yy 1.8% January 03/03/2009 2:00 PM Canada Interest Rate Decision 1.0% March 03/03/2009 3:00 PM USA Pending Homes Sales -2.8% 6.3% January 03/03/2009 3:00 PM USA Fed Chairman Bernanke Speaks 04/03/2009 12:30 AM Australia Gross Domestic Product (GDP) qq 0.1% Quarter 4 04/03/2009 12:30 AM Australia Gross Domestic Product (GDP) yy 1.9% Quarter 4 04/03/2009 8:55 AM Germany Services PMI 41.6 45.2 February 04/03/2009 9:00 AM Europe Services PMI 38.9 42.2 February 04/03/2009 9:30 AM U.K. Services PMI 42.5 February 04/03/2009 10:00 AM Europe Retail Sales mm 0.0% January 04/03/2009 10:00 AM Europe Retail Sales yy -1.6% January 04/03/2009 1:15 PM USA ADP employment -553.0k -522.0k February 04/03/2009 3:00 PM USA Services PMI 41.0 42.9 February 04/03/2009 7:00 PM USA Fed Beige Book 05/03/2009 12:30 AM Australia International Trade Balance mm 589m January 05/03/2009 12:30 AM Australia Building Permits -2.9% January 05/03/2009 10:00 AM Europe Gross Domestic Product (GDP) qq -0.2% Quarter 4 05/03/2009 10:00 AM Europe Gross Domestic Product (GDP) yy 0.6% Quarter 4 05/03/2009 12:00 PM U.K. Interest Rate Decision 0.5% 1.0% March 05/03/2009 12:45 PM Europe Interest Rate Decision 1.5% 2.0% March 05/03/2009 1:30 PM Canada Building Permits -3.9% January 05/03/2009 1:30 PM USA Initial Jobless Claims 667.0k Last Week 05/03/2009 1:30 PM USA Productivity and Costs 1.6% 3.2% Quarter 4 05/03/2009 3:00 PM Canada Services PMI 36.1 February 05/03/2009 3:00 PM USA Treasury Secretary Speaks 05/03/2009 3:00 PM USA Durable Goods Orders -5.2% January 05/03/2009 3:00 PM USA New orders XD -2.3% January 05/03/2009 3:00 PM USA Factory Orders mm -1.6% -3.9% January 06/03/2009 7:00 AM Germany Producer Price Index (PPI) mm -0.3% -1.0% January 06/03/2009 7:00 AM Germany Producer Price Index (PPI) yy 3.1% 4.3% January 06/03/2009 8:15 AM Swiss Consumer Price Index (CPI) mm -0.8% February 06/03/2009 8:15 AM Swiss Consumer Price Index (CPI) yy 0.1% February 06/03/2009 9:30 AM U.K. Producer Price Index (PPI) mm 1.5% February 06/03/2009 9:30 AM U.K. Producer Price Index (PPI) yy 2.3% February 06/03/2009 9:30 AM U.K. Core PPI mm 0.4% February 06/03/2009 9:30 AM U.K. Core PPI yy 4.1% February 06/03/2009 1:30 PM USA Unemployment Rate 7.9% 7.6% February 06/03/2009 1:30 PM USA Non-Farm Payroll -600.0k -598.0k February 06/03/2009 8:00 PM USA Consumer Credit mm -4.5b -6.6b January Results for the week of: 23/02/2009 - 27/02/2009 23 February 2009 - 27 February 2009 * GMT time Date Hour Country Data Result Forecast Previous Period 23/02/2009 1:30 PM Canada Core Retail Sales mm -2.3% December 23/02/2009 1:30 PM Canada Retail Sales mm -2.4% December 23/02/2009 11:50 PM Japan Protocol of last interest rate meeting January 24/02/2009 8:15 AM Swiss Non-Farm Payroll 3.956m Quarter 4 24/02/2009 9:00 AM Europe Current Account -13.9b December 24/02/2009 9:00 AM Europe Capital Flow 16.7b December 24/02/2009 9:00 AM Germany IFO Business Climate: index 83.3 83.0 February 24/02/2009 10:00 AM Europe Factory Orders mm -4.5% December 24/02/2009 10:00 AM Europe Factory Orders yy -26.2% December 24/02/2009 11:00 AM U.K. CBI Sales -47.0% February 24/02/2009 2:00 PM USA House Prices -2.1% -2.2% December 24/02/2009 3:00 PM USA Consumer Confidence 37.0 37.7 February 24/02/2009 3:00 PM USA Richmond Fed srvs -19.0 February 24/02/2009 3:00 PM USA Fed Chairman Bernanke Speaks 24/02/2009 11:50 PM Japan International Trade Balance yy -1129.5b -320.7b January 25/02/2009 7:00 AM Germany Gross Domestic Product (GDP) qq -0.5% Quarter 4 25/02/2009 7:00 AM Germany Gross Domestic Product (GDP) yy 1.3% Quarter 4 25/02/2009 9:30 AM U.K. Gross Domestic Product (GDP) qq -1.5% Quarter 4 25/02/2009 9:30 AM U.K. Gross Domestic Product (GDP) yy -1.8% Quarter 4 25/02/2009 3:00 PM USA Existing Home Sales (Change) 6.5% January 25/02/2009 3:00 PM USA Fed Chairman Bernanke Speaks 25/02/2009 3:00 PM USA Existing Home Sales (Units) 4.75m 4.74m January 25/02/2009 11:45 PM New Zealand International Trade Balance mm -347.0m January 25/02/2009 11:45 PM New Zealand International Trade Balance yy -5.62b January 26/02/2009 7:00 AM Germany GFK Consumer Sentiment 2.2 2.2 March 26/02/2009 9:00 AM Europe M3 Money Supply yy 6.9% 7.3% January 26/02/2009 9:00 AM Germany Unemployment Rate 7.9% 7.8% February 26/02/2009 10:00 AM Europe Industrial Sentiment -33.0 -34.0 February 26/02/2009 10:00 AM Europe Service Sentiment -22.0 February 26/02/2009 10:00 AM Europe Consumer Confidence -31.0 -31.0 February 26/02/2009 10:00 AM Europe Economic Sentiment 69.5 68.9 February 26/02/2009 1:30 PM USA New orders XD -3.1% -5.3% January 26/02/2009 1:30 PM USA Durable Goods Orders -2.4% -3.0% January 26/02/2009 1:30 PM USA Initial Jobless Claims 627k Last Week 26/02/2009 3:00 PM USA New Home sales 0.33m 0.331m January 26/02/2009 4:00 PM USA Kansas City Fed Survey -25.0 February 26/02/2009 11:15 PM Japan Manufacturing PMI 29.6 February 26/02/2009 11:30 PM Japan House hold Spending -5.5% -4.6% January 26/02/2009 11:30 PM Japan Unemployment Rate 4.6% 4.4% January 26/02/2009 11:30 PM Japan Consumer Price Index (CPI) yy -0.1% 0.2% January 26/02/2009 11:45 PM New Zealand Building Permits -6.0% January 26/02/2009 11:50 PM Japan Industrial Production mm -10.0% -9.8% January 27/02/2009 12:00 AM U.K. GFK Consumer Sentiment -37.0 February 27/02/2009 5:00 AM Japan Construction Orders -27.3% January 27/02/2009 10:00 AM Europe Core HICP yy 2.1% January 27/02/2009 10:00 AM Europe Unemployment 8.0% January 27/02/2009 10:00 AM Europe Core HICP mm 0.4% January 27/02/2009 10:30 AM Swiss KOF Purchasing Manager ind -0.87 February 27/02/2009 1:30 PM Canada Current Account 5.64b Quarter 4 27/02/2009 1:30 PM Canada Core PPI mm -1.9% January 27/02/2009 1:30 PM Canada Core PPI yy 2.5% January 27/02/2009 1:30 PM USA Core PCE qq 0.6% 0.6% Quarter 4 27/02/2009 1:30 PM USA Personal Consumption Exp. qq -5.5% -5.5% Quarter 4 27/02/2009 2:45 PM USA Chicago PMI 33.5 33.3 February Results for the week of: 15/02/2009 - 20/02/2009 15 February 2009 - 20 February 2009 * GMT time Date Hour Country Data Result Forecast Previous Period 15/02/2009 9:45 PM New Zealand Producer Price Index (PPI) mm 0.2% 2.8% Quarter 4 15/02/2009 11:50 PM Japan Gross Domestic Product (GDP) yy -11.7% -1.8% Quarter 4 15/02/2009 11:50 PM Japan Gross Domestic Product (GDP) qq -3.1% -0.5% Quarter 4 16/02/2009 Canada Market Holiday 16/02/2009 USA Market Holiday 16/02/2009 11:30 PM Japan Tankan Survey -76.0 February 17/02/2009 12:30 AM Australia Protocol of last interest rate meeting 17/02/2009 8:15 AM Swiss Retail Sales mm -1.4% December 17/02/2009 9:30 AM U.K. Retail Price Index (RPI) yy 0.9% January 17/02/2009 9:30 AM U.K. Consumer Price Index (CPI) mm -0.4% January 17/02/2009 9:30 AM U.K. RPI ex. Mortgage (RPIX) mm -0.5% January 17/02/2009 9:30 AM U.K. RPI ex. Mortgage (RPIX) yy 2.8% January 17/02/2009 9:30 AM U.K. Consumer Price Index (CPI) yy 3.1% January 17/02/2009 9:30 AM U.K. Retail Price Index (RPI) mm -1.4% January 17/02/2009 10:00 AM Europe International Trade Balance mm -7.0b December 17/02/2009 10:00 AM Germany ZEW Economic Sentiment -83.0 -77.1 February 17/02/2009 1:30 PM USA New-York Fed Survey -21.25 -22.2 February 17/02/2009 2:00 PM USA Capital Flow 56.8b December 18/02/2009 9:30 AM U.K. Protocol of last interest rate meeting 18/02/2009 11:00 AM U.K. CBI Orders -48.0 February 18/02/2009 1:30 PM Canada Wholesale Trade -1.6% December 18/02/2009 1:30 PM USA Building Permits 0.54m 0.547m January 18/02/2009 1:30 PM USA Export Prices -1.2% -2.3% January 18/02/2009 1:30 PM USA Housing Starts yy 0.53m 0.55m January 18/02/2009 1:30 PM USA Import Prices -1.4% -4.2% January 18/02/2009 2:15 PM USA Industrial Production mm -1.3% -2.0% January 18/02/2009 2:15 PM USA Capacity Utilization 72.6% 73.6% January 18/02/2009 5:30 PM USA Fed Chairman Bernanke Speaks 18/02/2009 7:00 PM USA Protocol of last interest rate meeting 19/02/2009 Japan Interest Rate Decision 0.1% February 19/02/2009 7:15 AM Swiss International Trade Balance mm 217.3m January 19/02/2009 10:00 AM Swiss ZEW Economic Sentiment -66.7 February 19/02/2009 1:30 PM Canada Leading Economic Indicators -0.6% January 19/02/2009 1:30 PM USA Producer Price Index (PPI) mm 0.2% -1.9% January 19/02/2009 1:30 PM USA Initial Jobless Claims 623.0k Last Week 19/02/2009 1:30 PM USA Core PPI mm 0.1% 0.2% January 19/02/2009 1:30 PM USA Producer Price Index (PPI) yy -0.9% January 19/02/2009 1:30 PM USA Core PPI yy 4.3% January 19/02/2009 3:00 PM USA Leading Economic Indicators -0.2% 0.3% January 19/02/2009 3:00 PM USA Philadelphia Fed Survey -23.0 -24.3 February 19/02/2009 10:00 PM Australia Reserve Bank of Australia Governor Speech 20/02/2009 8:25 AM Germany Manufacturing PMI 32.6 32.0 February 20/02/2009 8:25 AM Germany Services PMI 45.0 45.2 February 20/02/2009 9:00 AM Europe Manufacturing PMI 35.0 34.4 February 20/02/2009 9:00 AM Europe Services PMI 42.5 42.2 February 20/02/2009 9:30 AM U.K. Retail Sales mm 1.6% January 20/02/2009 9:30 AM U.K. Retail Sales yy 4.0% January 20/02/2009 12:00 PM Canada Core CPI mm -0.4% January 20/02/2009 12:00 PM Canada Consumer Price Index (CPI) yy 1.2% January 20/02/2009 12:00 PM Canada Core CPI yy 2.4% January 20/02/2009 12:00 PM Canada Consumer Price Index (CPI) mm -0.7% January 20/02/2009 1:30 PM USA Core CPI mm 0.1% 0.0% January 20/02/2009 1:30 PM USA Consumer Price Index (CPI) mm 0.1% -0.7% January 20/02/2009 1:30 PM USA Core CPI yy 1.5% 1.8% January 20/02/2009 1:30 PM USA Consumer Price Index (CPI) yy -0.4% 0.1% January Results for the week of: 08/02/2009 - 13/02/2009 8 February 2009 - 13 February 2009 * GMT time Date Hour Country Data Result Forecast Previous Period 08/02/2009 9:45 PM New Zealand Retail Sales yy -4.1% December 08/02/2009 11:50 PM Japan Current Account -78.0% -65.9% December 09/02/2009 7:00 AM Germany Import mm -5.8% -5.6% December 09/02/2009 7:00 AM Germany International Trade Balance mm 10.0b 10.7b December 09/02/2009 7:00 AM Germany Export mm -5.0% -10.6% December 09/02/2009 1:15 PM Canada Housing Starts yy 177.3k January 09/02/2009 11:30 PM Australia Consumer Confidence -2.2% February 10/02/2009 12:30 AM Australia Business Confidence -6.0 January 10/02/2009 5:00 AM Japan Consumer Confidence 26.2 January 10/02/2009 8:15 AM Swiss Consumer Price Index (CPI) yy 0.5% 0.7% January 10/02/2009 8:15 AM Swiss Consumer Price Index (CPI) mm -0.5% -0.5% January 10/02/2009 9:30 AM U.K. International Trade Balance mm -8.1b -8.33b December 10/02/2009 3:00 PM USA IBD Consumer Sentiment 45.4 February 10/02/2009 3:00 PM USA Wholesale Trade -7.1% December 10/02/2009 3:00 PM USA Treasury Secretary Speaks 10/02/2009 3:00 PM USA Wholsale Inventories -0.7% -0.6% December 10/02/2009 6:00 PM USA Fed Chairman Bernanke Speaks 11/02/2009 12:00 AM Japan Market Holiday 11/02/2009 7:00 AM Germany Consumer Price Index (CPI) yy 0.9% 1.1% January 11/02/2009 7:00 AM Germany Harm. Index of Consumer Prices mm -0.5% 0.3 January 11/02/2009 7:00 AM Germany Consumer Price Index (CPI) mm -0.6% 0.4% January 11/02/2009 7:00 AM Germany Harm. Index of Consumer Prices yy 0.9% 1.1% January 11/02/2009 9:30 AM U.K. Initial Jobless Claims 90.0k 77.9k January 11/02/2009 9:30 AM U.K. Unemployment Rate 6.3% 6.1% December 11/02/2009 10:30 AM U.K. Inflation report 11/02/2009 1:30 PM Canada Export mm 39.24b December 11/02/2009 1:30 PM Canada Import mm 37.96b 11/02/2009 1:30 PM Canada House Prices -0.3% December 11/02/2009 1:30 PM Canada International Trade Balance mm 1.28b December 11/02/2009 1:30 PM USA International Trade Balance mm -37.0b -40.44b December 11/02/2009 7:00 PM USA Budget -90.0b 17.84b January 12/02/2009 12:30 AM Australia Non-Farm Payroll -20500 -1200 January 12/02/2009 12:30 AM Australia Unemployment Rate 4.7% 4.5% 12/02/2009 10:00 AM Europe Industrial Production mm -2.1% -1.6% December 12/02/2009 10:00 AM Europe Industrial Production yy -8.8% -7.7% December 12/02/2009 1:30 PM USA Initial Jobless Claims 626.0k Last Week 12/02/2009 1:30 PM USA Core Retail Sales mm -1.1% -3.1% January 12/02/2009 1:30 PM USA Retail Sales mm -1.0% -2.7% January 12/02/2009 3:00 PM USA Business Inventories -0.6% -0.7% December 12/02/2009 9:45 PM New Zealand Core Retail Sales mm 0.3% December 12/02/2009 9:45 PM New Zealand Retail Sales mm 0.0% December 12/02/2009 9:45 PM New Zealand Retail Sales mm 0.0% December 13/02/2009 7:00 AM Germany Gross Domestic Product (GDP) qq -1.8% -0.5% Quarter 4 13/02/2009 7:00 AM Germany Gross Domestic Product (GDP) yy -1.3% 1.3% Quarter 4 13/02/2009 8:15 AM Swiss Producer Price Index (PPI) mm -0.7% January 13/02/2009 10:00 AM Europe Gross Domestic Product (GDP) qq -1.3% -0.2% Quarter 4 13/02/2009 10:00 AM Europe Gross Domestic Product (GDP) yy -1.1% 0.6% Quarter 4 13/02/2009 2:55 PM USA U.Michigan Consumer Sentiment 61.5 61.2 February Results for the week of: 02/02/2009 - 06/02/2009 2 February 2009 - 6 February 2009 * GMT Time Date Hour Country Data Result Forecast Previous Period 02/02/2009 12:30 AM Australia House Prices -1.0% -1.8% Quarter 4 02/02/2009 8:30 AM Swiss Manufacturing PMI 36.9 January 02/02/2009 8:50 AM Europe Manufacturing PMI 34.5 33.9 January 02/02/2009 8:50 AM Germany Manufacturing PMI 32.0 32.7 January 02/02/2009 9:30 AM U.K. Manufacturing PMI 34.5 34.9 January 02/02/2009 1:30 PM USA Core PCE mm 0.0% 0.0% December 02/02/2009 1:30 PM USA Personal Consumption Exp. mm -1.1% December 02/02/2009 1:30 PM USA Core PCE yy 1.9% December 02/02/2009 1:30 PM USA Personal Consumption Exp. yy 1.4% December 02/02/2009 1:30 PM USA Personal Consumption -0.9% -0.6% December 02/02/2009 3:00 PM USA Manufacturing PMI 32.0 32.9 January 03/02/2009 12:30 AM Australia International Trade Balance mm 950m 1448m December 03/02/2009 3:30 AM Australia Interest Rate Decision 3.25% 4.25% February 03/02/2009 7:15 AM Swiss International Trade Balance mm 2150.9m December 03/02/2009 10:00 AM Europe Producer Price Index (PPI) yy 2.1% 3.3% December 03/02/2009 10:00 AM Europe Producer Price Index (PPI) mm -1.2% -1.9% December 04/02/2009 12:30 AM Australia Building Permits 2.5% -12.8% December 04/02/2009 2:30 AM Australia Retail Sales mm 1.4% 0.4% December 04/02/2009 8:50 AM Germany Services PMI 45.4 46.6 January 04/02/2009 9:00 AM Europe Services PMI 42.5 42.1 January 04/02/2009 9:00 AM Europe Manufacturing PMI 38.5 38.2 January 04/02/2009 9:30 AM U.K. Services PMI 40.2 40.2 January 04/02/2009 10:00 AM Europe Retail Sales mm -0.3% 0.6% December 04/02/2009 10:00 AM Europe Retail Sales yy -1.5% -1.5% December 04/02/2009 1:15 PM USA ADP employment -510k -693k January 04/02/2009 3:00 PM USA Services PMI 39.3 40.1 January 04/02/2009 9:45 PM New Zealand Unemployment Rate 4.7% 4.2% Quarter 4 05/02/2009 11:00 AM Germany Factory Orders yy -2% -6% December 05/02/2009 12:00 PM U.K. Interest Rate Decision 1.0% 1.5% February 05/02/2009 12:45 PM Europe Interest Rate Decision 2% 2% February 05/02/2009 1:30 PM Canada Building Permits -11.8% December 05/02/2009 1:30 PM USA Initial Jobless Claims 588k Last Week 05/02/2009 1:30 PM USA Productivity and Costs 0.9% 1.3% Quarter 4 05/02/2009 3:00 PM Canada Services PMI 39.1 January 05/02/2009 3:00 PM USA New orders XD -4.9% December 05/02/2009 3:00 PM USA Durable Goods Orders -2.6% December 05/02/2009 3:00 PM USA Factory Orders mm -2.5% -4.6% December 06/02/2009 New Zealand Market Holiday 06/02/2009 5:00 AM Japan Leading Economic Indicators -3.7 December 06/02/2009 6:30 AM U.K. Producer Price Index (PPI) mm -0.2% 0.0% January 06/02/2009 6:45 AM Swiss Unemployment Rate 2.9% 2.8% January 06/02/2009 9:30 AM U.K. Industrial Production mm -1.2% -2.3% December 06/02/2009 9:30 AM U.K. Core PPI yy 3.8% 5% January 06/02/2009 9:30 AM U.K. Industrial Production yy -7.9% -6.9% January 06/02/2009 9:30 AM U.K. Producer Price Index (PPI) yy 3.4% 4.7% February 06/02/2009 9:30 AM U.K. Core PPI mm 0.1% 0.2% January 06/02/2009 11:00 AM Germany Industrial Production mm -2.5% -3.1% December 06/02/2009 12:00 PM Canada Unemployment Rate 6.6% January 06/02/2009 12:00 PM Canada Non-Farm Payroll -34.4k January 06/02/2009 1:30 PM USA Unemployment Rate 7.4% 7.2% January 06/02/2009 1:30 PM USA Non-Farm Payroll -500k -524k January 06/02/2009 10:00 PM USA Consumer Credit mm -2.5b -7.94b December Results for the week of: 26/01/2009 - 30/01/2009 26 January 2009 - 30 January 2009 * GMT time Date Hour Country Data Result Forecast Previous Period 26/01/2009 Australia Market Holiday 26/01/2009 3:00 PM USA Existing Home Sales (Units) 4.4m 4.49m December 26/01/2009 3:00 PM USA Leading Economic Indicators -0.3% -0.4% December 26/01/2009 11:50 PM Japan Protocol of last interest rate meeting December 27/01/2009 12:30 AM Australia Producer Price Index (PPI) mm 2.0% Quarter 4 27/01/2009 12:30 AM Australia Producer Price Index (PPI) yy 5.6% Quarter 4 27/01/2009 9:00 AM Europe Current Account -6.4b November 27/01/2009 9:00 AM Europe Capital Flow 121.7b November 27/01/2009 9:00 AM Germany IFO Business Climate: index 81.4 82.6 January 27/01/2009 11:00 AM U.K. CBI Sales -55.0 January 27/01/2009 2:00 PM USA House Prices -2.1% -2.2% November 27/01/2009 3:00 PM USA Consumer Confidence 38.0 38.0 January 27/01/2009 3:00 PM USA Richmond Fed srvs -30.0 January 28/01/2009 12:30 AM Australia Consumer Price Index (CPI) mm 1.2% Quarter 4 28/01/2009 12:30 AM Australia Consumer Price Index (CPI) yy 5.0% Quarter 4 28/01/2009 7:00 AM Germany GFK Consumer Sentiment 2.0 2.1 February 28/01/2009 10:30 AM Swiss KOF Purchasing Manager ind -0.39 January 28/01/2009 7:15 PM USA Interest Rate Decision 0.0% 0.0% Last Week 28/01/2009 8:00 PM New Zealand Interest Rate Decision 4.00% 5.00% February 28/01/2009 9:45 PM New Zealand International Trade Balance mm -520.0m December 28/01/2009 9:45 PM New Zealand International Trade Balance yy -5.16b December 28/01/2009 11:50 PM Japan Retail Sales yy -0.9% December 29/01/2009 USA Building Permits December 29/01/2009 9:00 AM Europe M3 Money Supply yy 7.6% 7.8% December 29/01/2009 9:00 AM Germany Unemployment Rate 7.7% 7.6% January 29/01/2009 10:00 AM Europe Consumer Confidence -31.0 -30.0 January 29/01/2009 10:00 AM Europe Industrial Sentiment -33.0 January 29/01/2009 10:00 AM Europe Service Sentiment -17.0 January 29/01/2009 1:30 PM Canada Producer Price Index (PPI) yy 5.9% December 29/01/2009 1:30 PM Canada Producer Price Index (PPI) mm -2.6% December 29/01/2009 1:30 PM USA New orders XD -1.5% December 29/01/2009 1:30 PM USA Durable Goods Orders -1.8% -1.5% December 29/01/2009 1:30 PM USA Initial Jobless Claims Last Week 29/01/2009 3:00 PM USA New Home sales 0.4m 0.407m December 29/01/2009 4:00 PM USA Kansas City Fed Survey -21.0 January 29/01/2009 5:00 PM USA Mid-West Mnfg Activity 96.4 December 29/01/2009 9:45 PM New Zealand Building Permits 4.3% December 29/01/2009 11:15 PM Japan Manufacturing PMI 30.8 January 29/01/2009 11:30 PM Japan House hold Spending -0.5% December 29/01/2009 11:30 PM Japan Consumer Price Index (CPI) yy 1.0% December 29/01/2009 11:30 PM Japan Unemployment Rate 3.9% December 30/01/2009 5:00 AM Japan Construction Orders -12.5% January 30/01/2009 5:00 AM Japan Housing Starts yy 0.0% December 30/01/2009 9:30 AM U.K. Consumer Credit mm 0.751b December 30/01/2009 10:00 AM Europe Unemployment Rate 7.8% December 30/01/2009 10:00 AM Europe Harm. Index of Consumer Prices yy 1.5% 1.6% January 30/01/2009 1:30 PM Canada Gross Domestic Product (GDP) mm -0.1% November 30/01/2009 1:30 PM USA Core PCE qq 1.9% 2.4% Quarter 4 30/01/2009 1:30 PM USA Gross Domestic Product (GDP) qq -5.2% -0.5% Quarter 4 30/01/2009 1:30 PM USA Personal Consumption Exp. qq 5.0% Quarter 4 30/01/2009 2:45 PM USA Chicago PMI 34.2 35.1 January 30/01/2009 2:55 PM USA U.Michigan Consumer Sentiment 60.1 January Results for the week of: 19/01/2009 - 22/01/2009 19 January 2009 - 22 January 2009 * GMT time Date Hour Country Data Result Forecast Previous Period 19/01/2009 12:00 AM USA Market Holiday 19/01/2009 4:30 AM Japan Capacity Utilization -3.9% November 19/01/2009 8:15 AM Swiss Retail Sales mm 2.9% November 19/01/2009 9:45 PM New Zealand Consumer Price Index (CPI) yy 5.1% Quarter 4 20/01/2009 5:00 AM Japan Consumer Confidence 28.4 December 20/01/2009 9:30 AM U.K. Retail Price Index (RPI) mm -1.5% -0.8% December 20/01/2009 9:30 AM U.K. Retail Price Index (RPI) yy 0.9% 3% December 20/01/2009 9:30 AM U.K. RPI ex. Mortgage (RPIX) mm -0.4% December 20/01/2009 9:30 AM U.K. Retail Price Index (RPI) yy 2.7% 3.9% December 20/01/2009 9:30 AM U.K. Consumer Price Index (CPI) mm -0.8% -0.1% December 20/01/2009 9:30 AM U.K. Consumer Price Index (CPI) yy 2.7% 4.1% December 20/01/2009 10:00 AM Germany ZEW Economic Sentiment -42 -45.2 January 20/01/2009 2:00 PM Canada Interest Rate Decision 1.5% February 21/01/2009 7:00 AM Germany Producer Price Index (PPI) yy 4.3% 5.3% December 21/01/2009 7:00 AM Germany Producer Price Index (PPI) mm -1% -1.5% December 21/01/2009 9:30 AM U.K. Initial Jobless Claims 80k 75.7k December 21/01/2009 9:30 AM U.K. Unemployment Rate 6.1% 6% November 21/01/2009 1:30 PM Canada Wholsale Inventories 0.8% November 21/01/2009 1:30 PM Canada Wholesale Trade -1.8% November 21/01/2009 11:30 PM Japan Tankan Survey -64 January 21/01/2009 11:50 PM Japan International Trade Balance mm -278b -223.4b December 22/01/2009 3:00 AM Japan Interest Rate Decision 0.1% February 22/01/2009 10:00 AM Europe Factory Orders mm -5.1% -4.7% November 22/01/2009 10:00 AM Europe Factory Orders yy -19% -15.1% November 22/01/2009 10:00 AM Swiss ZEW Economic Sentiment -76.2 January 22/01/2009 1:30 PM Canada Leading Economic Indicators -0.7% December 22/01/2009 1:30 PM Canada Core Retail Sales mm -1.1% November 22/01/2009 1:30 PM Canada Retail Sales mm -0.9% November 22/01/2009 1:30 PM USA Building Permits 0.61m 0.615m December 22/01/2009 1:30 PM USA Housing Starts yy 0.61m 0.625m December 22/01/2009 1:30 PM USA Initial Jobless Claims 524k Last Week Results for the week of: 12/01/2009 - 16/01/2009 12 January 2009 to 16 January 2009 * GMT time Date Hour Country Data Result Forecast Previous Period 12/01/2009 1:30 PM Canada House Prices -0.4% November 12/01/2009 11:50 PM Japan Current Account -56.5% November 13/01/2009 9:30 AM U.K. International Trade Balance mm -7.75b November 13/01/2009 1:00 PM USA Fed Chairman Bernanke Speaks 13/01/2009 1:30 PM Canada International Trade Balance mm 3.78b November 13/01/2009 1:30 PM USA International Trade Balance mm -57.19b November 13/01/2009 3:00 PM USA IBD Consumer Sentiment 45 January 13/01/2009 7:00 PM USA Budget 48.26b December 13/01/2009 9:45 PM New Zealand Building Permits -21.9% November 14/01/2009 7:00 AM Germany Gross Domestic Product (GDP) yy 2.5% Quarter 4 14/01/2009 10:00 AM Europe Industrial Production mm -1.2% November 14/01/2009 1:30 PM USA Retail Sales mm -1.8% December 14/01/2009 1:30 PM USA Export Prices -3.2% December 14/01/2009 1:30 PM USA Import Prices -6.7% December 14/01/2009 1:30 PM USA Core Retail Sales mm -1.6% December 14/01/2009 2:00 PM Europe Industrial Production yy -5.3% November 14/01/2009 3:00 PM USA Business Inventories -0.6% November 14/01/2009 11:50 PM Japan Machinery Orders mm -4.4% November 15/01/2009 12:30 AM Australia Unemployment Rate 4.4% December 15/01/2009 12:30 AM Australia Non-Farm Payroll -15600 December 15/01/2009 7:00 AM Germany Consumer Price Index (CPI) mm -0.5% December 15/01/2009 7:00 AM Germany Consumer Price Index (CPI) yy 1.4% December 15/01/2009 7:00 AM Germany Harm. Index of Consumer Prices mm -0.6% December 15/01/2009 7:00 AM Germany Harm. Index of Consumer Prices yy 1.4% December 15/01/2009 10:00 AM Europe Core HICP mm 0% December 15/01/2009 10:00 AM Europe Core HICP yy 2.2% December 15/01/2009 10:00 AM Europe Harm. Index of Consumer Prices mm -0.5% December 15/01/2009 10:00 AM Europe Harm. Index of Consumer Prices yy 2.1% December 15/01/2009 12:45 PM Europe Interest Rate Decision 2.5% January 15/01/2009 1:30 PM USA Producer Price Index (PPI) yy 0.4% December 15/01/2009 1:30 PM USA Producer Price Index (PPI) mm -2.2% December 15/01/2009 1:30 PM USA Core PPI mm 0.1% December 15/01/2009 1:30 PM USA Core PPI yy 4.2% December 15/01/2009 1:30 PM USA Initial Jobless Claims Last Week 15/01/2009 1:30 PM USA New-York Fed Survey -25.75 January 15/01/2009 3:00 PM USA Philadelphia Fed Survey -32.9 January 16/01/2009 8:15 AM Swiss Producer Price Index (PPI) mm -1.4% December 16/01/2009 8:15 AM Swiss Producer Price Index (PPI) yy 1.1% December 16/01/2009 10:00 AM Europe International Trade Balance mm 0.9b November 16/01/2009 1:30 PM USA Core CPI yy 2% December 16/01/2009 1:30 PM USA Consumer Price Index (CPI) yy 1.1% December 16/01/2009 1:30 PM USA Core CPI mm 0.0% December 16/01/2009 1:30 PM USA Consumer Price Index (CPI) mm -1.7% December 16/01/2009 2:00 PM USA Capital Flow 286.3b November 16/01/2009 2:15 PM USA Capacity Utilization 75.4% December 16/01/2009 2:15 PM USA Industrial Production mm -0.6% December 16/01/2009 2:55 PM USA U.Michigan Consumer Sentiment 59.1 January Results for the week of: 05/01/2009 - 09/01/2009 5 January 2009 - 9 January 2009 *GMT time Date Hour Country Data Result Forecast Previous Period 05/01/2009 8:30 AM Swiss Manufacturing PMI 34.5 35.2 December 05/01/2009 3:00 PM USA Construction Spending -1.2% -1.2% November 06/01/2009 8:55 AM Germany Services PMI 46.4 45.1 December 06/01/2009 9:00 AM Europe Services PMI 42.0 42.5 December 06/01/2009 9:30 AM U.K. Services PMI 39.0 40.1 December 06/01/2009 10:00 AM Europe Harm. Index of Consumer Prices mm 1.8% 2.1% December 06/01/2009 1:30 PM Canada Producer Price Index (PPI) mm 0.0% November 06/01/2009 1:30 PM Canada Producer Price Index (PPI) yy 9.5% November 06/01/2009 3:00 PM USA Durable Goods Orders -1.0% November 06/01/2009 3:00 PM USA New orders XD -0.9% November 06/01/2009 3:00 PM USA Factory Orders mm -3.0% -5.1% November 06/01/2009 3:00 PM USA Pending Homes Sales -0.6% -0.7% November 06/01/2009 3:00 PM USA Services PMI 37 37.3 December 06/01/2009 7:00 PM USA Protocol of last interest rate meeting 06/01/2009 9:45 PM New Zealand International Trade Balance mm -838.0m -942.0m November 06/01/2009 9:45 PM New Zealand International Trade Balance yy -5.50b -5.22b November 07/01/2009 12:30 AM Australia Retail Sales mm 0.7% November 07/01/2009 9:00 AM Germany Unemployment Rate 7.5% 7.5% December 07/01/2009 10:00 AM Europe Producer Price Index (PPI) mm -0.7% -0.8% November 07/01/2009 10:00 AM Europe Producer Price Index (PPI) yy 4.6% 6.3% November 07/01/2009 1:15 PM USA ADP employment -350.0k -250.0k December 08/01/2009 12:30 AM Australia Building Permits -5.4% November 08/01/2009 12:30 AM Australia International Trade Balance mm 2952m November 08/01/2009 6:45 AM Swiss Consumer Price Index (CPI) mm -0.3% -0.7% December 08/01/2009 6:45 AM Swiss Consumer Price Index (CPI) yy 0.9% 1.5% December 08/01/2009 6:45 AM Swiss Unemployment Rate 2.8% 2.7% December 08/01/2009 7:00 AM Germany International Trade Balance mm 14.5b 15.8b November 08/01/2009 10:00 AM Europe Unemployment Rate 7.8% 7.7% November 08/01/2009 10:00 AM Europe Consumer Confidence -25.0 December 08/01/2009 10:00 AM Europe Economic Sentiment 74.9 December 08/01/2009 10:00 AM Europe Gross Domestic Product (GDP) qq -0.2% Quarter 3 08/01/2009 10:00 AM Europe Gross Domestic Product (GDP) yy 1.4% Quarter 3 08/01/2009 10:00 AM Europe Industrial Sentiment -25.0 December 08/01/2009 10:00 AM Europe Service Sentiment -12.0 December 08/01/2009 11:00 AM Germany Factory Orders mm -1.0% -6.1% November 08/01/2009 12:00 PM U.K. Interest Rate Decision 2.0% January 08/01/2009 1:30 PM USA Initial Jobless Claims Last Week 08/01/2009 3:00 PM Canada Services PMI 40.2 December 08/01/2009 8:00 PM USA Consumer Credit mm -0.5b -3.54b November 09/01/2009 5:00 AM Japan Leading Economic Indicators -4.2 November 09/01/2009 9:30 AM U.K. Industrial Production yy -5.2% November 09/01/2009 9:30 AM U.K. Core PPI mm 0.2% December 09/01/2009 9:30 AM U.K. Core PPI yy 5.1% December 09/01/2009 9:30 AM U.K. Producer Price Index (PPI) mm -3.3% December 09/01/2009 9:30 AM U.K. Producer Price Index (PPI) yy 7.5% December 09/01/2009 9:30 AM U.K. Industrial Production mm -1.7% November 09/01/2009 10:00 AM Europe Retail Sales mm 0.2% -0.8% November 09/01/2009 10:00 AM Europe Retail Sales yy -2.1% November 09/01/2009 11:00 AM Germany Industrial Production mm -2.8% -2.1% November 09/01/2009 12:00 PM Canada Non-Farm Payroll -70.6k December 09/01/2009 12:00 PM Canada Unemployment Rate 6.3% December 09/01/2009 1:15 PM Canada Housing Starts yy 172.0k December 09/01/2009 1:30 PM Canada Building Permits -15.7% November 09/01/2009 1:30 PM USA Non-Farm Payroll -475.0k -533.0k December 09/01/2009 1:30 PM USA Unemployment Rate 6.9% 6.7% December 09/01/2009 3:00 PM USA Wholsale Inventories -0.8% -1.1% November 09/01/2009 3:00 PM USA Wholesale Trade -4.1% November Results for the week of: 28/12/2008 - 02/01/2009 28 December 2008 - 2 January 2009 *GMT time Date Hour Country Data Result Forecast Previous Period 29/12/2008 10:30 AM Swiss KOF Purchasing Manager ind -0.25 -0.05 December 29/12/2008 5:00 PM USA Mid-West Mnfg Activity 98.6 November 30/12/2008 9:00 AM Europe M3 Money Supply yy 8.5% 8.7% November 30/12/2008 2:00 PM USA House Prices -17.8% -17.4% October 30/12/2008 3:00 PM USA Consumer Confidence 45 44.9 December 30/12/2008 4:00 PM USA KC Fed -31 December 31/12/2008 1:30 PM USA Initial Jobless Claims 550k Last Week 01/01/2009 12:00 AM Japan Market Holiday 01/01/2009 12:00 AM Australia Market Holiday 01/01/2009 12:00 AM Canada Market Holiday 01/01/2009 12:00 AM Germany Market Holiday 01/01/2009 12:00 AM USA Market Holiday 02/01/2009 8:55 AM Germany Manufacturing PMI 33.5 35.7 December 02/01/2009 9:00 AM Europe Manufacturing PMI 34.5 35.6 December 02/01/2009 9:30 AM U.K. Consumer Credit mm 0.6b 0.844b November 02/01/2009 9:30 AM U.K. Manufacturing PMI 33.5 34.4 December 02/01/2009 3:00 PM USA Manufacturing PMI 35.5 36.2 December Results for the week of: 21/12/2008 - 25/12/2008 21 December 2008 - 25 December 2008 * GMT time Date Hour Country Data Result Forecast Previous Period 21/12/2008 9:45 PM New Zealand Current Account -6.01b -3.91b Quarter 3 21/12/2008 11:30 PM Japan Tankan Survey -42 December 21/12/2008 11:50 PM Japan International Trade Balance mm -257.5b -63.9b November 22/12/2008 7:00 AM Germany GFK Consumer Sentiment 2.1 2.2 January 22/12/2008 7:00 AM Germany Import Prices -2.6% -3.6% November 23/12/2008 9:00 AM Europe Current Account -10.6b October 23/12/2008 9:00 AM Europe Capital Flow 38.6b October 23/12/2008 9:30 AM U.K. Current Account -11.85b -11b Quarter 3 23/12/2008 9:30 AM U.K. Gross Domestic Product (GDP) yy 0.3% 0.3% Quarter 3 23/12/2008 9:30 AM U.K. Gross Domestic Product (GDP) qq -0.5% -0.5% Quarter 3 23/12/2008 10:00 AM Europe Factory Orders mm -4.0% -3.9% October 23/12/2008 10:00 AM Europe Factory Orders yy -10.7% -1.1% October 23/12/2008 1:30 PM USA Core PCE qq 2.6% 2.6% Quarter 3 23/12/2008 1:30 PM USA Gross Domestic Product (GDP) qq -0.5% -0.5% Quarter 3 23/12/2008 1:30 PM USA Personal Consumption Exp. qq 5.2% 5.2% Quarter 3 23/12/2008 2:55 PM USA U.Michigan Consumer Sentiment 58.5 55.3 December 23/12/2008 3:00 PM USA Existing Home Sales (Units) 4.9m 4.98m November 23/12/2008 3:00 PM USA New Home sales 0.42m 0.433m November 23/12/2008 3:00 PM USA Richmond Fed srvs -22 December 24/12/2008 12:00 AM Germany Market Holiday 24/12/2008 1:30 PM Canada Gross Domestic Product (GDP) mm 0.1% October 24/12/2008 1:30 PM USA Personal Income 0.1% 0.3% November 24/12/2008 1:30 PM USA Core PCE yy 2.1% November 24/12/2008 1:30 PM USA New orders XD -5.4% November 24/12/2008 1:30 PM USA Durable Goods Orders -3.4% -6.9% November 24/12/2008 1:30 PM USA Initial Jobless Claims 550k 554k Last Week 24/12/2008 1:30 PM USA Personal Consumption -0.8% -1% November 24/12/2008 1:30 PM USA Personal Consumption Exp. mm -0.6% November 24/12/2008 1:30 PM USA Core PCE mm 0% 0% November 24/12/2008 1:30 PM USA Personal Consumption Exp. yy 3.2% November 24/12/2008 11:50 PM Japan Protocol of last interest rate meeting November 25/12/2008 12:00 AM U.K. Market Holiday 25/12/2008 12:00 AM Canada Market Holiday 25/12/2008 12:00 AM Germany Market Holiday 25/12/2008 12:00 AM USA Market Holiday 25/12/2008 5:00 AM Japan Construction Orders 47.2% November 25/12/2008 5:00 AM Japan Housing Starts yy 8.0% 19.8% November 25/12/2008 11:15 PM Japan Manufacturing PMI 36.7 December 25/12/2008 11:30 PM Japan House'hold Spending -3.7% -3.8% November 25/12/2008 11:30 PM Japan Consumer Price Index (CPI) yy 1.1% 1.9% November 25/12/2008 11:30 PM Japan Unemployment Rate 4% 3.7% November Results for the week of: 14/12/2008 - 19/12/2008 14 December 2008 - 19 December 2008 * GMT time Date Hour Country Data Result Forecast Previous Period 14/12/2008 11:50 PM Japan Tankan Survey 1.7% Quarter 4 15/12/2008 8:15 AM Swiss Producer Price Index (PPI) mm -0.6% November 15/12/2008 8:15 AM Swiss Producer Price Index (PPI) yy 2.9% November 15/12/2008 1:30 PM USA New-York Fed Survey -25.43 December 15/12/2008 2:00 PM USA Capital Flow 143.4b October 15/12/2008 2:15 PM USA Capacity Utilization 76.4% November 15/12/2008 2:15 PM USA Industrial Production mm 1.3% November 16/12/2008 12:25 AM Australia Protocol of last interest rate meeting December 16/12/2008 8:15 AM Swiss Factory Orders mm 5.4% Quarter 3 16/12/2008 8:30 AM Germany Manufacturing PMI 35.7 December 16/12/2008 8:30 AM Germany Services PMI 45.1 December 16/12/2008 9:00 AM Europe Manufacturing PMI 35.6 December 16/12/2008 9:00 AM Europe Services PMI 42.5 December 16/12/2008 9:30 AM U.K. Consumer Price Index (CPI) mm -0.2% November 16/12/2008 9:30 AM U.K. RPI ex. Mortgage (RPIX) mm -0.3% November 16/12/2008 9:30 AM U.K. Consumer Price Index (CPI) yy 4.5% November 16/12/2008 9:30 AM U.K. RPI ex. Mortgage (RPIX) yy 4.7% November 16/12/2008 9:30 AM U.K. Retail Price Index (RPI) mm -0.3% November 16/12/2008 9:30 AM USA Retail Price Index (RPI) yy 4.2% November 16/12/2008 1:30 PM USA Housing Starts yy 0.791m November 16/12/2008 1:30 PM USA Core CPI mm -0.1% November 16/12/2008 1:30 PM USA Consumer Price Index (CPI) mm -1.0% November 16/12/2008 1:30 PM USA Core CPI yy 2.2% November 16/12/2008 1:30 PM USA Consumer Price Index (CPI) yy 3.7% November 16/12/2008 1:30 PM USA Building Permits 0.73m November 16/12/2008 7:15 PM USA Interest Rate Decision 0.5% 1% December 17/12/2008 7:00 AM Germany Consumer Price Index (CPI) mm -0.2% November 17/12/2008 7:00 AM Germany Consumer Price Index (CPI) yy 2.4% November 17/12/2008 7:00 AM Germany Harm. Index of Consumer Prices mm -0.3% November 17/12/2008 7:00 AM Germany Harm. Index of Consumer Prices yy 2.5% November 17/12/2008 8:30 AM U.K. Initial Jobless Claims 36.5k October 17/12/2008 9:00 AM Europe Core HICP mm 0.4% November 17/12/2008 9:30 AM U.K. Unemployment Rate 5.8% October 17/12/2008 10:00 AM Europe Core HICP yy 2.4% November 17/12/2008 10:00 AM Europe Harm. Index of Consumer Prices mm -0.5% 0.0% November 17/12/2008 10:00 AM Europe Harm. Index of Consumer Prices yy 2.1% 3.2% November 17/12/2008 11:00 AM U.K. CBI Sales -46.0 December 17/12/2008 1:30 PM Canada Wholsale Inventories 0.7% October 17/12/2008 1:30 PM Canada Wholesale Trade 1.5% October 17/12/2008 1:30 PM USA Core Retail Sales yy -183.1b Quarter 3 18/12/2008 12:00 AM Japan Protocol of last interest rate meeting December 18/12/2008 7:15 AM Swiss International Trade Balance mm 1838.6m November 18/12/2008 8:15 AM Swiss Retail Sales mm 6.4% October 18/12/2008 9:00 AM Germany IFO Business Climate: index 85.8 December 18/12/2008 9:30 AM U.K. Retail Sales yy 1.9% November 18/12/2008 9:30 AM U.K. Retail Sales mm -0.1% November 18/12/2008 10:00 AM Europe International Trade Balance mm -5.6b October 18/12/2008 12:30 PM USA Initial Jobless Claims Last Week 18/12/2008 1:30 PM Canada Leading Economic Indicators -0.4% November 18/12/2008 1:30 PM Canada Core Retail Sales mm 0.8% October 18/12/2008 1:30 PM Canada Retail Sales mm 1.1% October 18/12/2008 3:00 PM USA Leading Economic Indicators -0.8% November 18/12/2008 3:00 PM USA Philadelphia Fed Survey -39.3 December 19/12/2008 12:00 AM Japan Interest Rate Decision 0.3% December 19/12/2008 7:00 AM Germany Producer Price Index (PPI) mm 0.0% November 19/12/2008 7:00 AM Germany Producer Price Index (PPI) yy 7.8% November 19/12/2008 12:00 PM Canada Consumer Price Index (CPI) yy 2.6% November 19/12/2008 12:00 PM Canada Core CPI mm -0.2% November 19/12/2008 12:00 PM Canada Core CPI yy 1.7% November 19/12/2008 12:00 PM Canada Consumer Price Index (CPI) mm -1.0% November Results for the week of: 07/12/2008 - 12/12/2008 7 December 2008 - 12 December 2008 * GMT time Date Hour Country Data Result Forecast Previous Period 07/12/2008 11:50 PM Japan Current Account -50.1% -48.8% October 08/12/2008 9:30 AM U.K. Core PPI mm -0.4% -0.5% November 08/12/2008 9:30 AM U.K. Core PPI yy 4.4% 4.9% November 08/12/2008 9:30 AM U.K. Producer Price Index (PPI) mm -2.6% -5.6% November 08/12/2008 9:30 AM U.K. Producer Price Index (PPI) yy 6.7% 13.8% November 08/12/2008 11:00 AM Germany Industrial Production mm -1.5% -3.6% October 08/12/2008 1:15 PM Canada Housing Starts yy 211.8K November 08/12/2008 11:50 PM Japan Gross Domestic Product (GDP) yy -0.9% -0.4% Quarter 3 08/12/2008 11:50 PM Japan Gross Domestic Product (GDP) qq -0.2% -0.1% Quarter 3 09/12/2008 12:30 AM Australia Business Confidence -29.0 November 09/12/2008 5:00 AM Japan Leading Economic Indicators 0.2 October 09/12/2008 6:45 AM Swiss Unemployment Rate 2.7% 2.6% November 09/12/2008 7:00 AM Germany International Trade Balance mm 14.0b 13.7b October 09/12/2008 9:00 AM Australia Reserve Bank of Australia Governor Speech 09/12/2008 9:30 AM U.K. Industrial Production mm -0.4% -0.2% October 09/12/2008 9:30 AM U.K. Industrial Production yy -3.1% -2.2% October 09/12/2008 9:30 AM U.K. International Trade Balance mm -7.5b -7.482b October 09/12/2008 10:00 AM Germany ZEW Economic Sentiment -55.0 -53.5 December 09/12/2008 2:00 PM Canada Interest Rate Decision 2.25% Last Week 09/12/2008 3:00 PM USA IBD Consumer Sentiment 50.8 December 09/12/2008 3:00 PM USA Pending Homes Sales -3.5% -4.6% October 09/12/2008 11:50 PM Japan Machinery Orders mm -3.9% 5.5% October 10/12/2008 10:00 AM Swiss ZEW Economic Sentiment -88.5 December 10/12/2008 3:00 PM USA Wholsale Inventories -0.1% -0.1% October 10/12/2008 3:00 PM USA Wholesale Trade -1.5% October 10/12/2008 7:00 PM USA Budget -168.7b -98.24b November 11/12/2008 12:30 AM Australia Unemployment Rate 4.5% 4.3% November 11/12/2008 12:30 AM Australia Non-Farm Payroll -15000 34300 November 11/12/2008 8:30 AM Swiss Interest Rate Decision 1.0% 1.0% Quarter 4 11/12/2008 11:00 AM U.K. CBI Orders -45.0 -38.0 December 11/12/2008 1:30 PM Canada New Home sales 0.1% October 11/12/2008 1:30 PM Canada International Trade Balance mm 4.49b October 11/12/2008 1:30 PM USA International Trade Balance mm -55.0b -56.47b October 11/12/2008 1:30 PM USA Export Prices -1.5% -1.9% November 11/12/2008 1:30 PM USA Import Prices -4.0% -4.7% November 11/12/2008 1:30 PM USA Initial Jobless Claims 509.0k Last Week 11/12/2008 9:45 PM New Zealand Retail Sales yy 2.2% October 11/12/2008 9:45 PM New Zealand Core Retail Sales mm -0.5% October 11/12/2008 9:45 PM New Zealand Retail Price Index (RPI) mm 0.1% October 12/12/2008 4:30 AM Japan Capacity Utilization 1.6% October 12/12/2008 5:00 AM Japan Consumer Confidence 29.4 November 12/12/2008 10:00 AM Europe Industrial Production mm -1.0% -1.6% October 12/12/2008 10:00 AM Europe Industrial Production yy -3.8% -2.4% October 12/12/2008 1:30 PM USA Producer Price Index (PPI) yy 5.2% November 12/12/2008 1:30 PM USA Producer Price Index (PPI) mm -1.7% -2.8% November 12/12/2008 1:30 PM USA Core PPI mm 0.2% 0.4% November 12/12/2008 1:30 PM USA Core PPI yy 4.4% November 12/12/2008 1:30 PM USA Core Retail Sales mm -1.7% -2.2% November 12/12/2008 1:30 PM USA Retail Sales mm -1.4% -2.8% November 12/12/2008 2:55 PM USA U.Michigan Consumer Sentiment 55.0 55.3 December 12/12/2008 3:00 PM USA Business Inventories -0.3% -0.2% October Results for the week of: 30/11/2008 - 05/12/2008 30 November 2008 - 5 December 2008 * GMT time Date Hour Country Data Result Forecast Previous Period 01/12/2008 8:30 AM Swiss Manufacturing PMI 47.0 November 01/12/2008 8:55 AM Germany Manufacturing PMI 36.7 42.9 November 01/12/2008 9:00 AM Europe Manufacturing PMI 36.2 41.1 November 01/12/2008 9:30 AM U.K. Consumer Credit mm 0.251b October 01/12/2008 9:30 AM U.K. Manufacturing PMI 41.5 November 01/12/2008 1:30 PM Canada Gross Domestic Product (GDP) yy 0.3% Quarter 3 01/12/2008 1:30 PM Canada Gross Domestic Product (GDP) qq 0.1% Quarter 3 01/12/2008 1:30 PM Canada Gross Domestic Product (GDP) mm -0.3% September 01/12/2008 3:00 PM USA Construction Spending -0.9% -0.3% October 01/12/2008 3:00 PM USA Manufacturing PMI 38.4 38.9 November 01/12/2008 6:45 PM USA Fed Chairman Bernanke Speaks 01/12/2008 8:00 PM USA Treasury Secretary Speaks 01/12/2008 11:30 PM Japan Tankan Survey -25.0 November 02/12/2008 12:30 AM Australia Current Account 12.77b Quarter 3 02/12/2008 12:30 AM Australia Retail Sales mm -1.1% October 02/12/2008 3:30 AM Australia Interest Rate Decision 5.25% December 02/12/2008 6:45 AM Swiss Consumer Price Index (CPI) mm 0.5% November 02/12/2008 6:45 AM Swiss Consumer Price Index (CPI) yy 2.6% November 02/12/2008 10:00 AM Europe Producer Price Index (PPI) mm -0.2% October 02/12/2008 10:00 AM Europe Producer Price Index (PPI) yy 7.1% 7.9% October 02/12/2008 4:30 PM USA Treasury Secretary Speaks 03/12/2008 12:30 AM Australia Gross Domestic Product (GDP) qq 0.3% Quarter 3 03/12/2008 12:30 AM Australia Gross Domestic Product (GDP) yy 2.7% Quarter 3 03/12/2008 8:55 AM Germany Services PMI 46.2 48.3 November 03/12/2008 9:00 AM Europe Services PMI 45.8 November 03/12/2008 9:00 AM Europe Manufacturing PMI 43.3 43.6 November 03/12/2008 9:30 AM U.K. Services PMI 42.4 November 03/12/2008 10:00 AM Europe Retail Sales mm 0.2% -0.2% October 03/12/2008 10:00 AM Europe Retail Sales yy -1.6% October 03/12/2008 1:15 PM USA ADP employment -207.0k -157.0k November 03/12/2008 3:00 PM USA Services PMI 43.0 44.4 November 03/12/2008 7:00 PM USA Fed Beige Book 03/12/2008 8:00 PM New Zealand Interest Rate Decision 5.5% 6.5% December 04/12/2008 12:30 AM Australia International Trade Balance mm 1460m October 04/12/2008 12:30 AM Australia Building Permits -7.2% October 04/12/2008 6:45 AM Swiss Gross Domestic Product (GDP) qq 0.4% Quarter 3 04/12/2008 6:45 AM Swiss Gross Domestic Product (GDP) yy 2.3% Quarter 3 04/12/2008 10:00 AM Europe Gross Domestic Product (GDP) yy 0.7% 1.4% Quarter 3 04/12/2008 10:00 AM Europe Gross Domestic Product (GDP) qq -0.2% -0.2% Quarter 3 04/12/2008 12:00 PM U.K. Interest Rate Decision 2.5% 3.0% December 04/12/2008 12:45 PM Europe Interest Rate Decision 2.75% 3.25% December 04/12/2008 1:30 PM Canada Building Permits 13.4% October 04/12/2008 1:30 PM USA Initial Jobless Claims 529.0k 529.0k Last Week 04/12/2008 3:00 PM Canada Services PMI 52.2 November 04/12/2008 3:00 PM USA Factory Orders mm -2.8% -2.5% October 04/12/2008 3:00 PM USA Durable Goods Orders -6.2% October 04/12/2008 3:00 PM USA New orders XD -4.6% October 04/12/2008 4:15 PM USA Fed Chairman Bernanke Speaks 05/12/2008 11:00 AM Germany Factory Orders mm 0.3% -8.0% October 05/12/2008 12:00 PM Canada Non-Farm Payroll 9.5k November 05/12/2008 12:00 PM Canada Unemployment Rate 6.2% November 05/12/2008 1:30 PM USA Non-Farm Payroll -300.0k -240.0k November 05/12/2008 1:30 PM USA Unemployment Rate 6.7% 6.5% November 05/12/2008 8:00 PM USA Consumer Credit mm 2.4b 6.86b October Results for the week of: 24/11/2008 - 28/11/2008 24 November 2008 - 28 November 2008 * GMT time Date Hour Country Data Result Forecast Previous Period 24/11/2008 9:00 AM Europe Capital Flow -25.5b September 24/11/2008 9:00 AM Europe IFO Business Climate: index 88.9 90.2 November 24/11/2008 9:00 AM Europe Current Account -8.4b September 24/11/2008 10:00 AM Europe Factory Orders yy -6.6% September 24/11/2008 10:00 AM Europe Factory Orders mm -1.2% September 24/11/2008 3:00 PM USA Existing Home Sales (Units) 5.05m 5.18m October 25/11/2008 7:00 AM Germany Gross Domestic Product (GDP) qq -0.5% Quarter 3 25/11/2008 7:00 AM Germany Gross Domestic Product (GDP) yy 3.1% Quarter 3 25/11/2008 7:00 AM Germany GFK Consumer Sentiment 1.5 1.9 December 25/11/2008 1:30 PM Canada Core Retail Sales mm -0.3% September 25/11/2008 1:30 PM USA Core PCE qq 2.9% 2.9% Quarter 3 25/11/2008 2:00 PM USA House Prices -17.0% -16.6% September 25/11/2008 3:00 PM USA Consumer Confidence 39.0 38.0 November 25/11/2008 3:00 PM USA Richmond Fed srvs -10 November 25/11/2008 3:30 PM Canada Retail Sales mm -0.3% September 26/11/2008 9:30 AM U.K. Gross Domestic Product (GDP) qq -0.5% -0.5% Quarter 3 26/11/2008 9:30 AM U.K. Gross Domestic Product (GDP) yy 0.3% 0.3% Quarter 3 26/11/2008 1:30 PM USA Core PCE yy 2.4% October 26/11/2008 1:30 PM USA New orders XD -1.2% -0.5% October 26/11/2008 1:30 PM USA Durable Goods Orders -2.2% 0.9% October 26/11/2008 1:30 PM USA Initial Jobless Claims 542k Last Week 26/11/2008 1:30 PM USA Personal Consumption Exp. mm 0.1% October 26/11/2008 1:30 PM USA Core PCE mm 0.1% 0.2% October 26/11/2008 1:30 PM USA Personal Income 0.1% 0.2% October 26/11/2008 1:30 PM USA Personal Consumption Exp. yy 4.2% October 26/11/2008 2:45 PM USA Chicago PMI 36.5 37.8 November 26/11/2008 2:55 PM USA U.Michigan Consumer Sentiment 56.0 57.6 November 26/11/2008 3:00 PM USA New Home sales 0.45m 0.464m October 26/11/2008 4:00 PM USA KC Fed -23 November 26/11/2008 5:00 PM USA Mid-West Mnfg Activity 100.6 October 26/11/2008 11:50 PM Japan Protocol of last interest rate meeting October 27/11/2008 8:15 AM Swiss Non-Farm Payroll 3.924m Quarter 3 27/11/2008 9:00 AM Europe M3 Money Supply yy 8.1% 8.6% October 27/11/2008 9:00 AM Germany Unemployment Rate 7.5% 7.5% November 27/11/2008 10:00 AM Europe Service Sentiment -8.0 -6.0 November 27/11/2008 11:15 PM Japan Manufacturing PMI 42.2 November 27/11/2008 11:30 PM Japan Unemployment Rate 4.2% 4.0% October 27/11/2008 11:30 PM Japan House'hold Spending -3.4% -2.3% October 27/11/2008 11:30 PM Japan Consumer Price Index (CPI) yy 2.3% October 27/11/2008 11:50 PM Japan Retail Sales yy -0.9% -0.4% October 28/11/2008 5:00 AM Japan Construction Orders 10.3% October 28/11/2008 5:00 AM Japan Housing Starts yy 29.3% 54.2% October 28/11/2008 12:00 PM Europe Unemployment Rate 7.6% 7.5% October 28/11/2008 3:30 PM Canada Producer Price Index (PPI) yy 8.0% October 28/11/2008 3:30 PM Canada Producer Price Index (PPI) mm -1.2% October Results for the week of: 16/11/2008 - 21/11/2008 16 November 2008 - 21 November 2008 * GMT time Date Hour Country Data Result Forecast Previous Period 16/11/2008 11:50 PM Japan Gross Domestic Product (GDP) yy 0.3% -3.0% Quarter 3 16/11/2008 11:50 PM Japan Gross Domestic Product (GDP) qq 0.1% -0.7% Quarter 3 17/11/2008 10:00 AM Europe International Trade Balance mm -9.3b September 17/11/2008 1:30 PM USA New-York Fed Survey -25.5 -24.62 November 17/11/2008 2:15 PM USA Capacity Utilization 76.3% 76.4% October 17/11/2008 2:15 PM USA Industrial Production mm -0.4% -2.8% October 18/11/2008 12:30 AM Australia Protocol of last interest rate meeting 18/11/2008 8:15 AM Swiss Retail Sales mm 0.0% September 18/11/2008 9:30 AM U.K. Consumer Price Index (CPI) mm 0.5% October 18/11/2008 9:30 AM U.K. Consumer Price Index (CPI) yy 5.2% October 18/11/2008 9:30 AM U.K. RPI ex. Mortgage (RPIX) mm 0.6% October 18/11/2008 9:30 AM U.K. Retail Price Index (RPI) yy 5.0% October 18/11/2008 9:30 AM U.K. Retail Price Index (RPI) mm 0.6% October 18/11/2008 9:30 AM U.K. RPI ex. Mortgage (RPIX) yy 5.5% October 18/11/2008 1:30 PM USA Producer Price Index (PPI) yy 8.7% October 18/11/2008 1:30 PM USA Producer Price Index (PPI) mm -1.2% -0.4% October 18/11/2008 1:30 PM USA Core PPI mm 0.2% 0.4% October 18/11/2008 1:30 PM USA Core PPI yy 4.0% October 18/11/2008 2:00 PM USA Capital Flow -0.4b September 18/11/2008 9:45 PM New Zealand Producer Price Index (PPI) mm 3.5% Quarter 3 19/11/2008 9:30 AM U.K. Protocol of last interest rate meeting 19/11/2008 11:00 AM U.K. CBI Orders -39.0 November 19/11/2008 1:30 PM Canada Leading Economic Indicators -0.2% October 19/11/2008 1:30 PM USA Building Permits 0.78m 0.805m October 19/11/2008 1:30 PM USA Consumer Price Index (CPI) mm -0.5% 0.0% October 19/11/2008 1:30 PM USA Consumer Price Index (CPI) yy 4.3% 4.9% October 19/11/2008 1:30 PM USA Core CPI yy 2.4% 2.5% October 19/11/2008 1:30 PM USA Core CPI mm 0.2% 0.1% October 19/11/2008 1:30 PM USA Housing Starts yy 0.8m 0.817m October 19/11/2008 7:00 PM USA Protocol of last interest rate meeting 19/11/2008 11:50 PM Japan International Trade Balance mm 95.11b October 20/11/2008 12:00 AM Japan Protocol of last interest rate meeting November 20/11/2008 7:00 AM Germany Producer Price Index (PPI) mm 0.3% October 20/11/2008 7:00 AM Germany Producer Price Index (PPI) yy 8.3% October 20/11/2008 7:15 AM Swiss International Trade Balance mm 1442.6m October 20/11/2008 9:30 AM U.K. Retail Sales mm -0.4% October 20/11/2008 9:30 AM U.K. Retail Sales yy 1.8% October 20/11/2008 1:30 PM Canada Wholsale Inventories 0.6% September 20/11/2008 1:30 PM Canada Wholesale Trade -1.5% September 20/11/2008 1:30 PM USA Initial Jobless Claims Last Week 20/11/2008 3:00 PM USA Philadelphia Fed Survey -35.0 -37.5 November 20/11/2008 3:00 PM USA Leading Economic Indicators -0.5% 0.3% October 21/11/2008 12:00 AM Japan Interest Rate Decision 0.3% November 21/11/2008 9:00 AM Europe Manufacturing PMI 41.1 November 21/11/2008 9:00 AM Europe Services PMI 45.8 November 21/11/2008 12:00 PM Canada Consumer Price Index (CPI) yy 3.4% October 21/11/2008 12:00 PM Canada Core CPI mm 0.4% October 21/11/2008 12:00 PM Canada Core CPI yy 1.7% October 21/11/2008 12:00 PM Canada Consumer Price Index (CPI) mm 0.1% October Results for the week of: 10/11/2008 - 14/11/2008 10 November 2008 - 14 November 2008 * GMT Time Date Hour Country Data Result Forecast Previous Period 09/11/2008 11:50 PM Japan Machinery Orders mm -14.5% September 10/11/2008 12:30 AM Australia Reserve Bank of Australia Governor Speech 10/11/2008 6:45 AM Swiss Consumer Confidence -17.0 Quarter 4 10/11/2008 9:30 AM U.K. Core PPI mm October 10/11/2008 9:30 AM U.K. Core PPI yy October 10/11/2008 9:30 AM U.K. Producer Price Index (PPI) mm October 10/11/2008 9:30 AM U.K. Producer Price Index (PPI) yy October 10/11/2008 1:15 PM Canada Housing Starts yy 217.6k October 10/11/2008 1:30 PM Canada House Prices 0.0% September 10/11/2008 11:50 PM Japan Current Account -52.5% September 11/11/2008 9:30 AM U.K. International Trade Balance mm -8.198b September 11/11/2008 10:00 AM Germany ZEW Economic Sentiment -62.5 -63.0 November 11/11/2008 3:00 PM USA IBD Consumer Sentiment 41.1 November 12/11/2008 12:30 AM Australia Consumer Confidence -11% November 12/11/2008 5:00 AM Japan Consumer Confidence 31.4 October 12/11/2008 9:30 AM U.K. Initial Jobless Claims 31.8 October 12/11/2008 9:30 AM U.K. Unemployment Rate 5.7% September 12/11/2008 10:00 AM Europe Industrial Production mm -1.1% 1.1% September 12/11/2008 10:00 AM Europe Industrial Production yy -0.6% -0.7% September 12/11/2008 10:30 AM U.K. Bank of England Quarterly Inflation Report 12/11/2008 9:45 PM New Zealand Retail Sales mm 0.4% September 12/11/2008 9:45 PM New Zealand Retail Sales yy -0.9% September 12/11/2008 9:45 PM New Zealand Core Retail Sales mm 0.8% September 13/11/2008 4:30 AM Japan Capacity Utilization -3.5% September 13/11/2008 7:00 AM Germany Gross Domestic Product (GDP) qq - prel -0.1% -0.5% Quarter 3 13/11/2008 7:00 AM Germany Gross Domestic Product (GDP) yy - prel 1.6% 3.1% Quarter 3 13/11/2008 8:15 AM Swiss Producer Price Index (PPI) mm -0.5% October 13/11/2008 8:15 AM Swiss Producer Price Index (PPI) yy 3.7% October 13/11/2008 10:00 AM Swiss ZEW Economic Sentiment -91.1 November 13/11/2008 1:30 PM Canada International Trade Balance mm 5.8b September 13/11/2008 1:30 PM USA Initial Jobless Claims Last Week 13/11/2008 1:30 PM USA International Trade Balance mm -57.9b -59.14b September 13/11/2008 7:00 PM USA Budget -74.4b -56.838b October 14/11/2008 7:00 AM Germany Consumer Price Index (CPI) mm -0.2% -0.1% October 14/11/2008 7:00 AM Germany Consumer Price Index (CPI) yy 2.4% 2.9% October 14/11/2008 7:00 AM Germany Harm. Index of Consumer Prices mm -0.3% -0.1% October 14/11/2008 7:00 AM Germany Harm. Index of Consumer Prices yy 2.5% 3.0% October 14/11/2008 10:00 AM Europe Core HICP mm 0.3% October 14/11/2008 10:00 AM Europe Core HICP yy 2.5% October 14/11/2008 10:00 AM Europe Harm. Index of Consumer Prices mm 0.1% 0.2% October 14/11/2008 10:00 AM Europe Harm. Index of Consumer Prices yy 3.2% 3.6% October 14/11/2008 10:00 AM Europe Gross Domestic Product (GDP) qq -0.1% -0.2% Quarter 3 14/11/2008 10:00 AM Europe Gross Domestic Product (GDP) yy 0.7% 1.4% Quarter 3 14/11/2008 1:30 PM USA Import Prices -3.0% -3.0% October 14/11/2008 1:30 PM USA Retail Sales mm -1.0% -1.2% October 14/11/2008 1:30 PM USA Core Retail Sales mm -0.8% -0.6% October 14/11/2008 1:30 PM USA Export Prices -0.7% -1.0% October 14/11/2008 1:30 PM USA Fed Chairman Bernanke Speaks 14/11/2008 2:55 PM USA U.Michigan Consumer Sentiment 55.5 57.6 November 14/11/2008 3:00 PM USA Business Inventories 0.2% 0.3% September Results for the week of: 03/11/2008 - 07/11/2008 3 November 2008 - 7 November 2008 *GMT Time Date Hour Country Data Result Forecast Previous Period 03/11/2008 12:00 AM Japan Market Holiday 03/11/2008 2:30 AM Australia House Prices -0.5% -0.3% Quarter 3 03/11/2008 2:30 AM Australia Retail Sales mm -0.5% 0.6% September 03/11/2008 8:30 AM Swiss Manufacturing PMI 47.8 October 03/11/2008 8:55 AM Germany Manufacturing PMI 47.4 October 03/11/2008 9:00 AM Europe Manufacturing PMI 45.0 October 03/11/2008 9:30 AM U.K. Manufacturing PMI 41.0 October 03/11/2008 3:00 PM USA Consumer Spending -0.7% 0.0% September 03/11/2008 3:00 PM USA Manufacturing PMI 42.0 43.5 October 04/11/2008 3:30 AM Australia Interest Rate Decision 5.5% 6% November 04/11/2008 6:45 AM Swiss Consumer Price Index (CPI) mm 0.1% October 04/11/2008 6:45 AM Swiss Consumer Price Index (CPI) yy 2.9% October 04/11/2008 10:00 AM Europe Producer Price Index (PPI) yy 8.5% September 04/11/2008 10:00 AM Europe Producer Price Index (PPI) mm -0.5% September 04/11/2008 3:00 PM USA Durable Goods Orders September 04/11/2008 3:00 PM USA New orders XD September 04/11/2008 3:00 PM USA Factory Orders mm -1.9% -4.0% September 05/11/2008 12:30 AM Australia Building Permits -1.2% -3.7% September 05/11/2008 12:30 AM Australia International Trade Balance mm 0.6b 1.364b September 05/11/2008 8:55 AM Germany Services PMI 50.2 October 05/11/2008 9:00 AM Europe Services PMI 48.4 October 05/11/2008 9:30 AM U.K. Industrial Production mm -0.6% September 05/11/2008 9:30 AM U.K. Industrial Production yy -2.3% September 05/11/2008 9:30 AM U.K. Services PMI 46.0 October 05/11/2008 10:00 AM Europe Retail Sales mm 0.3% September 05/11/2008 10:00 AM Europe Retail Sales yy -1.8% September 05/11/2008 1:15 PM USA ADP employment -95.0K -8.0K October 05/11/2008 3:00 PM USA Services PMI 48 50.2 October 05/11/2008 9:45 PM New Zealand Unemployment Rate 4.3% 3.9% Quarter 3 05/11/2008 11:50 PM Japan Protocol of last interest rate meeting October 06/11/2008 12:30 AM Australia Unemployment Rate 4.4% 4.3% October 06/11/2008 2:30 AM Australia Non-Farm Payroll -10000 22000 October 06/11/2008 5:00 AM Japan Leading Economic Indicators -2.1 September 06/11/2008 11:00 AM Germany Factory Orders yy 3.6% September 06/11/2008 12:00 PM U.K. Interest Rate Decision 4.5% November 06/11/2008 12:45 PM Europe Interest Rate Decision 3.75% November 06/11/2008 1:30 PM Canada Building Permits -13.5% September 06/11/2008 1:30 PM USA Initial Jobless Claims Last Week 06/11/2008 3:00 PM Canada Services PMI 61.0 October 07/11/2008 6:45 AM Swiss Unemployment Rate 2.6% October 07/11/2008 7:00 AM Germany International Trade Balance mm 13.1b September 07/11/2008 11:00 AM Germany Industrial Production mm 3.4% September 07/11/2008 12:00 PM Canada Non-Farm Payroll 106.9k October 07/11/2008 12:00 PM Canada Unemployment Rate 6.1% October 07/11/2008 1:30 PM USA Non-Farm Payroll -178k -159k October 07/11/2008 1:30 PM USA Unemployment Rate 6.3% 6.1% October 07/11/2008 3:00 PM USA Pending Homes Sales -2.8% 7.4% September 07/11/2008 3:00 PM USA Wholsale Inventories 0.2% 0.8% September 07/11/2008 3:00 PM USA Wholesale Trade -1.0% September 07/11/2008 8:00 PM USA Consumer Credit mm 1.0b -7.88b September Results for the week of: 27/10/2008 - 31/10/2008 27 October 2008 - 31 October 2008 * GMT time Date Hour Country Data Result Forecast Previous Period 27/10/2008 12:00 AM New Zealand Market Holiday 27/10/2008 9:00 AM Europe M3 Money Supply yy 8.5% 8.8% September 27/10/2008 9:00 AM Germany IFO Business Climate: index 91.0 92.9 October 27/10/2008 2:00 PM USA New Home sales 0.46m 0.46m September 27/10/2008 4:00 PM USA Mid-West Mnfg Activity 103.5 September 27/10/2008 11:50 PM Japan Retail Sales yy 0.7% September 28/10/2008 7:00 AM Germany GFK Consumer Sentiment 1.8 November 28/10/2008 11:00 AM U.K. CBI Sales -27.0 October 28/10/2008 1:00 PM USA House Prices -1.0% -0.9% August 28/10/2008 2:00 PM USA Consumer Confidence 54.0 59.8 October 28/10/2008 2:00 PM USA Richmond Fed srvs -15 October 28/10/2008 11:50 PM Japan Industrial Production mm -3.5% September 29/10/2008 9:30 AM U.K. Consumer Credit mm 1.236b September 29/10/2008 12:30 PM USA New orders XD -5.3% September 29/10/2008 12:30 PM USA Durable Goods Orders -1.3% -4.8% September 29/10/2008 6:15 PM USA Interest Rate Decision 1.25% 1.5% October 29/10/2008 9:45 PM New Zealand International Trade Balance mm -750m September 29/10/2008 9:45 PM New Zealand International Trade Balance yy -4.28b September 29/10/2008 9:45 PM New Zealand Building Permits -7.9% September 30/10/2008 9:00 AM Germany Unemployment Rate 7.6% 7.6% October 30/10/2008 10:00 AM Europe Consumer Confidence -21.0 -19.0 October 30/10/2008 10:00 AM Europe Economic Sentiment 87.7 October 30/10/2008 10:00 AM Europe Industrial Sentiment -14.0 -12.0 October 30/10/2008 10:00 AM Europe Service Sentiment 0.0 October 30/10/2008 12:30 PM Canada Producer Price Index (PPI) mm -0.2% September 30/10/2008 12:30 PM Canada Producer Price Index (PPI) yy 8.1% September 30/10/2008 12:30 PM USA Core PCE qq 2.3% 2.2% Quarter 3 30/10/2008 12:30 PM USA Personal Consumption Exp. qq 4.3% Quarter 3 30/10/2008 12:30 PM USA Gross Domestic Product (GDP) mm -0.5% 2.8% Quarter 3 30/10/2008 12:30 PM USA Initial Jobless Claims 478.0k Last Week 30/10/2008 3:00 PM USA Kansas City Fed Survey -9.0 October 30/10/2008 11:15 PM Japan Manufacturing PMI 44.3 October 30/10/2008 11:30 PM Japan Consumer Price Index (CPI) yy 2.4% September 30/10/2008 11:30 PM Japan House'hold Spending -4.0% September 30/10/2008 11:30 PM Japan Unemployment Rate 4.2% September 31/10/2008 5:00 AM Japan Construction Orders -0.3% September 31/10/2008 5:00 AM Japan Interest Rate Decision 0.5% October 31/10/2008 5:00 AM Japan Housing Starts yy 53.6% September 31/10/2008 10:00 AM Europe Harm. Index of Consumer Prices yy 3.3% 3.6% October 31/10/2008 10:00 AM Europe Unemployment Rate 7.5% September 31/10/2008 10:30 AM U.K. GFK Consumer Sentiment -32.0 October 31/10/2008 10:30 AM Swiss KOF Purchasing Manager ind 0.62 October 31/10/2008 12:30 PM Canada Gross Domestic Product (GDP) mm 0.7% August 31/10/2008 12:30 PM Italy Personal Consumption -0.2% 0.0% September 31/10/2008 12:30 PM USA Core PCE mm 0.1% 0.2% September 31/10/2008 12:30 PM USA Core PCE yy 2.6% September 31/10/2008 12:30 PM USA Personal Consumption Exp. mm 0.0% September 31/10/2008 12:30 PM USA Personal Consumption Exp. yy 4.5% September 31/10/2008 12:30 PM USA Personal Income 0.2% 0.5% August 31/10/2008 1:45 PM USA Chicago PMI 51.5 56.7 October 31/10/2008 1:55 PM USA U.Michigan Consumer Sentiment 57.5 70.3 October Results for the week of: 20/10/2008 - 24/10/2008 20 October 2008 - 24 October 2008 *GMT time Date Hour Country Data Result Forecast Previous Period 20/10/2008 12:30 AM Australia Producer Price Index (PPI) mm 1% 1% Quarter 3 20/10/2008 12:30 AM Australia Producer Price Index (PPI) yy 4.7% 4.7% Quarter 3 20/10/2008 6:00 AM Germany Producer Price Index (PPI) mm -0.7% -0.6% September 20/10/2008 6:00 AM Germany Producer Price Index (PPI) yy 8.1% September 20/10/2008 8:30 AM U.K. Consumer Credit mm 10.371b September 20/10/2008 12:30 PM Canada Wholesale Trade 2.3% August 20/10/2008 12:30 PM Canada Wholsale Inventories 1.2% August 20/10/2008 2:00 PM USA Fed Chairman Bernanke Speaks 20/10/2008 2:00 PM USA Leading Economic Indicators -0.3% -0.5% September 20/10/2008 9:45 PM New Zealand Consumer Price Index (CPI) mm 1.5% 1.6% Quarter 3 20/10/2008 9:45 PM New Zealand Consumer Price Index (CPI) yy 5.1% 4.0% Quarter 3 21/10/2008 12:30 AM Australia Protocol of last interest rate meeting 21/10/2008 1:30 AM Australia Reserve Bank of Australia Governor Speech 21/10/2008 6:15 AM Swiss International Trade Balance mm 1441.8m September 21/10/2008 10:00 AM U.K. CBI Orders -26.0 October 21/10/2008 1:00 PM Canada Interest Rate Decision 2.5% October 22/10/2008 12:30 AM Australia Consumer Price Index (CPI) mm 1.0% 1.5% Quarter 3 22/10/2008 12:30 AM Australia Consumer Price Index (CPI) yy 4.8% 4.5% Quarter 3 22/10/2008 8:30 AM U.K. Protocol of last interest rate meeting 22/10/2008 12:30 PM Canada Retail Sales mm 0.1% August 22/10/2008 12:30 PM Canada Leading Economic Indicators 0.2% September 22/10/2008 12:30 PM Canada Core Retail Sales mm 0.4% August 22/10/2008 8:00 PM New Zealand Interest Rate Decision 6.5% 7.5% October 22/10/2008 11:50 PM Japan International Trade Balance mm -324.0b September 23/10/2008 8:00 AM Europe Capital Flow -19.1b August 23/10/2008 8:00 AM Europe Current Account -1.7b August 23/10/2008 8:30 AM U.K. Retail Sales mm 1.2% September 23/10/2008 8:30 AM U.K. Retail Sales yy 3.3% September 23/10/2008 9:00 AM Europe Factory Orders mm 1.0% August 23/10/2008 9:00 AM Europe Factory Orders yy 1.6% August 23/10/2008 12:30 PM USA Initial Jobless Claims 461.0k Last Week 24/10/2008 7:30 AM Germany Services PMI 49.2 50.2 October 24/10/2008 7:30 AM Germany Manufacturing PMI 47.0 47.4 October 24/10/2008 8:00 AM Europe Manufacturing PMI 44.0 45.0 October 24/10/2008 8:00 AM Europe Services PMI 47.2 48.4 October 24/10/2008 8:30 AM U.K. Gross Domestic Product (GDP) yy 1.5% Quarter 3 24/10/2008 8:30 AM U.K. Gross Domestic Product (GDP) qq 0.0% Quarter 3 24/10/2008 11:00 AM Canada Core CPI mm 0.3% September 24/10/2008 11:00 AM Canada Consumer Price Index (CPI) mm -0.2% September 24/10/2008 11:00 AM Canada Core CPI yy 1.7% September 24/10/2008 11:00 AM Canada Consumer Price Index (CPI) yy 3.5% September 24/10/2008 2:00 PM USA Existing Home Sales (Change) 4.88m 4.91m September Results for the week of: 12/10/2008 - 17/10/2008 12 October 2008 - 17 October 2008 *GMT time Date Hour Country Data Result Forecast Previous Period 12/10/2008 9:45 PM New Zealand Core Retail Sales mm 1.0% -0.2% August 12/10/2008 9:45 PM New Zealand Retail Sales mm 0.3% -0.8% August 12/10/2008 9:45 PM New Zealand Retail Sales yy 1.2% 2.5% August 13/10/2008 12:00 AM Japan Market Holiday 13/10/2008 12:00 AM Canada Market Holiday 13/10/2008 7:15 AM Swiss Producer Price Index (PPI) mm -0.3% -0.5% September 13/10/2008 7:15 AM Swiss Producer Price Index (PPI) yy 3.9% 4.0% September 13/10/2008 8:30 AM U.K. Core PPI mm 0.1% -0.1% September 13/10/2008 8:30 AM U.K. Core PPI yy 6.0% 6.3% September 13/10/2008 8:30 AM U.K. Producer Price Index (PPI) mm -1.5% -2.0% September 13/10/2008 8:30 AM U.K. Producer Price Index (PPI) yy 19.8% 26.2% September 14/10/2008 5:00 AM Japan Consumer Confidence 30.1 September 14/10/2008 8:25 AM U.K. Consumer Price Index (CPI) mm 0.6% September 14/10/2008 8:25 AM U.K. Retail Price Index (RPI) mm 0.3% September 14/10/2008 8:30 AM U.K. RPI ex. Mortgage (RPIX) mm 0.3% September 14/10/2008 8:30 AM U.K. RPI ex. Mortgage (RPIX) yy 5.2% September 14/10/2008 8:30 AM U.K. Consumer Price Index (CPI) yy 4.7% September 14/10/2008 8:30 AM U.K. Retail Price Index (RPI) yy 4.8% September 14/10/2008 9:00 AM Europe Industrial Production mm -0.3% August 14/10/2008 9:00 AM Europe Industrial Production yy -1.7% August 14/10/2008 9:00 AM Germany ZEW Economic Sentiment -41.1 October 14/10/2008 2:00 PM USA IBD Consumer Sentiment 45.8 October 14/10/2008 11:50 PM Japan Current Account -17.3% August 15/10/2008 4:30 AM Japan Capacity Utilization 1.4% August 15/10/2008 6:00 AM Germany Harm. Index of Consumer Prices mm -0.4% September 15/10/2008 6:00 AM Germany Harm. Index of Consumer Prices yy 3.3% September 15/10/2008 6:00 AM Germany Consumer Price Index (CPI) mm -0.3% September 15/10/2008 6:00 AM USA Consumer Price Index (CPI) yy 3.1% September 15/10/2008 8:30 AM U.K. Initial Jobless Claims 32.5k September 15/10/2008 8:30 AM U.K. Unemployment Rate 5.5% August 15/10/2008 9:00 AM Europe Harm. Index of Consumer Prices mm -0.1% September 15/10/2008 9:00 AM Europe Harm. Index of Consumer Prices yy 3.8% September 15/10/2008 9:00 AM Europe Core HICP mm 0.3% September 15/10/2008 9:00 AM Europe Core HICP yy 2.6% September 15/10/2008 10:00 AM U.K. CBI Orders -26.0 October 15/10/2008 12:30 PM USA Producer Price Index (PPI) mm -0.3% -0.9% September 15/10/2008 12:30 PM USA Core PPI mm 0.2% 0.2% September 15/10/2008 12:30 PM USA Core PPI yy 3.6% September 15/10/2008 12:30 PM USA Core Retail Sales mm -0.3% -0.7% September 15/10/2008 12:30 PM USA Retail Sales mm -0.6% -0.3% September 15/10/2008 12:30 PM USA New-York Fed Survey -7.5 -7.41 October 15/10/2008 12:30 PM USA Producer Price Index (PPI) yy 9.6% September 15/10/2008 2:00 PM USA Business Inventories 0.5% 1.1% August 15/10/2008 4:00 PM USA Fed Chairman Bernanke Speaks 16/10/2008 1:30 AM Australia Export Prices 13.5% Quarter 3 16/10/2008 1:30 AM Australia Import Prices 1.4% Quarter 3 16/10/2008 7:15 AM Swiss Retail Sales mm 6.2% August 16/10/2008 9:00 AM Swiss ZEW Economic Sentiment -44.4 October 16/10/2008 12:30 PM USA Core CPI yy 2.5% 2.5% September 16/10/2008 12:30 PM USA Core CPI mm 0.2% 0.2% September 16/10/2008 12:30 PM USA Consumer Price Index (CPI) yy 5.0% 5.4% September 16/10/2008 12:30 PM USA Consumer Price Index (CPI) mm 0.0% -0.1% September 16/10/2008 12:30 PM USA Initial Jobless Claims Last Week 16/10/2008 1:00 PM USA Capital Flow -74.8b August 16/10/2008 1:15 PM USA Capacity Utilization 78.3% 78.7% September 16/10/2008 1:15 PM USA Industrial Production mm -0.5% -1.1% September 16/10/2008 2:00 PM USA Philadelphia Fed Survey -2.0 3.8 October 17/10/2008 9:00 AM Europe International Trade Balance mm -2.3b August 17/10/2008 12:30 PM USA Building Permits 0.85m 0.857m September 17/10/2008 12:30 PM USA Housing Starts yy 0.88m 0.895m September 17/10/2008 1:55 PM USA U.Michigan Consumer Sentiment 68.0 70.3 October Results for the week of: 06/10/2008 - 10/10/2008 6 October 2008 - 10 October 2008 * GMT Time Date Hour Country Data Result Forecast Previous Period 06/10/2008 12:00 AM Australia Market Holiday 06/10/2008 12:30 PM Canada Building Permits 1.8% August 06/10/2008 2:00 PM Canada Services PMI 51.5 September 07/10/2008 12:00 AM Japan Interest Rate Decision October 07/10/2008 4:30 AM Australia Interest Rate Decision 7.00% October 07/10/2008 5:00 AM Japan Leading Economic Indicators 0.6 August 07/10/2008 8:30 AM U.K. Industrial Production mm -0.4% August 07/10/2008 8:30 AM U.K. Industrial Production yy -1.9% August 07/10/2008 10:00 AM Germany Factory Orders mm -1.7% August 07/10/2008 4:30 PM USA Fed Chairman Bernanke Speaks 07/10/2008 7:00 PM USA Consumer Credit mm 4.56b August 08/10/2008 12:30 AM Australia Consumer Confidence 7.0% October 08/10/2008 9:00 AM Europe Gross Domestic Product (GDP) qq 0.7% Quarter 2 08/10/2008 9:00 AM Europe Gross Domestic Product (GDP) yy 2.1% Quarter 2 08/10/2008 10:00 AM Germany Industrial Production mm -1.8% August 08/10/2008 12:15 PM Canada Housing Starts yy 211.0k September 08/10/2008 2:00 PM USA Pending Homes Sales 86.5 August 09/10/2008 12:30 AM Australia Unemployment Rate 4.1% September 09/10/2008 6:00 AM Germany International Trade Balance mm 11.8b August 09/10/2008 8:30 AM U.K. International Trade Balance mm -7.667b August 09/10/2008 11:00 AM U.K. Interest Rate Decision 5.0% October 09/10/2008 12:30 PM USA Initial Jobless Claims Last Week 09/10/2008 2:00 PM USA Wholsale Inventories 1.4% August 09/10/2008 2:00 PM USA Wholesale Trade -0.3% August 09/10/2008 11:50 PM Japan Protocol of last interest rate meeting September 10/10/2008 5:45 AM Swiss Unemployment Rate 2.5% September 10/10/2008 11:00 AM Canada Non-Farm Payroll 15.2k September 10/10/2008 11:00 AM Canada Unemployment Rate 6.1% September 10/10/2008 12:30 PM Canada International Trade Balance mm August 10/10/2008 12:30 PM Canada House Prices August 10/10/2008 12:30 PM USA Export Prices September 10/10/2008 12:30 PM USA Import Prices September 10/10/2008 12:30 PM USA International Trade Balance mm August 10/10/2008 6:00 PM USA Budget September Results for the week of: 28/09/2008 - 3/10/2008 28 September 2008 - 3 October 2008 *GMT Time Date Hour Country Data Result Forecast Previous Period 28/09/2008 9:45 PM New Zealand International Trade Balance mm -750m -912m -781m August 28/09/2008 11:50 PM Japan Retail Sales yy 0.7% 0.2% 1.9% August 29/09/2008 9:00 AM Europe Economic Sentiment 87.7 87.5 88.8 September 29/09/2008 9:00 AM Europe Industrial Sentiment -12 -12.0 -10.0 September 29/09/2008 9:00 AM Europe Service Sentiment 0 1.0 3.0 September 29/09/2008 12:30 PM USA Personal Consumption 0.0% 0.2% 0.2% August 29/09/2008 12:30 PM USA Core PCE mm 0.2% 0.2% 0.3% August 29/09/2008 12:30 PM USA Core PCE yy 2.6% 2.4% August 29/09/2008 12:30 PM USA Personal Consumption Exp. mm 0.0% 0.6% August 29/09/2008 12:30 PM USA Personal Consumption Exp. yy 4.5% 4.5% August 29/09/2008 12:30 PM USA Personal Income 0.5% 0.2% -0.7% August 29/09/2008 4:00 PM USA Mid-West Mnfg Activity 103.5 106.3 August 29/09/2008 9:45 PM New Zealand Building Permits 4.7% August 29/09/2008 10:30 PM Japan Unemployment Rate 4.1% 4.0% August 29/09/2008 11:15 PM Japan Manufacturing PMI 46.9 September 29/09/2008 11:30 PM Japan House'hold Spending -1.3% -0.5% August 30/09/2008 1:30 AM Australia Building Permits -1.0% -2.3% August 30/09/2008 1:30 AM Australia Retail Sales mm 0.1% 0.1% August 30/09/2008 5:00 AM Japan Construction Orders 42.3% August 30/09/2008 5:00 AM Japan Housing Starts yy 19.0% August 30/09/2008 8:00 AM Germany Unemployment Rate 7.6% September 30/09/2008 8:30 AM U.K. Gross Domestic Product (GDP) yy 1.4% Quarter 2 30/09/2008 8:30 AM U.K. Current Account -8.4b Quarter 2 30/09/2008 8:30 AM U.K. Gross Domestic Product (GDP) qq 0.0% Quarter 2 30/09/2008 9:00 AM Europe Harm. Index of Consumer Prices yy 3.8% September 30/09/2008 12:30 PM Canada Gross Domestic Product (GDP) mm 0.1% July 30/09/2008 12:30 PM Canada Producer Price Index (PPI) mm 0.4% August 30/09/2008 12:30 PM Canada Producer Price Index (PPI) yy 6.8% August 30/09/2008 1:00 PM USA House Prices -0.5% July 30/09/2008 1:45 PM USA Chicago PMI 57.9 September 30/09/2008 2:00 PM USA Consumer Confidence 56.9 September 30/09/2008 11:00 PM U.K. GFK Consumer Sentiment -36.0 September 30/09/2008 11:50 PM Japan Tankan Survey 2.4% Quarter 3 01/10/2008 7:30 AM Swiss Manufacturing PMI 50.9 52.5 September 01/10/2008 7:55 AM Germany Manufacturing PMI 48.1 49.7 September 01/10/2008 8:00 AM Europe Manufacturing PMI 45.3 47.6 September 01/10/2008 8:30 AM U.K. Manufacturing PMI 45.0 45.9 September 01/10/2008 9:00 AM Europe Unemployment Rate 7.3% 7.3% August 01/10/2008 12:15 PM USA ADP employment -55.0 -33.0K September 01/10/2008 2:00 PM USA Construction Spending -0.5% -0.6% August 01/10/2008 2:00 PM USA Manufacturing PMI 50.0 49.9 September 02/10/2008 1:30 AM Australia International Trade Balance mm -717m August 02/10/2008 9:00 AM Europe Producer Price Index (PPI) yy 8.5% 9.0% August 02/10/2008 9:00 AM Europe Producer Price Index (PPI) mm -0.5% 1.1% August 02/10/2008 11:45 AM Europe Interest Rate Decision 4.25% 4.25% October 02/10/2008 12:30 PM USA Initial Jobless Claims 493.0k Last Week 02/10/2008 2:00 PM USA Factory Orders mm -1.0% 1.3% August 02/10/2008 2:00 PM USA Durable Goods Orders -4.5% August 02/10/2008 2:00 PM USA New orders XD -5.0% August 03/10/2008 5:45 AM Swiss Consumer Price Index (CPI) mm -0.1% -0.3% September 03/10/2008 5:45 AM Swiss Consumer Price Index (CPI) yy 2.7% 2.9% September 03/10/2008 7:55 AM Germany Services PMI 49.3 51.4 September 03/10/2008 8:00 AM Europe Services PMI 48.2 48.5 September 03/10/2008 8:30 AM U.K. Services PMI 48.0 49.2 September 03/10/2008 9:00 AM Europe Retail Price Index (RPI) yy -2.4% -2.8% August 03/10/2008 9:00 AM Europe Retail Sales mm 0.1% -0.4% August 03/10/2008 12:30 PM USA Non-Farm Payroll -85.0 -84.0k September 03/10/2008 12:30 PM USA Unemployment Rate 6.1% 6.1% September 03/10/2008 2:00 PM USA Services PMI 50.0 50.6 September Results for the week of: 21/09/2008 - 26/09/2008 21 September 2008 - 26 September 2008 *GMT Time Date Hour Country Data Result Forecast Previous Period 21/09/2008 11:50 PM Japan Protocol of last interest rate meeting August 21/09/2008 11:50 PM Japan Industrial Sentiment January 22/09/2008 12:30 PM Canada Core Retail Sales mm 1.4% July 22/09/2008 12:30 PM Canada Retail Sales mm 0.5% July 23/09/2008 12:00 AM Japan Market Holiday 23/09/2008 7:30 AM Germany Services PMI - prel 51.4 September 23/09/2008 7:30 AM Germany Manufacturing PMI - prel 49.7 September 23/09/2008 8:00 AM Europe Manufacturing PMI 47.6 September 23/09/2008 8:00 AM Europe Services PMI 48.5 September 23/09/2008 9:00 AM Europe Factory Orders mm -0.3% July 23/09/2008 9:00 AM Europe Factory Orders yy -7.4% July 23/09/2008 11:00 AM Canada Consumer Price Index (CPI) mm 0.3% August 23/09/2008 11:00 AM Canada Consumer Price Index (CPI) yy 3.4% August 23/09/2008 11:00 AM Canada Core CPI mm 0.1% August 23/09/2008 11:00 AM Canada Core CPI yy 1.5% August 24/09/2008 8:00 AM Europe Capital Flow 32.2b July 24/09/2008 8:00 AM Europe Current Account -8.2b July 24/09/2008 8:00 AM Germany IFO Business Climate: index 94.8 September 24/09/2008 2:00 PM USA Existing Home Sales (Change) 5.0m August 24/09/2008 11:50 PM Japan International Trade Balance mm 91.1b August 25/09/2008 12:00 AM USA Building Permits August 25/09/2008 1:30 AM Australia Reserve Bank of Australia Governor Speech 25/09/2008 6:00 AM Germany GFK Consumer Sentiment 1.5 October 25/09/2008 8:00 AM Europe M3 Money Supply yy 9.3% August 25/09/2008 12:30 PM USA New orders XD 2.9% August 25/09/2008 12:30 PM USA Durable Goods Orders 1.3% August 25/09/2008 12:30 PM USA Initial Jobless Claims Last Week 25/09/2008 2:00 PM USA New Home sales 0.515m August 25/09/2008 3:00 PM USA KC Fed 6.0 September 25/09/2008 10:45 PM New Zealand Gross Domestic Product (GDP) yy 0.8% 1.9% Quarter 2 25/09/2008 10:45 PM New Zealand Gross Domestic Product (GDP) qq -0.3% -0.3% Quarter 2 25/09/2008 11:30 PM Japan Consumer Price Index (CPI) yy 2.4% August 25/09/2008 11:30 PM Japan Consumer Price Index (CPI) mm 2.3% August 26/09/2008 9:30 AM Swiss KOF Purchasing Manager ind 0.68 September 26/09/2008 12:30 PM USA Core PCE qq 2.1% Quarter 2 26/09/2008 12:30 PM USA Gross Domestic Product (GDP) qq 3.3% Quarter 2 26/09/2008 12:30 PM USA Personal Consumption Exp. qq 4.2% Quarter 2 26/09/2008 1:55 PM USA U.Michigan Consumer Sentiment 63.0 September Results for the week of: 15/09/2008 - 19/09/2008 15 September 2008 - 19 September 2008 *GMT time Date Hour Country Data Result Forecast Previous Period 15/09/2008 12:00 AM Japan Market Holiday 15/09/2008 7:15 AM Swiss Producer Price Index (PPI) mm -0.5% -0.2% 0.5% August 15/09/2008 7:15 AM Swiss Retail Sales mm 6.2% 2.4% 0.7% July 15/09/2008 7:15 AM Swiss Producer Price Index (PPI) yy 4.0% 4.4% 4.9% August 15/09/2008 12:30 PM USA New-York Fed Survey -7.41 1.5 2.77 September 15/09/2008 1:15 PM USA Capacity Utilization 78.7% 79.6% 79.9% August 15/09/2008 1:15 PM USA Industrial Production mm -1.1% -0.3% 0.2% August 16/09/2008 1:30 AM Australia Protocol of last interest rate meeting 16/09/2008 3:00 AM Japan Interest Rate Decision 0.5% September 16/09/2008 5:00 AM Japan Consumer Confidence 31.4 August 16/09/2008 6:00 AM Germany Consumer Price Index (CPI) yy 3.3% August 16/09/2008 6:00 AM Germany Harm. Index of Consumer Prices mm 0.7% August 16/09/2008 6:00 AM Germany Harm. Index of Consumer Prices yy 3.5% August 16/09/2008 6:00 AM Germany Consumer Price Index (CPI) mm 0.6% August 16/09/2008 7:15 AM Swiss Factory Orders yy 5.3% Quarter 2 16/09/2008 8:30 AM U.K. RPI ex. Mortgage (RPIX) yy 5.3% August 16/09/2008 8:30 AM U.K. Consumer Price Index (CPI) mm 0.0% August 16/09/2008 8:30 AM U.K. Retail Price Index (RPI) yy 5.0% August 16/09/2008 8:30 AM U.K. Consumer Price Index (CPI) yy 4.4% August 16/09/2008 8:30 AM U.K. RPI ex. Mortgage (RPIX) mm -0.2% August 16/09/2008 8:30 AM U.K. Retail Price Index (RPI) mm -0.1% August 16/09/2008 9:00 AM Europe Core HICP mm -0.4% August 16/09/2008 9:00 AM Europe Core HICP yy 2.5% August 16/09/2008 9:00 AM Europe Harm. Index of Consumer Prices mm -0.2% -0.2% August 16/09/2008 9:00 AM Europe Harm. Index of Consumer Prices yy 3.8% 4.0% August 16/09/2008 9:00 AM Germany ZEW Economic Sentiment -54.0 -55.5 September 16/09/2008 12:30 PM USA Core CPI mm 0.2% 0.3% August 16/09/2008 12:30 PM USA Consumer Price Index (CPI) mm 0.0% 0.8% August 16/09/2008 12:30 PM USA Core CPI yy 2.6% 2.5% August 16/09/2008 12:30 PM USA Consumer Price Index (CPI) yy 5.6% 5.6% August 16/09/2008 1:00 PM USA Capital Flow 51.1b July 16/09/2008 6:15 PM USA Interest Rate Decision 2.0% 2.0% September 17/09/2008 3:30 AM Australia Reserve Bank of Australia Governor Speech 17/09/2008 8:30 AM U.K. Unemployment Rate 5.4% July 17/09/2008 8:30 AM U.K. Protocol of last interest rate meeting 17/09/2008 8:30 AM U.K. Initial Jobless Claims 20.1k August 17/09/2008 9:00 AM Europe International Trade Balance mm -0.1b July 17/09/2008 9:00 AM Swiss ZEW Economic Sentiment -79.6 September 17/09/2008 10:00 AM U.K. CBI Orders -13.0 September 17/09/2008 12:30 PM USA Housing Starts yy 0.96m 0.965m August 17/09/2008 12:30 PM USA Current Account -179.4b -176.4b Quarter 2 17/09/2008 12:30 PM USA Building Permits 0.93m 0.937m August 17/09/2008 11:30 PM Japan Tankan Survey -16 September 18/09/2008 6:15 AM Swiss International Trade Balance mm 2369.0m August 18/09/2008 8:30 AM U.K. Consumer Credit mm -4.835b August 18/09/2008 8:30 AM U.K. Retail Sales mm 0.8% August 18/09/2008 8:30 AM U.K. Retail Sales yy 2.1% August 18/09/2008 12:00 PM Swiss Interest Rate Decision 2.75% 2.75% Quarter 3 18/09/2008 12:30 PM Canada Leading Economic Indicators 0.0% August 18/09/2008 12:30 PM Canada Wholesale Trade 2.0% July 18/09/2008 12:30 PM USA Initial Jobless Claims Last Week 18/09/2008 2:00 PM USA Leading Economic Indicators -0.2% -0.7% August 18/09/2008 2:00 PM USA Philadelphia Fed Survey -10.0 -12.7 September 18/09/2008 10:45 PM New Zealand Current Account -3.303b -2.160b Quarter 2 19/09/2008 6:00 AM Germany Producer Price Index (PPI) yy 8.9% August 19/09/2008 6:00 AM Germany Producer Price Index (PPI) mm 2.0% August Results for the week of: 7/09/2008 - 12/09/2008 7 September 2008 - 12 September 2008 * GMT Time Date Hour Country Data Result Forecast Previous Period 07/09/2008 11:00 PM Australia Reserve Bank of Australia Governor Speech 08/09/2008 5:45 AM Swiss Unemployment Rate 2.5% 2.5% August 08/09/2008 12:30 PM Canada Building Permits -5.3% July 08/09/2008 7:00 PM USA Consumer Credit mm 8.25b 14.33b July 09/09/2008 1:30 AM Australia Retail Sales mm -1.0% July 09/09/2008 6:00 AM Germany Export mm 4.2% July 09/09/2008 6:00 AM Germany Import mm -0.1% July 09/09/2008 6:00 AM Germany International Trade Balance mm 17.6b 18.1b July 09/09/2008 8:30 AM U.K. Producer Price Index (PPI) mm -1.0% -0.6% August 09/09/2008 8:30 AM U.K. Producer Price Index (PPI) yy 29.1% 30.1% August 09/09/2008 8:30 AM U.K. Core PPI mm 0.3% 0.3% August 09/09/2008 8:30 AM U.K. Industrial Production mm -0.2% -0.2% July 09/09/2008 8:30 AM U.K. Core PPI yy 6.5% 6.6% August 09/09/2008 8:30 AM U.K. Industrial Production yy -1.5% -1.6% July 09/09/2008 12:15 PM Canada Housing Starts yy 186.5k August 09/09/2008 2:00 PM USA IBD Consumer Sentiment 42.8 September 09/09/2008 2:00 PM USA Wholsale Inventories 0.6% 1.1% July 09/09/2008 2:00 PM USA Wholesale Trade 2.8% July 09/09/2008 2:00 PM USA Pending Homes Sales 89.0 July 09/09/2008 11:50 PM Japan International Trade Balance mm -81.3% July 09/09/2008 11:50 PM Japan Current Account -28.7% -67.4% July 10/09/2008 12:30 AM Australia Consumer Confidence 9.1% September 10/09/2008 5:00 AM Japan Leading Economic Indicators 0.6% -1.7% July 10/09/2008 8:30 AM U.K. International Trade Balance mm -7.5b -7.684b July 10/09/2008 9:00 PM New Zealand Interest Rate Decision 7.75% 8.0% September 10/09/2008 11:50 PM Japan Machinery Orders mm -4.4% -2.6% July 11/09/2008 1:30 AM Australia Non-Farm Payroll 10900 August 11/09/2008 1:30 AM Australia Unemployment Rate 4.3% August 11/09/2008 11:30 AM USA Import mm -1.0% 1.7% August 11/09/2008 12:30 PM Canada Export mm 43.16b July 11/09/2008 12:30 PM Canada Import mm 37.4b July 11/09/2008 12:30 PM Canada International Trade Balance mm 5.76b July 11/09/2008 12:30 PM Canada International Trade Balance mm 5.76b July 11/09/2008 12:30 PM USA Initial Jobless Claims 444.0k Last Week 11/09/2008 12:30 PM USA International Trade Balance mm -58.0b -56.77b July 11/09/2008 12:30 PM USA Export mm 0.4% 1.4% August 11/09/2008 10:45 PM New Zealand Retail Sales yy 1.9% 1.5% July 11/09/2008 10:45 PM New Zealand Core Retail Sales mm 0.2% 0.0% July 11/09/2008 10:45 PM New Zealand Retail Price Index (RPI) mm 0.0% July 11/09/2008 11:50 PM Japan Gross Domestic Product (GDP) qq -0.6% Quarter 2 11/09/2008 11:50 PM Japan Gross Domestic Product (GDP) yy -2.4% Quarter 2 12/09/2008 9:00 AM Europe Industrial Production mm 0.1% 0.0% July 12/09/2008 9:00 AM Europe Industrial Production yy -0.5% July 12/09/2008 12:30 PM USA Core Retail Sales mm 0.0% 0.4% August 12/09/2008 12:30 PM USA Retail Sales mm 0.2% -0.1% August 12/09/2008 12:30 PM USA Producer Price Index (PPI) yy 9.8% August 12/09/2008 12:30 PM USA Producer Price Index (PPI) mm -0.2% 1.2% August 12/09/2008 12:30 PM USA Core PPI mm 0.2% 0.7% August 12/09/2008 12:30 PM USA Core PPI yy 3.5% August 12/09/2008 1:55 PM USA U.Michigan Consumer Sentiment 63.7 63.0 September 12/09/2008 2:00 PM USA Business Inventories 0.5% 0.7% July Results for the week of: 1/09/2008 - 05/09/2008 1 September 2008 - 5 September 2008 * GMT Time Date Hour Country Data Result Forecast Previous Period 01/09/2008 12:00 AM Canada Market Holiday 01/09/2008 12:00 AM USA Market Holiday 01/09/2008 1:30 AM Australia Current Account -19492M Quarter 2 01/09/2008 7:30 AM Swiss Manufacturing PMI 53.3 54.1 August 01/09/2008 7:55 AM Germany Manufacturing PMI 49.9 50.9 August 01/09/2008 8:00 AM Europe Manufacturing PMI 47.5 47.4 August 01/09/2008 8:30 AM U.K. Consumer Credit mm 0.8b 0.872b July 01/09/2008 8:30 AM U.K. Manufacturing PMI 47.0 44.3 August 02/09/2008 1:30 AM Australia Retail Sales mm -1% July 02/09/2008 4:30 AM Australia Interest Rate Decision 7.0% 7.25% September 02/09/2008 5:45 AM Swiss Consumer Price Index (CPI) mm -0.2% -0.4% August 02/09/2008 5:45 AM Swiss Consumer Price Index (CPI) yy 3.1% 3.1% August 02/09/2008 5:45 AM Swiss Gross Domestic Product (GDP) qq 0.2% 0.3% Quarter 2 02/09/2008 5:45 AM Swiss Gross Domestic Product (GDP) yy 2.4% 3.0% Quarter 2 02/09/2008 6:00 AM Germany Retail Sales mm -0.5% -1.4% July 02/09/2008 6:00 AM Germany Retail Sales yy -2.0% -3.9% July 02/09/2008 9:00 AM Europe Producer Price Index (PPI) yy 9.2% 8.0% July 02/09/2008 9:00 AM Europe Producer Price Index (PPI) mm 1.3% 0.9% July 02/09/2008 2:00 PM USA Construction Spending -0.4% -0.4% July 02/09/2008 2:00 PM USA Manufacturing PMI 49.9 50 August 03/09/2008 1:30 AM Australia Gross Domestic Product (GDP) qq 0.4% 0.6% Quarter 2 03/09/2008 1:30 AM Australia Gross Domestic Product (GDP) yy 2.9% 3.6% Quarter 2 03/09/2008 7:55 AM Germany Services PMI 50.6 53.1 August 03/09/2008 8:00 AM Europe Services PMI 48.2 48.3 August 03/09/2008 8:30 AM U.K. Services PMI 47.0 47.4 August 03/09/2008 9:00 AM Europe Gross Domestic Product (GDP) yy 1.5% 2.1% Quarter 2 03/09/2008 9:00 AM Europe Retail Sales yy -2.1% -3.1% July 03/09/2008 9:00 AM Europe Gross Domestic Product (GDP) qq -0.2% 0.7% Quarter 2 03/09/2008 9:00 AM Europe Retail Sales mm 0.1% -0.6% July 03/09/2008 1:00 PM Canada Interest Rate Decision 3.0% August 03/09/2008 2:00 PM USA Durable Goods Orders 0.1% 1.3% July 03/09/2008 2:00 PM USA New orders XD 2.8% July 03/09/2008 2:00 PM USA Factory Orders mm 0.4% 1.7% July 03/09/2008 6:00 PM USA Fed Beige Book 04/09/2008 1:30 AM Australia International Trade Balance mm 108m 411m July 04/09/2008 10:00 AM Germany Factory Orders mm 0.4% -2.9% July 04/09/2008 11:00 AM U.K. Interest Rate Decision 5.0% 5.0% September 04/09/2008 11:45 AM Europe Interest Rate Decision 4.25% 4.25% September 04/09/2008 12:15 PM USA ADP employment -20.0k 9.0k August 04/09/2008 12:30 PM USA Initial Jobless Claims 425.0k Last Week 04/09/2008 2:00 PM USA Services PMI 50 49.6 August 05/09/2008 10:00 AM Germany Industrial Production mm -0.5% 0.2% July 05/09/2008 11:00 AM Canada Non-Farm Payroll -55.2k August 05/09/2008 11:00 AM Canada Unemployment Rate 6.1% August 05/09/2008 12:30 PM USA Non-Farm Payroll -73.0k -51.0k August 05/09/2008 12:30 PM USA Unemployment Rate 5.7% 5.7% August 05/09/2008 2:00 PM Canada Services PMI 65.5 August Results for the week of: 25/08/2008 - 29/08/2008 25 August 2008 - 29 August 2008 * GMT Time 25/08/2008 12:00 AM U.K. Market Holiday 25/08/2008 2:00 PM USA Existing Home Sales (Units) 4.9m 4.86m July 26/08/2008 6:00 AM Germany GFK Consumer Sentiment 2.1 September 26/08/2008 6:00 AM Germany Gross Domestic Product (GDP) qq 1.3% Quarter 2 26/08/2008 6:00 AM Germany Gross Domestic Product (GDP) yy 1.8% Quarter 2 26/08/2008 8:00 AM Germany IFO Business Climate: index 97.6 97.5 August 26/08/2008 1:00 PM USA House Prices -0.7% -0.9% June 26/08/2008 2:00 PM USA New Home sales 0.53m 0.53m July 26/08/2008 2:00 PM USA Richmond Fed ships -16.0 August 26/08/2008 2:00 PM USA Consumer Confidence 53.0 51.9 August 26/08/2008 2:00 PM USA Richmond Fed srvs -15.0 August 26/08/2008 6:00 PM USA Protocol of last interest rate meeting 26/08/2008 10:45 PM New Zealand International Trade Balance mm -223m July 26/08/2008 10:45 PM New Zealand International Trade Balance yy -4.48b July 27/08/2008 12:30 PM USA New orders XD 0.0% 0.0% July 27/08/2008 12:30 PM USA Durable Goods Orders 0.2% 0.8% July 27/08/2008 4:00 PM USA Mid-West Mnfg Activity 106.0 July 28/08/2008 7:15 AM Swiss Non-Farm Payroll 3.899m Quarter 2 28/08/2008 8:00 AM Europe M3 Money Supply yy 9.9% July 28/08/2008 8:00 AM Germany Unemployment Rate 7.8% August 28/08/2008 9:00 AM Europe Industrial Sentiment -8.0 August 28/08/2008 9:00 AM Europe Service Sentiment 1.0 August 28/08/2008 10:00 AM U.K. CBI Sales -36 August 28/08/2008 12:30 PM Canada Current Account 5.56b Quarter 2 28/08/2008 12:30 PM USA Gross Domestic Product (GDP) qq 2.6% 1.9% Quarter 2 28/08/2008 12:30 PM USA Initial Jobless Claims Last Week 28/08/2008 12:30 PM USA Personal Consumption Exp. qq 4.2% 4.2% Quarter 2 28/08/2008 12:30 PM USA Core PCE qq 2.2% 2.1% Quarter 2 28/08/2008 3:00 PM USA KC Fed 21 August 28/08/2008 10:45 PM New Zealand Building Permits -20.1% July 28/08/2008 11:15 PM Japan Manufacturing PMI 47.0 August 28/08/2008 11:30 PM Japan Unemployment 4.1% July 28/08/2008 11:30 PM Japan House'hold Spending -1.8% July 28/08/2008 11:30 PM Japan Consumer Price Index (CPI) mm 1.9% July 28/08/2008 11:50 PM Japan Retail Sales yy 0.3% July 29/08/2008 5:00 AM Japan Housing Starts yy -16.7% July 29/08/2008 5:00 AM Japan Construction Orders -11.7% July 29/08/2008 9:00 AM Europe Unemployment 7.3% July 29/08/2008 9:00 AM Europe Harm. Index of Consumer Prices mm 4.0% 4.0% August 29/08/2008 9:30 AM Swiss KOF Purchasing Manager ind 0.9 August 29/08/2008 12:30 PM Canada Gross Domestic Product (GDP) qq -0.1% Quarter 2 29/08/2008 12:30 PM Canada Producer Price Index (PPI) mm 1.3% July 29/08/2008 12:30 PM Canada Gross Domestic Product (GDP) yy 5.4% July 29/08/2008 12:30 PM Canada Gross Domestic Product (GDP) mm -0.1% June 29/08/2008 12:30 PM USA Personal Consumption 0.2% 0.6% July 29/08/2008 12:30 PM USA Personal Consumption Exp. mm 0.8% July 29/08/2008 12:30 PM USA Core PCE mm 0.3% 0.3% July 29/08/2008 12:30 PM USA Core PCE yy 2.3% July 29/08/2008 12:30 PM USA Personal Income 0.1% 0.1% July 29/08/2008 1:45 PM USA Chicago PMI 50.5 50.8 August 29/08/2008 1:55 PM USA U.Michigan Consumer Sentiment 62 61.2 August Results for the week of: 18/08/2008 - 22/08/2008 18 August 2008 - 22 August 2008 * GMT Time Date Hour Country Data Result Forecast Previous Period 18/08/2008 7:15 AM Swiss Retail Sales mm 7.4% June 18/08/2008 7:30 AM Germany Services PMI 52.6 53.1 August 19/08/2008 12:00 AM Japan Interest Rate Decision 0.5% August 19/08/2008 6:00 AM Germany Producer Price Index (PPI) mm 0.6% 0.9% July 19/08/2008 9:00 AM Germany Producer Price Index (PPI) yy 7.4% 6.7% July 19/08/2008 12:30 PM Canada Wholesale Trade 1.6% June 19/08/2008 12:30 PM USA Core PPI mm 0.2% 0.2% July 19/08/2008 12:30 PM USA Housing Starts yy 0.96m 1.066m July 19/08/2008 12:30 PM USA Producer Price Index (PPI) yy 9.2% July 19/08/2008 12:30 PM USA Core PPI yy 3.0% July 19/08/2008 12:30 PM USA Producer Price Index (PPI) mm 0.5% 1.8% July 20/08/2008 10:00 AM U.K. CBI Orders -8.0 August 20/08/2008 12:30 PM Canada Leading Economic Indicators 0.0% July 20/08/2008 12:30 PM Canada Retail Sales mm 0.4% June 20/08/2008 11:50 PM Japan International Trade Balance mm 138.6b July 21/08/2008 6:15 AM Swiss International Trade Balance mm 2412.8m July 21/08/2008 7:15 AM Swiss Core PPI mm 0.6% July 21/08/2008 7:15 AM Swiss Core PPI yy 4.5% July 21/08/2008 7:30 AM Germany Manufacturing PMI 50.5 50.9 August 21/08/2008 7:30 AM Germany Composite PMI 52.1 August 21/08/2008 8:00 AM Europe Composite PMI 47.8 August 21/08/2008 8:00 AM Europe Manufacturing PMI 46.9 47.4 August 21/08/2008 8:00 AM Europe Services PMI 48.0 48.3 August 21/08/2008 8:30 AM U.K. Retail Sales mm -3.9% July 21/08/2008 8:30 AM U.K. Retail Sales yy 2.2% July 21/08/2008 9:00 AM Swiss ZEW Economic Sentiment -76.9 August 21/08/2008 11:00 AM Canada Consumer Price Index (CPI) mm 0.7% July 21/08/2008 11:00 AM Canada Consumer Price Index (CPI) yy 3.1% July 21/08/2008 11:00 AM Canada Core CPI mm 0.1% July 21/08/2008 12:30 PM USA Jobless Claims 4-weeks 450.0K Last Week 21/08/2008 2:00 PM USA Leading Economic Indicators -0.1% -0.1% July 21/08/2008 2:00 PM USA Philadelphia Fed Survey -11.5 -16.3 August 21/08/2008 11:50 PM Japan Protocol of last interest rate meeting July 22/08/2008 8:00 AM Europe Capital Flow 12.6b June 22/08/2008 8:00 AM Europe Current Account -7.3b June 22/08/2008 8:30 AM U.K. Gross Domestic Product (GDP) qq 0.2% Quarter 2 22/08/2008 8:30 AM U.K. Gross Domestic Product (GDP) yy 1.6% Quarter 2 22/08/2008 9:00 AM Europe New orders XD -3.5% June 22/08/2008 9:00 AM Europe New orders XD -4.4% June Results for the week of: 11/08/2008 - 15/08/2008 11 August 2008 - 15 August 2008 * GMT Time Date Hour Country Data Result Forecast Previous Period 11/08/2008 8:30 AM U.K. Producer Price Index (PPI) mm 0.9% July 11/08/2008 8:30 AM U.K. Producer Price Index (PPI) yy 10.0% July 11/08/2008 8:30 AM U.K. International Trade Balance mm -7.494b June 11/08/2008 8:30 AM U.K. Core PPI yy 6.3% July 11/08/2008 8:30 AM U.K. Core PPI mm 0.3% July 11/08/2008 12:15 PM Canada Housing Starts yy 217.8 July 12/08/2008 5:00 AM Japan Consumer Confidence 32.6 July 12/08/2008 8:30 AM U.K. Consumer Price Index (CPI) yy 3.8% July 12/08/2008 8:30 AM U.K. Retail Price Index (RPI) mm 0.8% July 12/08/2008 8:30 AM U.K. Retail Price Index (RPI) yy 4.6% July 12/08/2008 8:30 AM U.K. RPI ex. Mortgage (RPIX) mm 0.8% July 12/08/2008 8:30 AM U.K. RPI ex. Mortgage (RPIX) yy 4.8% July 12/08/2008 8:30 AM U.K. Consumer Price Index (CPI) mm 0.7% July 12/08/2008 12:30 PM Canada International Trade Balance mm 5.54b June 12/08/2008 12:30 PM USA International Trade Balance mm -61.0b -59.79b June 12/08/2008 2:00 PM USA IBD Consumer Sentiment 37.4 August 12/08/2008 6:00 PM USA Budget -68.6b -36.45b July 12/08/2008 11:50 PM Japan Current Account -5.9% June 12/08/2008 11:50 PM Japan Gross Domestic Product (GDP) yy -2.3% 4.0% Quarter 2 12/08/2008 11:50 PM Japan Gross Domestic Product (GDP) qq -0.6% 1.0% Quarter 2 12/08/2008 11:50 PM Japan International Trade Balance mm 6.3% June 13/08/2008 8:30 AM U.K. Initial Jobless Claims 15.5k July 13/08/2008 8:30 AM U.K. Unemployment Rate 5.2% June 13/08/2008 9:00 AM Europe Industrial Production mm 0.4% -1.9% June 13/08/2008 9:00 AM Europe Industrial Production yy 0.6% -0.6% June 13/08/2008 12:30 PM USA Core Retail Sales mm 0.5% 0.8% July 13/08/2008 12:30 PM USA Retail Sales mm 0.2% 0.1% July 13/08/2008 12:30 PM USA Export Prices 0.7% 1.0% July 13/08/2008 12:30 PM USA Import Prices 1.0% 2.6% July 13/08/2008 2:00 PM USA Business Inventories 0.4% 0.3% June 13/08/2008 10:45 PM New Zealand Retail Sales mm 0.1% -1.2% June 13/08/2008 10:45 PM New Zealand Retail Sales yy 1.1% 1.0% June 14/08/2008 5:45 AM Swiss Consumer Confidence 2.0 Quarter 3 14/08/2008 6:00 AM Germany Consumer Price Index (CPI) mm 0.6% 0.3% July 14/08/2008 6:00 AM Germany Consumer Price Index (CPI) yy 3.3% 3.3% July 14/08/2008 6:00 AM Germany Gross Domestic Product (GDP) qq -0.8% 1.5% Quarter 2 14/08/2008 6:00 AM Germany Gross Domestic Product (GDP) yy 1.6% 1.8% Quarter 2 14/08/2008 6:00 AM Germany Harm. Index of Consumer Prices mm 0.4% July 14/08/2008 6:00 AM Germany Harm. Index of Consumer Prices yy 3.4% July 14/08/2008 9:00 AM Europe Gross Domestic Product (GDP) qq -0.2% 0.7% Quarter 2 14/08/2008 9:00 AM Europe Gross Domestic Product (GDP) yy 1.6% 2.1% Quarter 2 14/08/2008 9:00 AM Europe Core HICP mm 0.1% July 14/08/2008 9:00 AM Europe Core HICP yy 2.5% July 14/08/2008 9:00 AM Europe Harm. Index of Consumer Prices mm -0.1% 0.4% July 14/08/2008 9:00 AM Europe Harm. Index of Consumer Prices yy 4.1% 4.0% July 14/08/2008 12:30 PM USA Core CPI mm 0.2% 0.3% July 14/08/2008 12:30 PM USA Consumer Price Index (CPI) yy 5.1% 5.0% July 14/08/2008 12:30 PM USA Core CPI yy 2.4% 2.4% July 14/08/2008 12:30 PM USA Initial Jobless Claims 455.0k Last Week 14/08/2008 12:30 PM USA Consumer Price Index (CPI) mm 0.4% 1.1% July 14/08/2008 11:30 PM Japan Tankan Survey -10.0 August 15/08/2008 12:00 AM Japan Market Holiday 15/08/2008 1:15 PM USA Industrial Production mm 0.1% 0.5% July Results for the week of: 04/08/2008 - 08/08/2008 4 August 2008 - 8 August 2008 * GMT Time Date Hour Country Data Result Forecast Previous Period 04/08/2008 12:00 AM Canada Market Holiday 04/08/2008 1:30 AM Australia House Prices 1.1% Quarter 2 04/08/2008 7:30 AM Swiss Manufacturing PMI 54.9 July 04/08/2008 9:00 AM Europe Producer Price Index (PPI) mm 0.9% 1.2% June 04/08/2008 9:00 AM Europe Producer Price Index (PPI) yy 7.1% June 04/08/2008 12:30 PM USA Core PCE yy 2.1% June 04/08/2008 12:30 PM USA Personal Consumption Exp. mm 0.4% June 04/08/2008 12:30 PM USA Personal Consumption Exp. mm 0.4% June 04/08/2008 12:30 PM USA Personal Consumption Exp. yy 3.1% June 04/08/2008 12:30 PM USA Personal Income -0.1% 1.9% June 04/08/2008 12:30 PM USA Personal Consumption 0.5% 0.8% June 04/08/2008 12:30 PM USA Core PCE mm 0.2% 0.1% June 04/08/2008 2:00 PM USA Durable Goods Orders 0.8% June 04/08/2008 2:00 PM USA New orders XD 0.1% June 04/08/2008 2:00 PM USA Factory Orders mm 0.7% 0.6% June 05/08/2008 7:30 AM U.K. Industrial Production yy -1.6% June 05/08/2008 7:55 AM Germany Services PMI 53.3 52.1 July 05/08/2008 8:00 AM Europe Services PMI 48.3 49.1 July 05/08/2008 8:25 AM U.K. Services PMI 47.1 July 05/08/2008 8:30 AM U.K. Industrial Production mm -0.8% June 05/08/2008 9:00 AM Europe Retail Sales yy 0.2% June 05/08/2008 9:00 AM Europe Retail Sales mm 1.2% June 05/08/2008 2:00 PM USA Services PMI 49.0 49.9 July 05/08/2008 6:15 PM USA Interest Rate Decision 2.0% 2.0% August 06/08/2008 5:00 AM Japan Leading Economic Indicators -0.2 June 06/08/2008 10:00 AM Germany Factory Orders mm 0.5% -0.9% June 06/08/2008 2:00 PM Canada Services PMI 69.6 July 06/08/2008 10:45 PM New Zealand Unemployment Rate 3.8% 3.6% Quarter 2 06/08/2008 11:50 PM Japan Machinery Orders mm 10.4% June 07/08/2008 1:30 AM Australia Interest Rate Decision 7.25% August 07/08/2008 1:30 AM Australia Unemployment Rate 4.2% July 07/08/2008 1:30 AM Australia Non-Farm Payroll 29800 July 07/08/2008 6:00 AM Germany International Trade Balance mm 15.7b 14.6b June 07/08/2008 10:00 AM Germany Industrial Production mm 0.8% -2.4% June 07/08/2008 11:00 AM U.K. Interest Rate Decision 5.0% 5.0% August 07/08/2008 11:45 AM Europe Interest Rate Decision 4.25% 4.25% August 07/08/2008 12:30 PM Canada Building Permits 1.1% June 07/08/2008 12:30 PM USA Initial Jobless Claims 448k Last Week 07/08/2008 2:00 PM USA Pending Homes Sales -1.0% -4.7% June 07/08/2008 7:00 PM USA Consumer Credit mm 6.8b 7.78b June 08/08/2008 5:45 AM Swiss Unemployment Rate 2.5% 2.5% July 08/08/2008 11:00 AM Canada Unemployment Rate 6.2% July 08/08/2008 11:00 AM Canada Non-Farm Payroll -5.0k July 08/08/2008 12:30 PM USA Productivity and Costs 2.5% 2.6% Quarter 2 08/08/2008 12:30 PM USA Wholsale Inventories 0.5% 0.8% June 08/08/2008 2:00 PM USA Wholesale Trade 0.5% 0.8% June Results for the week of: 27/07/2008 - 01/08/2008 27 July 2008 - 1 August 2008 * GMT Time Date Hour Country Data Result Forecast Previous Period 27/07/2008 10:45 PM New Zealand International Trade Balance mm -223m -500m -196m June 28/07/2008 6:00 AM Germany GFK Consumer Sentiment 2.1 3.5 3.9 August 28/07/2008 4:00 PM USA Mid-West Mnfg Activity 104.8 June 28/07/2008 10:45 PM New Zealand Building Permits -42.3% June 28/07/2008 11:30 PM Japan Unemployment 4.0% June 28/07/2008 11:30 PM Japan House'hold Spending -3.2% June 28/07/2008 11:50 PM Japan Retail Sales yy 0.2% June 29/07/2008 12:00 AM Germany Consumer Price Index (CPI) mm 0.5% 0.3% July 29/07/2008 12:00 AM Germany Consumer Price Index (CPI) yy 3.2% 3.3% July 29/07/2008 12:00 AM Germany Harm. Index of Consumer Prices mm 0.4% July 29/07/2008 12:00 AM Germany Harm. Index of Consumer Prices yy 3.4% July 29/07/2008 8:30 AM U.K. Consumer Credit mm 1.376b June 29/07/2008 10:00 AM U.K. CBI Sales -9 July 29/07/2008 1:00 PM USA House Prices -1.0% -1.4% May 29/07/2008 2:00 PM USA Consumer Confidence 50 50.4 July 30/07/2008 9:00 AM Europe Industrial Sentiment -5.0 July 30/07/2008 9:00 AM Europe Service Sentiment 9.0 July 30/07/2008 9:30 AM Swiss KOF Purchasing Manager ind 1.01 July 30/07/2008 12:15 PM USA ADP employment -55k -79k July 30/07/2008 12:30 PM Canada Producer Price Index (PPI) mm 0.6% June 30/07/2008 12:30 PM Canada Producer Price Index (PPI) yy 2.4% June 30/07/2008 11:15 PM Japan Manufacturing PMI 46.5 July 31/07/2008 5:00 AM Japan Construction Orders -25.2% June 31/07/2008 5:00 AM Japan Housing Starts yy -6.5% June 31/07/2008 5:45 AM Swiss Consumer Price Index (CPI) mm -0.5% 0.2% July 31/07/2008 5:45 AM Swiss Consumer Price Index (CPI) yy 3.1% 2.9% July 31/07/2008 6:00 AM U.K. House Prices -0.9% July 31/07/2008 8:00 AM Germany Unemployment Rate 7.8% 7.8% July 31/07/2008 9:00 AM Europe Harm. Index of Consumer Prices yy 4.2% 4.0% July 31/07/2008 9:00 AM Europe Unemployment 7.2% 7.2% June 31/07/2008 12:30 PM Canada Gross Domestic Product (GDP) mm 0.4% May 31/07/2008 12:30 PM USA Core PCE qq 2.4% 2.3% Quarter 2 31/07/2008 12:30 PM USA Gross Domestic Product (GDP) qq 1.9% 1.0% Quarter 2 31/07/2008 12:30 PM USA Initial Jobless Claims 406k Last Week 31/07/2008 12:30 PM USA Personal Consumption Exp. qq 4.0% 3.6% Quarter 2 31/07/2008 1:45 PM USA Chicago PMI 49 49.6 July 31/07/2008 3:00 PM USA KC Fed -13 July 01/08/2008 7:55 AM Germany Manufacturing PMI 50.9 52.6 July 01/08/2008 8:00 AM Europe Manufacturing PMI 47.5 49.2 July 01/08/2008 8:30 AM U.K. Manufacturing PMI 45.8 July 01/08/2008 12:30 PM USA Non-Farm Payroll -65.0k -62.0k July 01/08/2008 12:30 PM USA Unemployment Rate 5.6% 5.5% July 01/08/2008 2:00 PM USA Manufacturing PMI 49.8 50.2 July 01/08/2008 2:00 PM USA Consumer Spending -0.4% -0.4% June Results for the week of: 21/07/2008 - 25/07/2008 21 July 2008 - 25 July 2008 *GMT time Date Hour Country Data Result Forecast Previous Period 21/07/2008 12:00 AM Japan Market Holiday 21/07/2008 1:30 AM Australia Producer Price Index (PPI) mm 1.6% 1.9% Quarter 2 21/07/2008 1:30 AM Australia Producer Price Index (PPI) yy 5.3% 4.8% Quarter 2 21/07/2008 7:15 AM Swiss Producer Price Index (PPI) mm 1.2% June 21/07/2008 7:15 AM Swiss Producer Price Index (PPI) yy 3.9% June 21/07/2008 2:00 PM USA Leading Economic Indicators -0.1% 0.1% June 22/07/2008 6:15 AM Swiss International Trade Balance mm 1.874b June 22/07/2008 12:30 PM Canada Retail Sales mm 0.6% May 22/07/2008 12:30 PM Canada Core Retail Sales mm 1.1% May 22/07/2008 2:00 PM USA Richmond Fed srvs -14 July 23/07/2008 1:30 AM Australia Consumer Price Index (CPI) mm 1.3% 1.3% Quarter 2 23/07/2008 1:30 AM Australia Consumer Price Index (CPI) yy 4.3% 4.2% Quarter 2 23/07/2008 8:00 AM Germany IFO Business Climate: index 100.2 101.3 July 23/07/2008 9:00 AM Europe Factory Orders mm -1.2% 2.5% May 23/07/2008 9:05 AM Europe Factory Orders yy 2.6% 11.7% May 23/07/2008 10:00 AM U.K. CBI Orders -4 1 July 23/07/2008 11:00 AM Canada Core CPI yy 1.5% June 23/07/2008 11:00 AM Canada Consumer Price Index (CPI) mm 1.0% June 23/07/2008 11:00 AM Canada Core CPI mm 0.3% June 23/07/2008 11:00 AM Canada Consumer Price Index (CPI) yy 2.2% June 23/07/2008 9:00 PM New Zealand Interest Rate Decision 8.25% 8.25% August 23/07/2008 11:50 PM Japan International Trade Balance yy 503b 365.6b June 24/07/2008 7:30 AM U.K. Retail Sales mm -2.5% 3.5% June 24/07/2008 7:30 AM Germany Services PMI - prel 51.5 52.1 July 24/07/2008 7:30 AM Germany Manufacturing PMI - prel 52.0 52.6 July 24/07/2008 8:00 AM Europe Services PMI 48.8 49.1 July 24/07/2008 8:00 AM Europe Manufacturing PMI 48.7 49.2 July 24/07/2008 8:30 AM U.K. Retail Sales yy 4.4% 8.1% June 24/07/2008 12:30 PM USA Initial Jobless Claims 366k Last Week 24/07/2008 2:00 PM USA Existing Home Sales (Units) 4.93m 4.99m June 24/07/2008 11:30 PM Japan Consumer Price Index (CPI) yy 1.9% 1.5% June 24/07/2008 11:30 PM Japan Consumer Price Index (CPI) yy 1.3% June 25/07/2008 6:00 AM Germany Import Prices 1.0% 2.4% June 25/07/2008 8:00 AM Europe Current Account -0.3b May 25/07/2008 8:00 AM Europe Capital Flow -23.7b May 25/07/2008 8:00 AM Europe M3 Money Supply yy 10.3% 10.5% June 25/07/2008 8:30 AM U.K. Gross Domestic Product (GDP) qq 0.2% 0.3% Quarter 2 25/07/2008 8:30 AM U.K. Gross Domestic Product (GDP) yy 1.6% 2.3% Quarter 2 25/07/2008 12:30 PM USA Durable Goods Orders 0.2% 0.0% June 25/07/2008 12:30 PM USA New orders XD -0.4% -0.6% June 25/07/2008 1:55 PM USA U.Michigan Consumer Sentiment 56.0 56.4 July 25/07/2008 2:00 PM USA New Home sales 0.51m 0.512m June Results for the week of: 13/07/2008 - 18/07/2008 13 July 2008 - 18 July 2008 * GMT time Date Hour Country Data Result Forecast Previous Period 13/07/2008 10:45 PM New Zealand Retail Sales yy 1.0% 2.0% 4.1% May 13/07/2008 10:45 PM New Zealand Core Retail Sales mm 0.7% 0.5% -0.5% May 13/07/2008 10:45 PM New Zealand Retail Sales mm -1.2% 0.1% 1% May 14/07/2008 8:30 AM U.K. Core PPI mm 0.8% 1.2% June 14/07/2008 8:30 AM U.K. Core PPI yy 6.5% 5.9% June 14/07/2008 8:30 AM U.K. Producer Price Index (PPI) mm 2.5% 3.8% June 14/07/2008 8:30 AM U.K. Producer Price Index (PPI) yy 29.1% 27.6% June 14/07/2008 9:00 AM Europe Industrial Production mm -2.3% 0.9% May 14/07/2008 9:00 AM Europe Industrial Production yy 0.5% 3.9% May 15/07/2008 3:00 AM Japan Interest Rate Decision 0.5% July 15/07/2008 8:30 AM U.K. Consumer Price Index (CPI) mm 0.4% 0.6% May 15/07/2008 8:30 AM U.K. RPI ex. Mortgage (RPIX) yy 4.4% 4.4% June 15/07/2008 8:30 AM U.K. Consumer Price Index (CPI) yy 3.6% 3.3% June 15/07/2008 8:30 AM U.K. Retail Price Index (RPI) mm 0.5% 0.5% June 15/07/2008 8:30 AM U.K. Retail Price Index (RPI) yy 4.2% 4.3% June 15/07/2008 8:30 AM U.K. RPI ex. Mortgage (RPIX) mm 0.4% 0.7% June 15/07/2008 9:00 AM Germany ZEW Economic Sentiment -55 -52.4 July 15/07/2008 12:30 PM USA Core PPI yy 3.0% June 15/07/2008 12:30 PM USA Producer Price Index (PPI) mm 1.3% 1.4% June 15/07/2008 12:30 PM USA Core PPI mm 0.3% 0.2% June 15/07/2008 12:30 PM USA Producer Price Index (PPI) yy 7.2% June 15/07/2008 12:30 PM USA New-York Fed Survey -7.25 -8.68 July 15/07/2008 12:30 PM USA Retail Sales mm 0.4% 1.0% June 15/07/2008 12:30 PM USA Core Retail Sales mm 0.9% 1.2% June 15/07/2008 1:00 PM Canada Interest Rate Decision 3.0% July 15/07/2008 2:00 PM USA Business Inventories 0.5% 0.5% May 15/07/2008 2:00 PM USA IBD Consumer Sentiment 37.4 July 16/07/2008 6:00 AM Germany Harm. Index of Consumer Prices yy 3.4% 3.1% June 16/07/2008 6:00 AM Germany Consumer Price Index (CPI) mm 0.3% 0.6% June 16/07/2008 6:00 AM Germany Consumer Price Index (CPI) yy 3.3% 3.0% June 16/07/2008 6:00 AM Germany Harm. Index of Consumer Prices mm 0.4% 0.7% June 16/07/2008 7:15 AM Swiss Retail Sales mm 2.5% 2.4% May 16/07/2008 8:30 AM U.K. Initial Jobless Claims 10.0K 9.0K June 16/07/2008 8:30 AM U.K. Unemployment Rate 5.3% 5.3% May 16/07/2008 9:00 AM Europe Harm. Index of Consumer Prices mm 0.4% 0.6% June 16/07/2008 9:00 AM Europe Harm. Index of Consumer Prices yy 4.0% 3.7% June 16/07/2008 9:00 AM Europe Core HICP yy 2.6% 2.5% June 16/07/2008 12:30 PM USA Core CPI mm 0.2% 0.2% June 16/07/2008 12:30 PM USA Consumer Price Index (CPI) mm 0.7% 0.6% June 16/07/2008 12:30 PM USA Core CPI yy 2.3% 2.3% June 16/07/2008 12:30 PM USA Consumer Price Index (CPI) yy 4.5% 4.2% June 16/07/2008 1:00 PM USA Capital Flow 60.6B May 16/07/2008 1:15 PM USA Capacity Utilization %79.3 79.4% June 16/07/2008 1:15 PM USA Industrial Production mm -0.1% 0.2%- June 16/07/2008 11:30 PM Japan Tankan Survey 2- July 17/07/2008 6:00 AM Germany Producer Price Index (PPI) yy 6.5% 6.0% June 17/07/2008 9:00 AM Swiss ZEW Economic Sentiment -63.8 July 17/07/2008 12:30 PM USA Building Permits 0.96M 0.978M June 17/07/2008 12:30 PM USA Housing Starts yy 0.97M 0.975M June 17/07/2008 12:30 PM USA Jobless Claims 4-weeks 346K Last Week 17/07/2008 2:00 PM USA Philadelphia Fed Survey -15.0 -17.0 July 18/07/2008 6:00 AM Germany Producer Price Index (PPI) mm 0.7% 1.0% June 18/07/2008 8:30 AM U.K. Personal Consumption Exp. mm 18/07/2008 12:30 PM Canada Leading Economic Indicators Results for the week of: 07/07/2008 - 11/07/2008 7 July 2008 - 11 July 2008 * GMT time Date Hour * Country Data Result Forecast Previous Period 07/07/2008 5:45 AM Swiss Unemployment Rate 2.5% 2.5% June 07/07/2008 8:30 AM U.K. Industrial Production mm 0.1% May 07/07/2008 8:30 AM U.K. Industrial Production yy 0.1% May 07/07/2008 10:00 AM Germany Industrial Production mm 0.4% -0.8% May 07/07/2008 12:30 PM Canada Building Permits 14.5% May 08/07/2008 2:00 PM USA Pending Homes Sales -2.5% 6.3% May 08/07/2008 2:00 PM USA Wholsale Inventories 0.8% 1.3% May 08/07/2008 2:00 PM USA Wholesale Trade 1.4% May 08/07/2008 7:00 PM USA Consumer Credit mm 6.9b 8.95b May 08/07/2008 11:50 PM Japan Machinery Orders mm 5.5% May 09/07/2008 6:00 AM U.K. International Trade Balance mm -7.594b May 09/07/2008 6:00 AM Germany International Trade Balance mm 17.7b May 09/07/2008 9:00 AM Europe Gross Domestic Product (GDP) qq 0.8% 0.4% Quarter 1 09/07/2008 9:00 AM Europe Gross Domestic Product (GDP) yy 2.2% 2.2% Quarter 1 09/07/2008 12:15 PM Canada Housing Starts yy 221.3k June 09/07/2008 11:50 PM Japan Current Account -29.6% May 09/07/2008 11:50 PM Japan International Trade Balance mm -38.4% May 10/07/2008 11:00 AM U.K. Interest Rate Decision 5% July 10/07/2008 12:30 PM USA Initial Jobless Claims 390k 404k Last Week 11/07/2008 4:30 AM Japan Capacity Utilization -0.7% May 11/07/2008 11:00 AM Canada Non-Farm Payroll 8.4k June 11/07/2008 11:00 AM Canada Unemployment 6.1% June 11/07/2008 12:30 PM Canada New Home sales 0.0 11/07/2008 12:30 PM Canada International Trade Balance mm 5.11b 11/07/2008 12:30 PM USA Export Prices 0.4% 0.3% June 11/07/2008 12:30 PM USA Import Prices 2.0% 2.3% June 11/07/2008 12:30 PM USA International Trade Balance mm -62.3b -60.9b May 11/07/2008 1:55 PM USA Michigan Sentiment: expect 55.5 56.4 July 11/07/2008 6:00 PM USA Budget 33.0b 27.48b June Results for the week of: 29/06/2008 - 04/07/2008 29 June 2008 - 4 July 2008 * Time is GMT Date Hour * Country Data Result Forecast Previous Period 29/06/2008 10:45 PM New Zealand Building Permits -42.3% 82.1% May 29/06/2008 11:15 PM Japan Manufacturing PMI 46.5 47.7 June 30/06/2008 5:00 AM Japan Construction Orders -25.2% -8.4% May 30/06/2008 5:00 AM Japan Housing Starts yy -6.5% -3.8% -8.7% May 30/06/2008 8:30 AM U.K. Consumer Credit mm 1.376b 1.0b 0.94b May 30/06/2008 9:00 AM Europe Harm. Index of Consumer Prices yy 4.0% 3.9% 3.7% June 30/06/2008 12:30 PM Canada Gross Domestic Product (GDP) mm 0.4% 0.3% -0.2% April 30/06/2008 1:45 PM USA Chicago PMI 48 49.1 June 30/06/2008 11:50 PM Japan Tankan Survey 2.0% -1.6% Quarter 2 01/07/2008 4:30 AM Australia Interest Rate Decision 7.25% 7.25% July 01/07/2008 6:00 AM Germany Retail Sales mm 0.5% -0.6% May 01/07/2008 6:00 AM Germany Retail Sales yy -1% -1% May 01/07/2008 7:30 AM Swiss Manufacturing PMI 55.7 June 01/07/2008 7:55 AM Germany Manufacturing PMI 53.6 June 01/07/2008 8:00 AM Europe Manufacturing PMI 50.6 June 01/07/2008 8:00 AM Germany Unemployment Rate 7.9% June 01/07/2008 8:30 AM U.K. Manufacturing PMI 50.0 June 01/07/2008 9:00 AM Europe Unemployment Rate 7.1% May 01/07/2008 2:00 PM USA Manufacturing PMI 49.0 49.6 June 01/07/2008 2:00 PM USA Construction Spending -0.6% -0.4% May 02/07/2008 1:30 AM Australia Building Permits -3.0% 7.8% May 02/07/2008 1:30 AM Australia Retail Sales mm 0.2% -0.2% May 02/07/2008 9:00 AM Europe Producer Price Index (PPI) mm 0.8% May 02/07/2008 9:00 AM Europe Producer Price Index (PPI) yy 6.1% May 02/07/2008 12:15 PM USA ADP employment -1.0K 40.0K June 02/07/2008 2:00 PM USA New orders XD -0.6% May 02/07/2008 2:00 PM USA Factory Orders mm 0.5% 1.1% May 02/07/2008 2:00 PM USA Durable Goods Orders 0.0% May 03/07/2008 1:30 AM Australia International Trade Balance mm -900m -957m May 03/07/2008 5:45 AM Swiss Consumer Price Index (CPI) mm 0.8% June 03/07/2008 5:45 AM Swiss Consumer Price Index (CPI) yy 2.9% June 03/07/2008 7:55 AM Germany Services PMI 53.8 June 03/07/2008 8:00 AM Europe Services PMI 50.6 June 03/07/2008 8:30 AM U.K. Services PMI 49.8 June 03/07/2008 9:00 AM Europe Retail Sales yy -2.9% May 03/07/2008 9:00 AM Europe Retail Sales mm -0.6% May 03/07/2008 11:45 AM Europe Interest Rate Decision 4.25% 4.0% July 03/07/2008 12:30 PM USA Initial Jobless Claims Last Week 03/07/2008 12:30 PM USA Non-Farm Payroll -43k -49k June 03/07/2008 12:30 PM USA Unemployment Rate 5.4% 5.5% June 03/07/2008 2:00 PM USA Services PMI 51.2 51.7 June 03/07/2008 3:30 PM Europe ECB President Trichet Speaks 04/07/2008 12:00 AM USA Market Holiday 04/07/2008 5:00 AM Japan Leading Economic Indicators 2.0 May 04/07/2008 10:00 AM Germany Factory Orders mm -1.8% May 04/07/2008 2:00 PM Canada Services PMI 62.5 June Results for the week of: 23/06/2008 - 27/06/2008 23 June 2008 - 27 June 2008 Date Hour * Country Data Result Forecast Previous Period *Time is GMT 23/06/2008 8:00 AM Europe Services PMI 50.5 50.6 June 23/06/2008 8:00 AM Germany Manufacturing PMI 50.3 50.6 June 23/06/2008 8:00 AM Germany IFO Business Climate: index 102.5 103.5 June 24/06/2008 6:00 AM Germany GFK Consumer Sentiment 4.7 4.9 July 24/06/2008 1:00 PM USA House Prices -2.0% -2.2% April 24/06/2008 2:00 PM USA Richmond Fed srvs -6 June 24/06/2008 2:00 PM USA Consumer Confidence 57 57.2 June 24/06/2008 11:50 PM Japan International Trade Balance mm 40b 485b May 25/06/2008 9:00 AM Europe Factory Orders mm -0.7% -1% April 25/06/2008 9:00 AM Europe Factory Orders yy 1.9% -2.5% April 25/06/2008 10:00 AM U.K. CBI Sales -16 -14 June 25/06/2008 12:30 PM USA Durable Goods Orders 0% -0.6% May 25/06/2008 12:30 PM USA New orders XD -0.5% -0.3% May 25/06/2008 2:00 PM USA New Home sales 0.51m 0.526m May 25/06/2008 6:15 PM USA Interest Rate Decision 2% 2% July 26/06/2008 8:00 AM Europe M3 Money Supply yy 10.4% 10.6% May 26/06/2008 12:30 PM USA Core PCE qq 2.1% 2.1% Quarter 1 26/06/2008 12:30 PM USA Gross Domestic Product (GDP) qq 1.0% 0.9% Quarter 1 26/06/2008 12:30 PM USA Initial Jobless Claims 381k Last Week 26/06/2008 12:30 PM USA Personal Consumption Exp. qq 3.5% 3.5% Quarter 1 26/06/2008 2:00 PM USA Existing Home Sales (Units) 4.88m 4.89m May 26/06/2008 3:00 PM USA KC Fed 0 June 26/06/2008 4:00 PM USA Mid-West Mnfg Activity 105.7 May 26/06/2008 11:30 PM Japan House'hold Spending -2.2% -2.7% May 26/06/2008 11:30 PM Japan Consumer Price Index (CPI) yy 1.4% 0.9% May 26/06/2008 11:30 PM Japan Consumer Price Index (CPI) mm 0.8% May 26/06/2008 11:30 PM Japan Unemployment Rate 4.0% 4.0% May 26/06/2008 11:50 PM Japan Retail Sales yy 0% 0.1% May 27/06/2008 8:00 AM Europe Capital Account -15.3 April 27/06/2008 8:00 AM Europe Capital Flow -17.5 April 27/06/2008 8:30 AM U.K. Gross Domestic Product (GDP) qq 0.4% 0.4% Quarter 1 27/06/2008 8:30 AM U.K. Gross Domestic Product (GDP) yy 2.5% 2.5% Quarter 1 27/06/2008 8:30 AM U.K. Capital Account -13.0b -8.458b Quarter 1 27/06/2008 9:30 AM Swiss KOF Purchasing Manager ind 1.0 1.09 January 27/06/2008 12:30 PM Canada Producer Price Index (PPI) yy 1.0% May 27/06/2008 12:30 PM USA Personal Consumption Exp. mm 0.2% May 27/06/2008 12:30 PM USA Personal Consumption Exp. yy 3.2% May 27/06/2008 12:30 PM USA Personal Income 0.4% 0.2% May 27/06/2008 12:30 PM USA Personal Consumption 0.6% 0.2% May 27/06/2008 12:30 PM USA Personal Consumption Exp. mm - core 0.2% 0.1% May 27/06/2008 12:30 PM USA Personal Consumption Exp. yy - core 2.1% May 27/06/2008 3:30 PM Canada Producer Price Index (PPI) mm 1.4% May Results for the week of: 16/06/2008 - 20/06/2008 16 June 2008 - 20 June 2008 * Time is GMT time Date Hour * Country Data Result Forecast Previous Period 16/06/2008 7:15 AM Swiss Retail Sales mm -2.5% April 16/06/2008 9:00 AM Europe Harm. Index of Consumer Prices mm 0.6% 0.3% May 16/06/2008 9:00 AM Europe Harm. Index of Consumer Prices yy 3.6% 3.3% May 16/06/2008 12:30 PM USA New-York Fed Survey -2.2 -3.23 June 16/06/2008 1:00 PM USA Capital Flow -48.2b April 17/06/2008 7:15 AM Swiss Factory Orders mm 9.3% Quarter 1 17/06/2008 8:30 AM U.K. Retail Price Index (RPI) mm 0.9% May 17/06/2008 8:30 AM U.K. Consumer Price Index (CPI) mm 0.8% May 17/06/2008 8:30 AM U.K. Retail Price Index (RPI) yy 4.2% May 17/06/2008 8:30 AM U.K. Consumer Price Index (CPI) yy 3.0% May 17/06/2008 8:30 AM U.K. RPI ex. Mortgage (RPIX) mm 0.9% May 17/06/2008 8:30 AM U.K. RPI ex. Mortgage (RPIX) yy 4.0% May 17/06/2008 9:00 AM Germany ZEW Economic Sentiment 38.3 38.6 June 17/06/2008 12:30 PM USA Capital Account -173.9b -172.9b Quarter 1 17/06/2008 12:30 PM USA Core PPI mm 0.3% 0.4% May 17/06/2008 12:30 PM USA Core PPI yy 3.0% May 17/06/2008 12:30 PM USA Housing Starts yy 0.98m 1.032m May 17/06/2008 12:30 PM USA Producer Price Index (PPI) yy 6.5% May 17/06/2008 12:30 PM USA Building Permits 0.96m 0.982m May 17/06/2008 12:30 PM USA Producer Price Index (PPI) mm 0.8% 0.2% May 17/06/2008 1:15 PM USA Capacity Utilization 79.7% 79.7% May 17/06/2008 1:15 PM USA Industrial Production mm 0.1% -0.7% May 18/06/2008 9:00 AM Swiss ZEW Economic Sentiment -60.4 June 18/06/2008 12:30 PM Canada Leading Economic Indicators 0.1% May 18/06/2008 11:30 PM Japan Tankan Survey -2.0% June 19/06/2008 7:30 AM Swiss Interest Rate Decision 2.75% Quarter 2 19/06/2008 8:30 AM U.K. Retail Sales mm -0.2% May 19/06/2008 8:30 AM U.K. Retail Sales yy 4.2% May 19/06/2008 11:00 AM Canada Core CPI mm 0.3% May 19/06/2008 11:00 AM Canada Core CPI yy 1.5% May 19/06/2008 11:00 AM Canada Consumer Price Index (CPI) mm 0.8% May 19/06/2008 11:00 AM Canada Consumer Price Index (CPI) yy 1.7% May 19/06/2008 12:30 PM USA Initial Jobless Claims 381k 375k 384k Last Week 19/06/2008 2:00 PM USA Philadelphia Fed Survey -17.1 -12.0 -15.6 June 19/06/2008 2:00 PM USA Leading Economic Indicators 0.1% 0% 0.1% May 20/06/2008 6:00 AM Germany Producer Price Index (PPI) mm 1.0% 0.9% 1.1% May 20/06/2008 6:00 AM Germany Producer Price Index (PPI) yy 6.0% 5.8% 5.2% May 20/06/2008 7:15 AM Swiss Producer Price Index (PPI) yy 3.9% 3.6% 3.6% May 20/06/2008 7:15 AM Swiss Producer Price Index (PPI) mm 1.2% 0.9% 0.7% May 20/06/2008 12:30 PM Canada Core Retail Sales mm 1.1% 0.7% 0% April 20/06/2008 12:30 PM Canada Retail Sales mm 0.6% 0.6% 0.1% April Results for the week of: 09/06/2008 - 13/06/2008 09/06/2008 - 13/06/2008 GMT time Date Hour * Country Data Result Forecast Previous Period 09/06/2008 4:00 AM Japan Leading Economic Indicators 2 2 -2.3 April 09/06/2008 5:45 AM Swiss Unemployment Rate 2.5% 2.6% 2.6% May 09/06/2008 6:00 AM Germany International Trade Balance mm 17.7b 16.0b 15.4b April 09/06/2008 8:30 AM U.K. Producer Price Index (PPI) mm 2.8% 2.7% 2.4% May 09/06/2008 8:30 AM U.K. Producer Price Index (PPI) yy 27.6% 24.0% 23.1% May 09/06/2008 8:30 AM U.K. Core PPI mm 1.2% 0.4% 1.0% May 09/06/2008 8:30 AM U.K. Core PPI yy 5.9% 4.8% 4.5% May 09/06/2008 12:15 PM Canada Housing Starts yy 221.3k 220k 213.9k May 09/06/2008 2:00 PM USA Pending Homes Sales 6.3% -0.5% -1% April 10/06/2008 12:15 AM USA Fed Chairman Bernanke Speaks 10/06/2008 8:30 AM U.K. Industrial Production mm 0.1% -0.5% April 10/06/2008 8:30 AM U.K. Industrial Production yy 0.2% 0.2% April 10/06/2008 12:30 PM Canada International Trade Balance mm 5.53b April 10/06/2008 12:30 PM USA International Trade Balance mm -60.0b -58.21b April 10/06/2008 1:00 PM Canada Interest Rate Decision 3.0% June 10/06/2008 11:50 PM Japan Current Account -12.3% April 10/06/2008 11:50 PM Japan Gross Domestic Product (GDP) yy 3.3% Quarter 1 10/06/2008 11:50 PM Japan Gross Domestic Product (GDP) qq 0.8% Quarter 1 11/06/2008 8:30 AM U.K. International Trade Balance mm -7.3b -7.437b April 11/06/2008 8:30 AM U.K. Unemployment Rate 5.2% 5.2% April 11/06/2008 8:30 AM U.K. Initial Jobless Claims 5k 7.2k May 11/06/2008 12:30 PM Canada Capacity Utilization 81.8% Quarter 1 11/06/2008 6:00 PM USA Budget -137.5b -67.7b May 11/06/2008 6:00 PM USA Fed Beige Book 12/06/2008 3:00 AM Japan Interest Rate Decision 0.5% 0.5% June 12/06/2008 9:00 AM Europe Industrial Production mm 0.1% -0.2% April 12/06/2008 9:00 AM Europe Industrial Production yy 2.8% 2.0% March 12/06/2008 12:30 PM USA Retail Sales mm 0.4% -0.2% May 12/06/2008 12:30 PM USA Core Retail Sales mm 0.5% 0.5% May 12/06/2008 12:30 PM USA Export Prices 0.5% 0.3% May 12/06/2008 12:30 PM USA Import Prices 2.0% 1.8% May 12/06/2008 12:30 PM USA Initial Jobless Claims 357.0k Last Week 12/06/2008 2:00 PM USA Business Inventories 0.3% 0.1% April 13/06/2008 5:00 AM Japan Consumer Confidence 35.2 May 13/06/2008 6:00 AM Germany Consumer Price Index (CPI) mm 0.6% -0.2% May 13/06/2008 6:00 AM Germany Consumer Price Index (CPI) yy 3.0% 2.4% May 13/06/2008 6:00 AM Germany Harm. Index of Consumer Prices mm 0.6% -0.3% May 13/06/2008 6:00 AM Germany Harm. Index of Consumer Prices yy 3.0% 2.6% May 13/06/2008 12:30 PM USA Core CPI mm 0.2% 0.1% May 13/06/2008 12:30 PM USA Consumer Price Index (CPI) mm 0.5% 0.2% May 13/06/2008 12:30 PM USA Core CPI yy 2.3% 2.3% May 13/06/2008 12:30 PM USA Consumer Price Index (CPI) yy 3.9% 3.9% May 13/06/2008 1:55 PM USA U.Michigan Consumer Sentiment 59 59 June Results for the week of: 02/06/2008 - 06/06/2008 2 June 2008 - 6 June 2008 Date Hour * Country Data Result Forecast Previous Period 02/06/2008 4:30 AM Australia Retail Sales mm -.02% 0.2% 0.5% April 02/06/2008 8:45 AM Swiss Gross Domestic Product (GDP) qq 1.0% Quarter 1 02/06/2008 8:45 AM Swiss Gross Domestic Product (GDP) yy 3.6% Quarter 1 02/06/2008 10:30 AM Swiss Manufacturing PMI 56.7 May 02/06/2008 10:55 AM Germany Manufacturing PMI 53.5 53.6 May 02/06/2008 11:30 AM U.K. Consumer Credit mm 1.237B April 02/06/2008 11:30 AM U.K. Manufacturing PMI 51.0 May 02/06/2008 5:00 PM USA Construction Spending -0.7% -1.1% April 02/06/2008 5:00 PM USA Manufacturing PMI 49 48.6 May 03/06/2008 5:45 AM Swiss Consumer Price Index (CPI) yy 2.3% May 03/06/2008 5:45 AM Swiss Consumer Price Index (CPI) mm 0.8% May 03/06/2008 9:00 AM Europe Gross Domestic Product (GDP) qq 0.7% 0.4% Quarter 1 03/06/2008 9:00 AM Europe Gross Domestic Product (GDP) yy 2.2% 2.2% Quarter 1 03/06/2008 9:00 AM Europe Producer Price Index (PPI) mm 0.8% 0.7% April 03/06/2008 9:00 AM Europe Producer Price Index (PPI) yy 6.2% 5.7% April 03/06/2008 2:00 PM USA New orders XD -0.3% April 03/06/2008 2:00 PM USA Factory Orders mm 0.1% 1.3% April 03/06/2008 2:00 PM USA Durable Goods Orders -0.5% April 04/06/2008 7:55 AM Germany Services PMI 53.7 54.9 May 04/06/2008 8:00 AM Europe Services PMI 50.6 52.0 May 04/06/2008 8:00 AM Europe Composite PMI 51.9 May 04/06/2008 8:30 AM U.K. Services PMI 50.4 May 04/06/2008 9:00 AM Europe Retail Sales yy -0.7% -1.6% April 04/06/2008 9:00 AM Europe Retail Sales mm 0.3% -0.4% April 04/06/2008 12:15 PM USA ADP employment -30.0k 10.0k May 05/06/2008 10:00 AM Germany Factory Orders mm 0.5% -0.6% April 05/06/2008 11:00 AM U.K. Interest Rate Decision 5.0% 5.0% June 05/06/2008 11:45 AM Europe Interest Rate Decision 4.0% 4.0% June 05/06/2008 12:30 PM Canada Building Permits -4.5% April 05/06/2008 12:30 PM USA Initial Jobless Claims 372.0k Last Week 06/06/2008 10:00 AM Germany Industrial Production mm 0.3% -0.5% April 06/06/2008 11:00 AM Canada Unemployment Rate 6.1% May 06/06/2008 12:30 PM USA Unemployment Rate 5.1% 5.0% May 06/06/2008 12:30 PM USA Non-Farm Payroll -50.0k -20.0k May 06/06/2008 2:00 PM USA Wholsale Inventories 0.3% -0.1% April 06/06/2008 7:00 PM USA Consumer Credit mm 7.65b 15.29b April Results for the week of: 26/05/2008 - 30/05/2008 26 May 2008 - 30 May 2008 Date Hour * Country Data Result Forecast Previous Period 26/05/2008 12:00 AM U.K. Market Holiday 26/05/2008 12:00 AM USA Market Holiday 26/05/2008 1:45 AM New Zealand International Trade Balance mm -150m -50m April 27/05/2008 9:00 AM Germany GFK Consumer Sentiment 5.9 June 27/05/2008 9:00 AM Germany Gross Domestic Product (GDP) qq 0.3% Quarter 1 27/05/2008 9:00 AM Germany Gross Domestic Product (GDP) yy 1.6% Quarter 1 27/05/2008 9:15 AM Swiss International Trade Balance mm 1266.5m April 27/05/2008 4:00 PM USA House Prices -2.0% -2.6% March 27/05/2008 5:00 PM USA Richmond Fed srvs -2 May 27/05/2008 5:00 PM USA Consumer Confidence 61.0 62.3 May 27/05/2008 5:00 PM USA New Home sales 0.52m 0.526m April 27/05/2008 7:00 PM USA Mid-West Mnfg Activity 107.6 April 28/05/2008 11:00 AM Europe Current Account 4.3b March 28/05/2008 11:00 AM Europe Capital Flow 21b March 28/05/2008 3:30 PM USA Durable Goods Orders -0.4% 0.1% April 28/05/2008 3:30 PM USA New orders XD 0.2% 0.1% April 29/05/2008 2:50 AM Japan Retail Sales yy 1.1% April 29/05/2008 10:15 AM Swiss Non-Farm Payroll 3.883m Quarter 1 29/05/2008 11:00 AM Europe M3 Money Supply yy 10.3% May 29/05/2008 11:00 AM Germany Unemployment Rate 7.9% May 29/05/2008 3:30 PM USA Core PCE qq 2.2% 2.2% Quarter 1 29/05/2008 3:30 PM USA Gross Domestic Product (GDP) qq 1.0% 0.6% Quarter 1 29/05/2008 3:30 PM USA Personal Consumption Exp. qq 3.5% 3.5% Quarter 1 29/05/2008 3:30 PM USA Initial Jobless Claims 365k Last Week 30/05/2008 2:15 AM Japan Manufacturing PMI 48.6 May 30/05/2008 2:30 AM Japan Consumer Price Index (CPI) yy 1.2% April 30/05/2008 2:30 AM Japan Unemployment Rate 3.8% April 30/05/2008 12:00 PM Europe Service Sentiment 7.0 May 30/05/2008 12:00 PM Europe Unemployment Rate 7.1% April 30/05/2008 3:30 PM Canada Gross Domestic Product (GDP) mm -0.2% March 30/05/2008 3:30 PM Canada Gross Domestic Product (GDP) qq 0.2% Quarter 1 30/05/2008 3:30 PM Canada Producer Price Index (PPI) mm 1.7% April 30/05/2008 3:30 PM Canada Producer Price Index (PPI) yy -0.3% April 30/05/2008 4:45 PM USA Chicago PMI 48.8 48.3 May * GMT +03:00 Results for the week of: 19/05/2008 - 23/05/2008 19 May 2008 - 23 May 2008 Date Hour * Country Data Result Forecast Previous Period 19/05/2008 12:00 AM Canada Market Holiday 19/05/2008 5:00 PM USA Leading Economic Indicators -0.1% 0.1% April 20/05/2008 9:00 AM Germany Producer Price Index (PPI) mm 0.5% 0.7% April 20/05/2008 9:00 AM Germany Producer Price Index (PPI) yy 4.7% 4.2% April 20/05/2008 10:15 AM Swiss Producer Price Index (PPI) mm 0.6% April 20/05/2008 10:15 AM Swiss Producer Price Index (PPI) yy 3.9% April 20/05/2008 12:00 PM Germany ZEW Economic Sentiment -37.5 -40.7 May 20/05/2008 3:30 PM Canada Wholesale Trade -1.8% March 20/05/2008 3:30 PM USA Producer Price Index (PPI) mm 0.5% 1.1% April 20/05/2008 3:30 PM USA Core PPI mm 0.2% 0.2% April 20/05/2008 3:30 PM USA Core PPI yy 2.7% April 20/05/2008 3:30 PM USA Producer Price Index (PPI) yy 6.9% April 20/05/2008 5:00 PM USA IBD Consumer Sentiment 39.2 May 21/05/2008 3:30 AM Australia Consumer Confidence -1.3% May 21/05/2008 6:00 AM Japan Interest Rate Decision 0.5% May 21/05/2008 11:00 AM Germany IFO Business Climate: index 102.0 102.4 May 21/05/2008 11:30 AM U.K. Protocol of last interest rate meeting 21/05/2008 12:00 PM Swiss ZEW Economic Sentiment -71.4 May 21/05/2008 2:00 PM Canada Core CPI yy 1.3% April 21/05/2008 2:00 PM Canada Consumer Price Index (CPI) mm 0.4% April 21/05/2008 2:00 PM Canada Consumer Price Index (CPI) yy 1.4% April 21/05/2008 2:00 PM Canada Core CPI mm 0.2% April 21/05/2008 3:30 PM Canada Leading Economic Indicators 0.0% April 21/05/2008 9:00 PM USA Protocol of last interest rate meeting 22/05/2008 2:50 AM Japan International Trade Balance mm 1118.6b April 22/05/2008 2:50 AM Japan International Trade Balance yy -30.2% April 22/05/2008 10:30 AM Germany Services PMI 54.9 May 22/05/2008 10:30 AM Germany Manufacturing PMI 53.6 May 22/05/2008 11:30 AM U.K. Retail Sales mm -0.4% April 22/05/2008 11:30 AM U.K. Retail Sales yy 4.6% April 22/05/2008 12:00 PM Europe Factory Orders mm 0.6% March 22/05/2008 12:00 PM Europe Factory Orders yy 9.9% March 22/05/2008 1:00 PM U.K. CBI Orders -13.0 May 22/05/2008 3:30 PM Canada Core Retail Sales mm -0.3% March 22/05/2008 3:30 PM Canada Retail Sales mm -0.7% March 22/05/2008 3:30 PM USA Initial Jobless Claims 371.0k Last Week 23/05/2008 2:50 AM Japan Protocol of last interest rate meeting 23/05/2008 10:30 AM U.K. Gross Domestic Product (GDP) yy 2.5% Quarter 1 23/05/2008 10:30 AM U.K. Gross Domestic Product (GDP) qq 0.4% Quarter 1 23/05/2008 11:00 AM Europe Manufacturing PMI 50.3 50.7 May 23/05/2008 11:00 AM Europe Services PMI 51.7 52.0 May 23/05/2008 5:00 PM USA New Home sales 4.86M 4.93M April * GMT +02:00 Results for the week of: 12/05/2008 - 16/05/2008 12 May 2008 - 16 May 2008 Date Hour * Country Data Result Forecast Previous Period 12/05/2008 11:30 AM U.K. International Trade Balance mm -7.487b March 12/05/2008 11:30 AM U.K. Core PPI mm 0.3% April 12/05/2008 11:30 AM U.K. Core PPI yy 3.0% April 12/05/2008 11:30 AM U.K. Producer Price Index (PPI) mm 1.8% April 12/05/2008 11:30 AM U.K. Producer Price Index (PPI) yy 20.4% April 12/05/2008 3:30 PM Canada House Prices 0.3% March 12/05/2008 9:00 PM USA Budget 155.0b 177.7b April 13/05/2008 11:30 AM U.K. Retail Price Index (RPI) mm 0.3% April 13/05/2008 11:30 AM U.K. Retail Price Index (RPI) yy 3.8% April 13/05/2008 11:30 AM U.K. RPI ex. Mortgage (RPIX) mm 0.5% April 13/05/2008 11:30 AM U.K. RPI ex. Mortgage (RPIX) yy 3.5% April 13/05/2008 11:30 AM U.K. Consumer Price Index (CPI) mm 0.4% April 13/05/2008 11:30 AM U.K. Consumer Price Index (CPI) yy 2.5% April 13/05/2008 3:30 PM USA Import Prices 1.6% 2.8% April 13/05/2008 3:30 PM USA Export Prices 0.6% 1.5% April 13/05/2008 3:30 PM USA Retail Sales mm 0.2% 0.1% April 13/05/2008 3:30 PM USA Core Retail Sales mm 0.0% 0.2% April 13/05/2008 5:00 PM USA IBD Consumer Sentiment 39.2 May 13/05/2008 5:00 PM USA Business Inventories 0.6% 0.6% March 14/05/2008 2:50 AM Japan Current Account 2.9% March 14/05/2008 2:50 AM Japan International Trade Balance mm -6.6% March 14/05/2008 11:30 AM U.K. Initial Jobless Claims -1200 April 14/05/2008 11:30 AM U.K. Unemployment Rate 5.2% March 14/05/2008 12:00 PM Europe Industrial Production mm -0.3% 0.3% March 14/05/2008 12:00 PM Europe Industrial Production yy 2.3% 3.1% March 14/05/2008 3:30 PM USA Core CPI mm 0.2% 0.2% April 15/05/2008 2:50 AM Japan Gross Domestic Product (GDP) qq 2.5% 3.5% Quarter 1 15/05/2008 9:00 AM Germany Harm. Index of Consumer Prices yy 2.6% 3.3% April 15/05/2008 9:00 AM Germany Gross Domestic Product (GDP) qq 1.6% 1.6% Quarter 1 15/05/2008 9:00 AM Germany Consumer Price Index (CPI) mm -0.2% 0.5% April 15/05/2008 9:00 AM Germany Harm. Index of Consumer Prices yy - final 3.3% April 15/05/2008 9:00 AM Germany Gross Domestic Product (GDP) qq 0.3% 0.7% Quarter 1 15/05/2008 9:00 AM Germany Consumer Price Index (CPI) yy 2.4% 3.1% April 15/05/2008 9:00 AM Germany Harm. Index of Consumer Prices yy 3.3 15/05/2008 9:00 AM Germany Gross Domestic Product (GDP) yy 1.8% 1.6% Quarter 1 15/05/2008 9:00 AM Germany Harm. Index of Consumer Prices mm 0.5% April 15/05/2008 12:00 PM Europe Harm. Index of Consumer Prices mm - final 1.0% April 15/05/2008 12:00 PM Europe Harm. Index of Consumer Prices yy 3.3% 3.6% April 15/05/2008 12:00 PM Europe Gross Domestic Product (GDP) qq 0.5% 0.4% Quarter 1 15/05/2008 12:00 PM Europe Gross Domestic Product (GDP) yy 1.9% 2.2% Quarter 1 15/05/2008 12:00 PM Europe Harm. Index of Consumer Prices mm 0.9% April 15/05/2008 3:30 PM USA Initial Jobless Claims Last Week 15/05/2008 3:30 PM USA Jobless Claims 4-weeks Last Week 15/05/2008 3:30 PM USA New-York Fed Survey 0.63 May 15/05/2008 4:00 PM USA Capital Flow 64.1B March 15/05/2008 4:15 PM USA Industrial Production mm 0.0% 0.3% April 15/05/2008 4:15 PM USA Capacity Utilization 80.3% 80.5% April 15/05/2008 5:00 PM USA Philadelphia Fed Survey 24.9- May 16/05/2008 7:30 AM Japan Industrial Production mm 3.1%- March 16/05/2008 8:00 AM Japan Consumer Confidence 36.7 April 16/05/2008 10:15 AM Swiss Retail Sales mm 7.6% March 16/05/2008 12:00 PM Europe International Trade Balance mm 0.8B March 16/05/2008 3:30 PM USA Housing Starts yy 0.94M 0.947M April 16/05/2008 3:30 PM USA Building Permits 0.92M 0.928M April 16/05/2008 4:55 PM USA Michigan Sentiment: current 62.5 62.6 May * GMT +02:00 Results for the week of: 05/05/2008 - 09/05/2008 5 May 2008 - 9 May 2008 Date Hour * Country Data Result Forecast Previous Period 05/05/2008 12:00 AM Japan Market Holiday 05/05/2008 12:00 AM U.K. Market Holiday 05/05/2008 4:30 AM Australia House Prices 1.1% 0.1% 3.2% Quarter 1 05/05/2008 5:00 PM USA Services PMI 49.0 49.6 April 06/05/2008 12:00 AM Japan Market Holiday 06/05/2008 4:30 AM Australia International Trade Balance mm -3.289b March 06/05/2008 7:30 AM Australia Interest Rate Decision 7.25% May 06/05/2008 8:45 AM Swiss Consumer Price Index (CPI) mm 0.9% 0.3% April 06/05/2008 8:45 AM Swiss Consumer Price Index (CPI) yy 2.4% 2.6% April 06/05/2008 10:55 AM Germany Services PMI 54.6 51.8 April 06/05/2008 11:00 AM Europe Services PMI 51.8 51.6 April 06/05/2008 11:30 AM U.K. Services PMI 51.6 52.1 April 06/05/2008 12:00 PM Europe Producer Price Index (PPI) yy 5.6% 5.3% March 06/05/2008 12:00 PM Europe Producer Price Index (PPI) mm 0.7% 0.6% March 06/05/2008 3:30 PM Canada Building Permits -1.0% March 06/05/2008 5:00 PM Canada Services PMI 59.0 April 07/05/2008 11:30 AM U.K. Industrial Production mm -0.1% 0.3% March 07/05/2008 11:30 AM U.K. Industrial Production yy 0.8% 1.3% March 07/05/2008 12:00 PM Europe Retail Sales mm 0.2% -0.5% March 07/05/2008 12:00 PM Europe Retail Sales yy -0.6% -0.2% March 07/05/2008 1:00 PM Germany Factory Orders mm 0.3% -0.5% March 07/05/2008 3:30 PM USA Productivity and Costs 1.6% 1.9% Quarter 1 07/05/2008 5:00 PM USA Pending Homes Sales -1.0% -1.9% March 07/05/2008 10:00 PM USA Consumer Credit mm 6.5b 5.16b March 08/05/2008 1:45 AM New Zealand Unemployment Rate 3.5% 3.4% Quarter 1 08/05/2008 4:30 AM Australia Non-Farm Payroll 14800 April 08/05/2008 4:30 AM Australia Unemployment Rate 4.1% April 08/05/2008 9:00 AM Germany International Trade Balance mm 16.5b 16.4b March 08/05/2008 2:00 PM U.K. Interest Rate Decision 5.0% 5.0% May 08/05/2008 2:45 PM Europe Interest Rate Decision 4.0% 4.0% May 08/05/2008 3:15 PM Canada Housing Starts yy 254.7k April 08/05/2008 3:30 PM USA Initial Jobless Claims 375k 380k Last Week 08/05/2008 5:00 PM USA Wholsale Inventories 0.5% 1.1% March 08/05/2008 5:00 PM USA Wholesale Trade -0.8% March 09/05/2008 8:00 AM Japan Leading Economic Indicators 54.5 March 09/05/2008 9:00 AM Germany Wholesale Price Index (WPI) mm 0.3% 1.6% April 09/05/2008 9:00 AM Germany Wholesale Price Index (WPI) yy 6.6% 7.1% April 09/05/2008 2:00 PM Canada Non-Farm Payroll 14.6k April 09/05/2008 2:00 PM Canada Unemployment Rate 6.0% April 09/05/2008 3:30 PM Canada International Trade Balance mm 4.94b March 09/05/2008 3:30 PM USA International Trade Balance mm -61.7b -62.32b March * GMT +02:00 Results for week of 27/04/2008 - 2/05/2008 27 April 2008 - 2 May 2008 Date Hour * Country Data Result Forecast Previous Period 28/04/2008 2:50 AM Japan Retail Sales yy 1.1% 1.1% 3.1% March 28/04/2008 9:00 AM Germany GFK Consumer Sentiment 5.9 4.4 4.6 May 28/04/2008 7:00 PM USA Mid-West Mnfg Activity 101.0 March 28/04/2008 10:00 PM Canada Budget 0.592b February 29/04/2008 11:30 AM U.K. Consumer Credit mm 2.353b March 29/04/2008 1:00 PM U.K. CBI Sales 1.0 April 29/04/2008 5:00 PM USA Consumer Confidence 62.0 64.5 April 30/04/2008 2:15 AM Japan Manufacturing PMI 49.5 April 30/04/2008 2:30 AM Japan House'hold Spending 0.0% March 30/04/2008 2:30 AM Japan Unemployment Rate 3.9% March 30/04/2008 8:00 AM Japan Construction Orders 18.4% March 30/04/2008 8:00 AM Japan Housing Starts yy -5.0% March 30/04/2008 11:00 AM Germany Unemployment Rate 7.8% 7.8% April 30/04/2008 12:00 PM Europe Service Sentiment 9.0 April 30/04/2008 12:00 PM Europe Unemployment Rate 7.1% 7.1% March 30/04/2008 12:00 PM Europe Economic Sentiment 99.0 99.6 April 30/04/2008 12:00 PM Europe Industrial Sentiment -1.0 0.0 April 30/04/2008 12:00 PM Europe Harm. Index of Consumer Prices yy 3.4% 3.6% April 30/04/2008 12:30 PM U.K. GFK Consumer Sentiment -19.0 April 30/04/2008 12:30 PM Swiss KOF Purchasing Manager ind 1.54 April 30/04/2008 3:15 PM USA ADP employment -40.0k 8.0k April 30/04/2008 3:30 PM Canada Gross Domestic Product (GDP) mm 0.6% February 30/04/2008 3:30 PM Canada Producer Price Index (PPI) mm 0.1% March 30/04/2008 3:30 PM Canada Producer Price Index (PPI) yy -0.8% March 30/04/2008 3:30 PM USA Personal Consumption Exp. qq 3.9% 3.9% Quarter 1 30/04/2008 3:30 PM USA Employment Cost Index (ECI) 0.8% 0.8% Quarter 1 30/04/2008 3:30 PM USA Core PCE qq 2.5% 2.5% Quarter 1 30/04/2008 3:30 PM USA Gross Domestic Product (GDP) qq 0.2% 0.6% Quarter 1 30/04/2008 4:45 PM USA Chicago PMI 48.0 48.2 April 30/04/2008 9:15 PM USA Interest Rate Decision 1.75% 2.25% May 01/05/2008 12:00 AM Europe Market Holiday 01/05/2008 3:30 PM USA Consumer Spending 0.2% 0.1% March 01/05/2008 3:30 PM USA Core PCE mm 0.2% 0.1% March 01/05/2008 3:30 PM USA Core PCE yy 2.0% March 01/05/2008 3:30 PM USA Initial Jobless Claims 342k Last Week 01/05/2008 3:30 PM USA Personal Consumption Exp. yy 3.4% March 01/05/2008 3:30 PM USA Personal Consumption Exp. mm 0.1% March 01/05/2008 3:30 PM USA Personal Income 0.3% 0.5% March 01/05/2008 5:00 PM USA Construction Spending -0.5% -0.3% March 01/05/2008 5:00 PM USA Manufacturing PMI 48.4 48.6 April 02/05/2008 9:00 AM Germany Retail Sales yy -2.3% -0.3% March 02/05/2008 9:00 AM Germany Retail Sales mm 0.6% -1.6% March 02/05/2008 10:30 AM Swiss Manufacturing PMI 55.5 55.3 April 02/05/2008 10:55 AM Germany Manufacturing PMI 53.6 55.1 April 02/05/2008 11:00 AM Europe Manufacturing PMI 50.8 52 April 02/05/2008 3:30 PM USA Non-Farm Payroll -75k -80k April 02/05/2008 3:30 PM USA Unemployment Rate 5.2% 5.1% April 02/05/2008 5:00 PM USA New orders XD 0.3% March 02/05/2008 5:00 PM USA Factory Orders mm 0.2% -1.3% March 02/05/2008 5:00 PM USA Durable Goods Orders -0.3% March * GMT +02:00 Results for week of 21/04/2008 - 25/04/2008 21 April 2008 - 25 April 2008 Date Hour * Country Data Result Forecast Previous Period 21/04/2008 4:30 AM Australia Producer Price Index (PPI) mm 1.9% 1.0% 0.6% Quarter 1 21/04/2008 4:30 AM Australia Producer Price Index (PPI) yy 4.8% 3.9% 2.8% Quarter 1 21/04/2008 10:15 AM Swiss Producer Price Index (PPI) mm 0.2% March 21/04/2008 10:15 AM Swiss Producer Price Index (PPI) yy 3.6% March 22/04/2008 9:15 AM Swiss International Trade Balance mm 1504.4m March 22/04/2008 4:00 PM Canada Interest Rate Decision 3.5% April 22/04/2008 5:00 PM USA Existing Home Sales (Units) 4.96m 5.03m March 22/04/2008 5:00 PM USA Richmond Fed srvs -5.0 March 23/04/2008 2:50 AM Japan International Trade Balance mm 970.0b March 23/04/2008 10:30 AM Germany Services PMI 51.6 51.8 April 23/04/2008 10:30 AM Germany Manufacturing PMI 54.7 55.1 April 23/04/2008 11:00 AM Europe Services PMI 51.4 51.6 April 23/04/2008 11:00 AM Europe Manufacturing PMI 51.7 52.0 April 23/04/2008 12:00 PM Europe Factory Orders mm 2.0% February 23/04/2008 12:00 PM Europe Factory Orders yy 7.3% February 23/04/2008 3:30 PM Canada Core Retail Sales mm 1.3% February 23/04/2008 3:30 PM Canada Retail Sales mm 1.5% February 24/04/2008 11:00 AM Europe Capital Account -19.1b February 24/04/2008 11:00 AM Europe Capital Flow 22.1 February 24/04/2008 11:00 AM Germany IFO Business Climate: index 104.3 104.8 April 24/04/2008 11:30 AM U.K. Retail Sales mm 1.0% March 24/04/2008 11:30 AM U.K. Retail Sales yy 5.5% March 24/04/2008 3:30 PM USA New orders XD -0.2% -1.5% March 24/04/2008 3:30 PM USA Durable Goods Orders 0.1% -1.1% March 24/04/2008 3:30 PM USA Initial Jobless Claims 372.0k Last Week 24/04/2008 5:00 PM USA New Home sales 0.6m 0.59m March 24/04/2008 6:00 PM USA KC Fed -5.0 April 25/04/2008 2:30 AM Japan Consumer Price Index (CPI) yy 1.0% March 25/04/2008 11:00 AM Europe M3 Money Supply yy 10.8% 11.3% March 25/04/2008 11:30 AM U.K. Gross Domestic Product (GDP) yy 2.8% Quarter 1 25/04/2008 11:30 AM U.K. Gross Domestic Product (GDP) qq 0.6% Quarter 1 Results for the week of: 14/04/2008 - 18/04/2008 14 April 2008 - 18 April 2008 Date Hour * Country Data Result Forecast Previous Period 14/04/2008 1:45 AM New Zealand Core Retail Sales mm 0.4% 0.3% February 14/04/2008 1:45 AM New Zealand Retail Sales yy 3.8% 6.3% February 14/04/2008 1:45 AM New Zealand Retail Sales mm 0.3% 0.3% February 14/04/2008 2:50 AM Japan Protocol of last interest rate meeting 14/04/2008 11:30 AM U.K. Producer Price Index (PPI) mm 1.7% March 14/04/2008 11:30 AM U.K. Producer Price Index (PPI) yy 19.3% March 14/04/2008 11:30 AM U.K. Core PPI mm 0.2% March 14/04/2008 11:30 AM U.K. Core PPI yy 3.0% March 14/04/2008 12:00 PM Europe Industrial Production mm 0.2% 0.9% February 14/04/2008 12:00 PM Europe Industrial Production yy 3.0% 3.8% February 14/04/2008 3:30 PM USA Core Retail Sales mm 0.2% -0.2% March 14/04/2008 3:30 PM USA Retail Sales mm 0.1% -0.6% March 14/04/2008 5:00 PM USA Business Inventories 0.4% 0.8% February 15/04/2008 11:30 AM U.K. Retail Price Index (RPI) mm 0.8% March 15/04/2008 11:30 AM U.K. Retail Price Index (RPI) yy 4.1% March 15/04/2008 11:30 AM U.K. Consumer Price Index (CPI) mm 0.7% March 15/04/2008 11:30 AM U.K. RPI ex. Mortgage (RPIX) mm 0.8% March 15/04/2008 11:30 AM U.K. RPI ex. Mortgage (RPIX) yy 3.7% March 15/04/2008 11:30 AM U.K. Consumer Price Index (CPI) yy 2.5% March 15/04/2008 12:00 PM Germany ZEW Economic Sentiment -30.5 -32.0 April 15/04/2008 3:30 PM USA Producer Price Index (PPI) yy 6.4% March 15/04/2008 3:30 PM USA Producer Price Index (PPI) mm 0.4% 0.3% March 15/04/2008 3:30 PM USA New-York Fed Survey -17.5 -22.23 April 15/04/2008 3:30 PM USA Core CPI mm 0.2% 0.5% March 15/04/2008 3:30 PM USA Core PPI yy 2.4% March 15/04/2008 4:00 PM USA Capital Flow 37.4b February 16/04/2008 9:00 AM Germany Consumer Price Index (CPI) mm 0.5% 0.5% March 16/04/2008 9:00 AM Germany Consumer Price Index (CPI) yy 3.1% 2.8% March 16/04/2008 11:30 AM U.K. Unemployment Rate 5.2% February 16/04/2008 12:00 PM Europe Harm. Index of Consumer Prices mm 0.9% 0.3% March 16/04/2008 12:00 PM Europe Harm. Index of Consumer Prices yy 0.9% 0.3% March 16/04/2008 12:00 PM Europe Harm. Index of Consumer Prices yy 3.5% 3.3% March 16/04/2008 3:30 PM Canada Manufacturing PMI 1.3% February 16/04/2008 3:30 PM USA Consumer Price Index (CPI) yy 4.1% 4.0% March 16/04/2008 3:30 PM USA Consumer Price Index (CPI) yy 4.1% 4.0% March 16/04/2008 3:30 PM USA New Home sales 1.02m 1.065m March 16/04/2008 3:30 PM USA Core CPI mm 0.2% 0.0% March 16/04/2008 3:30 PM USA Consumer Price Index (CPI) mm 0.3% 0.0% March 16/04/2008 3:30 PM USA Core CPI yy 2.4% 2.3% March 16/04/2008 3:30 PM USA Consumer Price Index (CPI) mm 0.3% 0.0% March 16/04/2008 4:15 PM USA Industrial Production mm -0.1% -0.5% March 17/04/2008 2:30 AM Japan Tankan Survey 8.0 April 17/04/2008 10:15 AM USA Retail Sales mm 1.3% February 17/04/2008 12:00 PM Swiss ZEW Economic Sentiment -71.7 April 17/04/2008 1:00 PM Canada Consumer Price Index (CPI) mm 0.4% March 17/04/2008 1:00 PM Canada Core CPI mm 0.5% March 17/04/2008 2:00 PM Canada Consumer Price Index (CPI) yy 1.8% March 17/04/2008 2:00 PM Canada Core CPI yy 1.5% March 17/04/2008 3:30 PM USA Initial Jobless Claims 357.0 Last Week 17/04/2008 5:00 PM USA Leading Economic Indicators -0.1% -0.3% March 18/04/2008 9:00 AM Germany Producer Price Index (PPI) mm 0.4% 0.7% March 18/04/2008 9:00 AM Germany Producer Price Index (PPI) yy 4.1% 3.8% March 18/04/2008 3:30 PM Canada Leading Economic Indicators -0.3% March 18/04/2008 3:30 PM Canada Wholesale Trade 2.6% February * GMT +02:00 Results for the week of: 7/04/2008 - 11/04/2008 7 April 2008 - 11 April 2008 Date Hour * Country Data Result Forecast Previous Period 07/04/2008 4:30 AM Australia International Trade Balance mm -3289m -2500m -2723m February 07/04/2008 4:30 AM Australia Building Permits 0.1% 0.0% 1.9% February 07/04/2008 8:00 AM Japan Leading Economic Indicators 50.0 36.4 February 07/04/2008 8:45 AM Swiss Unemployment Rate 2.5% 2.5% 2.5% March 07/04/2008 1:00 PM Germany Industrial Production mm 0.4% -0.5% 1.8% February 07/04/2008 3:30 PM Canada Building Permits -1.0% 1.0% -2.9% February 07/04/2008 10:00 PM USA Consumer Credit mm 6.0b 6.9b February 08/04/2008 3:15 PM Canada Housing Starts yy 256.9k March 08/04/2008 5:00 PM USA IBD Consumer Sentiment 42.5 April 08/04/2008 5:00 PM USA Pending Homes Sales -0.8% 0.0% February 08/04/2008 9:00 PM USA Productivity and Costs 08/04/2008 9:00 PM USA Protocol of last interest rate meeting 09/04/2008 4:30 AM Japan Interest Rate Decision 0.5% April 09/04/2008 9:00 AM Germany International Trade Balance mm 16.3b 16.1b February 09/04/2008 11:30 AM U.K. Industrial Production yy 0.4% February 09/04/2008 11:30 AM U.K. Industrial Production mm -0.1% February 09/04/2008 12:00 PM Europe Gross Domestic Product (GDP) qq 0.4% 0.4% Quarter 4 09/04/2008 12:00 PM Europe Gross Domestic Product (GDP) yy 2.2% 2.2% Quarter 4 09/04/2008 5:00 PM USA Wholesale Trade 2.6% February 09/04/2008 5:10 PM USA Wholsale Inventories 0.6% 1.0% February 10/04/2008 2:50 AM Japan Machinery Orders mm 19.6% February 10/04/2008 2:50 AM Japan Capital Account 8.1% February 10/04/2008 2:50 AM Japan International Trade Balance mm -24.1% February 10/04/2008 4:30 AM Australia Unemployment Rate 4.1% 4.0% March 10/04/2008 4:30 AM Australia Non-Farm Payroll 10000 36700 March 10/04/2008 11:30 AM U.K. International Trade Balance mm -7.503b February 10/04/2008 2:00 PM U.K. Interest Rate Decision 5.0% 5.25% April 10/04/2008 2:45 PM Europe Interest Rate Decision 4.0% 4.0% April 10/04/2008 3:30 PM Canada International Trade Balance mm 3.26b February 10/04/2008 3:30 PM USA Initial Jobless Claims 407.0k Last Week 10/04/2008 3:30 PM USA International Trade Balance mm 3.26b February 10/04/2008 3:30 PM USA International Trade Balance mm -57.4b -58.2b February 10/04/2008 9:00 PM USA Budget -71.9b -96.27b March 11/04/2008 3:30 PM USA Export Prices 0.5% 0.9% March 11/04/2008 3:30 PM USA Import Prices 1.5% 0.2% March * GMT +02:00 Results for the week of: 31/03/2008 - 04/04/2008 31 March 2008 - 4 April 2008 Date Hour * Country Data Result Forecast Previous Period 31/03/2008 2:15 AM Japan Manufacturing PMI 50.8 March 31/03/2008 2:50 AM Japan Industrial Production mm -2.2% February 31/03/2008 8:00 AM Japan Construction Orders -2.5% February 31/03/2008 8:00 AM Japan Housing Starts yy -5.7% February 31/03/2008 11:00 AM Europe M3 Money Supply yy 11.4% 11.5% February 31/03/2008 12:00 PM Europe Economic Sentiment 100.5 100.1 March 31/03/2008 12:00 PM Europe Industrial Sentiment 1.0 0.0 March 31/03/2008 12:00 PM Europe Harm. Index of Consumer Prices yy 3.3% 3.3% March 31/03/2008 12:00 PM Europe Service Sentiment 10.0 March 31/03/2008 3:30 PM Canada Gross Domestic Product (GDP) mm -0.7% January 31/03/2008 4:45 PM USA Chicago PMI 46.0 44.5 March 01/04/2008 2:50 AM Japan Tankan Survey 10.5% Quarter 1 01/04/2008 5:30 AM Australia Interest Rate Decision 7.25% April 01/04/2008 10:30 AM Swiss Manufacturing PMI 60.5 March 01/04/2008 10:55 AM Germany Manufacturing PMI 54.9 54.3 March 01/04/2008 11:00 AM Europe Manufacturing PMI 52.0 52.3 March 01/04/2008 11:00 AM Germany Unemployment Rate 7.9% 8.0% March 01/04/2008 11:30 AM U.K. Manufacturing PMI 51.3 March 01/04/2008 12:00 PM Europe Unemployment 7.1% 7.1% February 01/04/2008 3:30 PM Canada Producer Price Index (PPI) yy -0.1% February 01/04/2008 3:30 PM Canada Producer Price Index (PPI) mm 0.9% February 01/04/2008 5:00 PM USA Construction Spending -0.9% -1.7% February 01/04/2008 5:00 PM USA Manufacturing PMI 48.0 48.3 March 01/04/2008 5:00 PM USA Manufacturing PMI 48.0 48.3 March 02/04/2008 11:30 AM U.K. Consumer Credit mm 0.941b February 02/04/2008 12:00 PM Europe Producer Price Index (PPI) yy 5.2% 4.9% February 02/04/2008 12:00 PM Europe Producer Price Index (PPI) mm 0.6% 0.8% February 02/04/2008 3:15 PM USA ADP employment -38.0k -23.0k March 02/04/2008 5:00 PM USA Factory Orders mm 0.6% -2.5% February 02/04/2008 5:00 PM USA Durable Goods Orders -1.7% February 02/04/2008 5:00 PM USA New orders XD -1.6% February 02/04/2008 5:00 PM USA Factory Orders mm 0.6% -2.5% February 03/04/2008 10:55 AM Germany Services PMI 52.5 52.2 March 03/04/2008 11:00 AM Europe Services PMI 51.7 52.3 March 03/04/2008 11:30 AM U.K. Services PMI 54.0 March 03/04/2008 12:00 PM Europe Retail Sales mm 0.2% 0.4% February 03/04/2008 12:00 PM Europe Retail Sales yy -0.1% February 03/04/2008 3:30 PM USA Initial Jobless Claims 366.0k Last Week 03/04/2008 5:00 PM USA Services PMI 49.0 49.3 March 03/04/2008 7:00 PM USA Mid-West Mnfg Activity 105.3 February 04/04/2008 2:30 AM Australia Retail Sales mm 0.0% February 04/04/2008 8:45 AM Swiss Consumer Price Index (CPI) mm 0.1% March 04/04/2008 8:45 AM Swiss Consumer Price Index (CPI) yy 2.4% March 04/04/2008 1:00 PM Germany Factory Orders mm 1.0% -1.5% February 04/04/2008 2:00 PM Canada Unemployment 5.8% March 04/04/2008 2:00 PM Canada Non-Farm Payroll 43.3k March 04/04/2008 3:30 PM USA Non-Farm Payroll -40.0k -63.0k March 04/04/2008 3:30 PM USA Unemployment 5.0% 4.8% March 04/04/2008 5:00 PM Canada Services PMI 62.0 March * GMT +02:00 Results for the week of: 24/03/2008 - 28/03/2008 24 March 2008 - 28 March 2008 Date Hour * Country Data Result Forecast Previous Period 24/03/2008 12:00 AM U.K. Market Holiday 24/03/2008 12:00 AM Germany Market Holiday 24/03/2008 12:00 AM Swiss Market Holiday 24/03/2008 4:00 PM USA Existing Home Sales (Units) 4.85m 4.89m February 25/03/2008 2:30 PM Canada Retail Sales mm 1.2% 0.6% January 25/03/2008 4:00 PM USA Consumer Confidence 73.5 75.0 March 25/03/2008 4:00 PM USA Richmond Fed srvs 1.0 March 26/03/2008 1:50 AM Japan International Trade Balance mm 1146.4B -79.3B February 26/03/2008 11:00 AM Europe Current Account -10.3B January 26/03/2008 11:00 AM Europe Capital Flow -19.5B January 26/03/2008 11:00 AM Germany IFO Business Climate: index 103.3 104.1 March 26/03/2008 12:00 PM Europe Factory Orders mm 0.3% -3.6% January 26/03/2008 12:00 PM Europe Factory Orders yy 3.9% 2.1% January 26/03/2008 2:30 PM USA New orders XD -0.8% -4.4% February 26/03/2008 2:30 PM USA Durable Goods Orders 0.8% -5.1% February 26/03/2008 2:30 PM USA Personal Consumption Exp. qq 4.1% 4.1% Quarter 4 26/03/2008 4:00 PM USA New Home sales 0.58m 0.588m February 26/03/2008 5:00 PM USA KC Fed -5.0 March 27/03/2008 9:00 AM Germany GFK Consumer Sentiment 4.5 4.5 April 27/03/2008 1:00 PM U.K. CBI Sales -5.0 -3.0 March 27/03/2008 2:30 PM USA Core PCE qq 2.7% 2.7% Quarter 4 27/03/2008 2:30 PM USA Gross Domestic Product (GDP) qq 0.6% 0.6% Quarter 4 27/03/2008 2:30 PM USA Initial Jobless Claims 360.0k 378.0k Last Week 27/03/2008 2:30 PM USA Personal Consumption Exp. qq 4.1% 4.1% Quarter 4 28/03/2008 1:30 AM Japan Consumer Price Index (CPI) mm 0.7% February 28/03/2008 1:30 AM Japan Consumer Price Index (CPI) yy 0.8% February 28/03/2008 1:30 AM Japan Unemployment Rate 3.8% February 28/03/2008 9:00 AM U.K. House Prices 2.0% -0.5% March 28/03/2008 9:00 AM Germany Import Prices 0.5% 0.8% February 28/03/2008 11:30 AM U.K. Current Account -18.0B -20.04B Quarter 4 28/03/2008 11:30 AM U.K. Gross Domestic Product (GDP) qq 0.6% 0.6% Quarter 4 28/03/2008 11:30 AM U.K. Gross Domestic Product (GDP) yy 2.9% 2.9% Quarter 4 28/03/2008 12:30 PM Swiss KOF Purchasing Manager ind 1.58 1.65 March 28/03/2008 2:30 PM USA Core PCE yy 2.2% February 28/03/2008 2:30 PM USA Personal Consumption Exp. mm 0.4% February 28/03/2008 2:30 PM USA Personal Consumption Exp. yy 3.7% February 28/03/2008 2:30 PM USA Personal Income 0.3% 0.3% February 28/03/2008 2:30 PM USA Core PCE mm 0.1% 0.3% February * GMT +02:00 Results for the week of: 17/03/2008 - 21/03/2008 17 March 2008 - 21 March 2008 Date Hour * Country Data Result Forecast Previous Period 17/03/2008 7:00 AM Japan Leading Economic Indicators 30.0 January 17/03/2008 10:15 AM Swiss Retail Sales mm 1.2% January 17/03/2008 2:30 PM USA Current Account -184.6b -178.46b Quarter 4 17/03/2008 2:30 PM USA New-York Fed Survey -7.8 -11.72 March 17/03/2008 3:00 PM USA Capital Flow 60.4b January 17/03/2008 3:15 PM USA Capacity Utilization 81.3% 81.5% February 17/03/2008 3:15 PM USA Industrial Production mm -0.1% 0.1% February 17/03/2008 5:00 PM USA Mid-West Mnfg Activity 103 104.7 January 18/03/2008 10:15 AM Swiss Factory Orders yy 15.7% Quarter 4 18/03/2008 11:30 AM U.K. Consumer Price Index (CPI) mm -0.7% February 18/03/2008 11:30 AM U.K. Consumer Price Index (CPI) yy 2.2% February 18/03/2008 11:30 AM U.K. Retail Price Index (RPI) mm -0.5% February 18/03/2008 11:30 AM U.K. Retail Price Index (RPI) yy 4.1% February 18/03/2008 11:30 AM U.K. RPI ex. Mortgage (RPIX) mm -0.4% February 18/03/2008 11:30 AM U.K. RPI ex. Mortgage (RPIX) yy 3.4% February 18/03/2008 1:00 PM Canada Consumer Price Index (CPI) yy 2.2% February 18/03/2008 1:00 PM Canada Core CPI mm 0.1% February 18/03/2008 1:00 PM Canada Core CPI yy 1.4% February 18/03/2008 1:00 PM Canada Consumer Price Index (CPI) mm -0.2% February 18/03/2008 2:30 PM USA Producer Price Index (PPI) yy 7.4% February 18/03/2008 2:30 PM USA Building Permits 1.032m 1.061m February 18/03/2008 2:30 PM USA Producer Price Index (PPI) mm 0.5% 1.0% February 18/03/2008 2:30 PM USA Housing Starts yy 1m 1.012m February 18/03/2008 2:30 PM USA Core PPI mm 0.2% 0.4% February 18/03/2008 2:30 PM USA Core PPI yy 2.3% February 18/03/2008 8:15 PM USA Interest Rate Decision 2.5% 3.0% March 19/03/2008 1:30 AM Japan Tankan Survey 9.0 March 19/03/2008 11:30 AM U.K. Initial Jobless Claims -10.8k February 19/03/2008 11:30 AM U.K. Unemployment Rate 5.2% January 19/03/2008 12:00 PM Europe International Trade Balance mm -4.2b January 19/03/2008 2:30 PM Canada Wholesale Trade -2.9% January 20/03/2008 12:00 AM Japan Market Holiday 20/03/2008 9:00 AM Germany Producer Price Index (PPI) mm 0.3% 0.8% February 20/03/2008 9:00 AM Germany Producer Price Index (PPI) yy 3.3% 3.3% February 20/03/2008 9:15 AM Swiss International Trade Balance mm 1055.5m February 20/03/2008 10:15 AM Swiss Producer Price Index (PPI) mm 0.5% February 20/03/2008 11:00 AM Europe Composite PMI 52.8 March 20/03/2008 11:00 AM Europe Manufacturing PMI 52.0 52.3 March 20/03/2008 11:00 AM Europe Services PMI 52.3 52.3 March 20/03/2008 11:30 AM U.K. Retail Sales yy 5.6% February 20/03/2008 11:30 AM U.K. Retail Sales mm 0.8% February 20/03/2008 2:30 PM Canada Leading Economic Indicators 0.2% February 20/03/2008 2:30 PM USA Initial Jobless Claims 353.0k Last Week 20/03/2008 4:00 PM USA Leading Economic Indicators -0.2% -0.1% February 20/03/2008 4:00 PM USA Philadelphia Fed Survey -16.5 -24.0 March 21/03/2008 12:00 AM U.K. Market Holiday 21/03/2008 12:00 AM Canada Market Holiday 21/03/2008 12:00 AM Germany Market Holiday 21/03/2008 12:00 AM USA Market Holiday 21/03/2008 12:00 AM Swiss Market Holiday Results for the week of: 10/03/2008 - 14/03/2008 10 march 2008 - 14 march 2008 Date Hour * Country Data Result Forecast Previous Period 10/03/2008 1:50 AM Japan Machinery Orders mm -19.6% -3.2% January 10/03/2008 9:00 AM Germany International Trade Balance mm 16.4b 15.6b January 10/03/2008 11:30 AM U.K. Producer Price Index (PPI) mm 1.5% 2.6% February 10/03/2008 11:30 AM U.K. Producer Price Index (PPI) yy 18.2% 18.9% February 10/03/2008 11:30 AM U.K. Industrial Production mm 0.1% -0.1% January 10/03/2008 11:30 AM U.K. Industrial Production yy 0.5% 0.6% January 10/03/2008 11:30 AM U.K. Core PPI mm 0.4% 0.8% February 10/03/2008 11:30 AM U.K. Core PPI yy 3.2% 3.2% February 10/03/2008 2:15 PM Canada Housing Starts yy 222.7 February 10/03/2008 4:00 PM USA Wholsale Inventories 0.4% 1.1% January 10/03/2008 4:00 PM USA Wholesale Trade -0.7% January 11/03/2008 12:00 PM Germany ZEW Economic Sentiment -39.0 -39.5 March 11/03/2008 2:30 PM Canada International Trade Balance mm 2.35b January 11/03/2008 2:30 PM USA International Trade Balance mm -59.5b -59.5b January 11/03/2008 4:00 PM USA IBD Consumer Sentiment 44.5 March 12/03/2008 1:50 AM Japan Protocol of last interest rate meeting 12/03/2008 1:50 AM Japan Current Account -4.7% January 12/03/2008 1:50 AM Japan Gross Domestic Product (GDP) yy 3.7% Quarter 4 12/03/2008 1:50 AM Japan Gross Domestic Product (GDP) qq 0.9% Quarter 4 12/03/2008 7:00 AM Japan Consumer Confidence 37.5 February 12/03/2008 11:30 AM U.K. International Trade Balance mm 7.5b -7.57b January 12/03/2008 12:00 PM Europe Industrial Production mm 0.3% -0.2% January 12/03/2008 12:00 PM Europe Industrial Production yy 2.5% 1.3% January 12/03/2008 8:00 PM USA Budget -140.0b -120.0b February 13/03/2008 2:30 AM Australia Unemployment Rate 4.2% 4.1% February 13/03/2008 2:30 AM Australia Non-Farm Payroll 15000 26800 February 13/03/2008 6:30 AM Japan Industrial Production mm -2.0% January 13/03/2008 1:30 PM USA Core Retail Sales mm 0.2% 0.3% February 13/03/2008 2:30 PM USA Export Prices 0.6% 1.2% February 13/03/2008 2:30 PM USA Import Prices 0.8% 1.7% February 13/03/2008 2:30 PM USA Initial Jobless Claims 351.0 Last Week 13/03/2008 2:30 PM USA Retail Sales mm 0.2% 0.3% February 13/03/2008 3:00 PM Swiss Interest Rate Decision Quarter 1 13/03/2008 4:00 PM USA Business Inventories 0.3% 0.6% January 14/03/2008 9:00 AM Germany Consumer Price Index (CPI) mm 0.5% -0.4% February 14/03/2008 9:00 AM Germany Consumer Price Index (CPI) yy 2.8% 2.8% February 14/03/2008 9:00 AM Germany Core HICP mm 0.5% -0.4% February 14/03/2008 9:00 AM Germany Core HICP yy 2.9% 2.9% February 14/03/2008 12:00 PM Europe Core HICP mm 0.3% -0.8% February 14/03/2008 12:00 PM Europe Core HICP yy 2.3% 2.3% February 14/03/2008 2:30 PM USA Core CPI yy 2.5% 2.5% February 14/03/2008 2:30 PM USA Consumer Price Index (CPI) yy 4.4% 4.3% February 14/03/2008 2:30 PM USA Core CPI mm 0.2% 0.3% February 14/03/2008 2:30 PM USA Consumer Price Index (CPI) mm 0.3% 0.4% February * GMT +02:00 Results for the week of: 3/03/2008 - 07/03/2008 3 march 2008 - 7 march 2008 03/03/2008 10:30 AM Swiss Services PMI 60.5 60.4 61.6 February 03/03/2008 10:55 AM Germany Manufacturing PMI 54.3 54.0 54.4 February 03/03/2008 11:00 AM Europe Manufacturing PMI 52.3 52.3 52.8 February 03/03/2008 11:30 AM U.K. Manufacturing PMI 51.3 51.0 50.6 February 03/03/2008 12:00 PM Europe Harm. Index of Consumer Prices yy 3.2% 3.2% 3.2% February 03/03/2008 3:30 PM Canada Gross Domestic Product (GDP) mm -0.7% -0.2% 0.1% December 03/03/2008 3:30 PM Canada Gross Domestic Product (GDP) yy 0.8% 1.1% 2.9% Quarter 4 03/03/2008 5:00 PM USA Manufacturing PMI 48.3 48 50.7 February 04/03/2008 2:30 AM Australia Retail Sales mm 0.0% 0.4% 0.5% January 04/03/2008 2:30 AM Australia Current Account 19.35B -18B 15.5B Quarter 4 04/03/2008 5:30 AM Australia Interest Rate Decision 7.25% 7.25% 7.0% March 04/03/2008 8:45 AM Swiss Consumer Price Index (CPI) mm 0.1% 0.2% -0.3% February 04/03/2008 8:45 AM Swiss Gross Domestic Product (GDP) qq 1.0% 0.5% 0.8% Quarter 4 04/03/2008 8:45 AM Swiss Consumer Price Index (CPI) yy 2.4% 2.4% 2.4% February 04/03/2008 8:45 AM Swiss Gross Domestic Product (GDP) yy 3.6% 2.8% 2.9% Quarter 4 04/03/2008 12:00 PM Europe Producer Price Index (PPI) mm 0.8% 0.8% 0.1% January 04/03/2008 12:00 PM Europe Gross Domestic Product (GDP) yy 2.2% 2.3% 2.7% Quarter 4 04/03/2008 12:00 PM Europe Producer Price Index (PPI) yy 4.9% 4.9% 4.3% January 04/03/2008 4:00 PM Canada Interest Rate Decision 3.5% 3.5% 4.0% March 04/03/2008 5:00 PM USA Fed Chairman Bernanke Speaks 05/03/2008 2:30 AM Australia Gross Domestic Product (GDP) qq 0.6% 0.6% 1.0% Quarter 4 05/03/2008 2:30 AM Australia Gross Domestic Product (GDP) yy 3.9% 3.7% 4.3% Quarter 4 05/03/2008 10:55 AM Germany Services PMI 52.2 50.9 49.2 February 05/03/2008 11:00 AM Europe Services PMI 52.3 52.3 50.6 February 05/03/2008 11:30 AM U.K. Services PMI 54.0 52.1 52.5 February 05/03/2008 12:00 PM Europe Retail Sales mm 0.4% 0.4% -0.1% January 05/03/2008 12:00 PM Europe Retail Sales yy -0.1% 0.1% -2.0% January 05/03/2008 3:15 PM USA ADP employment -23k 20.0k 130.0k February 05/03/2008 5:00 PM USA Durable Goods Orders -5.1% -5.3% January 05/03/2008 5:00 PM USA New orders XD -4.4% -4.7% January 05/03/2008 5:00 PM USA Factory Orders mm -2.5% -2.5% 2.3% January 05/03/2008 5:00 PM USA Services PMI 49.3 47 41.9 February 05/03/2008 9:00 PM USA Fed Beige Book 05/03/2008 10:00 PM New Zealand Interest Rate Decision 8.25% 8.25% 8.25% March 06/03/2008 2:30 AM Australia Building Permits 1.9% 5.0% -16.0% January 06/03/2008 2:30 AM Australia International Trade Balance mm -2723M -2800m -1936m January 06/03/2008 8:45 AM Swiss Unemployment Rate 2.5% 2.5% 2.6% February 06/03/2008 1:00 PM Germany Factory Orders mm -1.5% 0.2% -1.7% January 06/03/2008 2:00 PM U.K. Interest Rate Decision 5.25% 5.25% 5.25% March 06/03/2008 2:45 PM Europe Interest Rate Decision 4.0% 4.0% 4.0% March 06/03/2008 3:30 PM Canada Building Permits -2.9% 1.0% 0.4% January 06/03/2008 3:30 PM USA Initial Jobless Claims 351k 360.0k 373.0k Last Week 06/03/2008 5:00 PM Canada Services PMI 62.0 56.0 56.2 February 06/03/2008 5:00 PM USA Pending Homes Sales 0.0% -0.5% -1.5% January 07/03/2008 6:00 AM Japan Interest Rate Decision 0.5% 0.5% March 07/03/2008 1:00 PM Germany Industrial Production mm 0.4% 0.8% January 07/03/2008 2:00 PM Canada Non-Farm Payroll 8.0k 46.4K February 07/03/2008 2:00 PM Canada Unemployment 5.9% 5.8% February 07/03/2008 3:30 PM USA Unemployment 4.9% 5.0% February 07/03/2008 3:30 PM USA Non-Farm Payroll 25k -17.0K February 07/03/2008 10:00 PM USA Consumer Credit mm 7.0B 4.5B January Results for the week of: 25/02/2008 - 01/03/2008 25 February 2008 - 29 February 2008 25/02/2008 5:00 PM USA Existing Home Sales (Units) 4.82m 4.89m January 25/02/2008 8:50 PM Europe ECB President Trichet Speaks 26/02/2008 9:00 AM Germany Gross Domestic Product (GDP) qq 0.7% Quarter 4 26/02/2008 9:00 AM Germany Gross Domestic Product (GDP) yy 2.4% Quarter 4 26/02/2008 11:00 AM Germany IFO Business Climate: index 102.9 103.4 February 26/02/2008 1:00 PM U.K. CBI Sales 2.0 4.0 February 26/02/2008 3:30 PM USA Producer Price Index (PPI) mm 0.3% -0.1% January 26/02/2008 3:30 PM USA Core PPI mm 0.2% 0.2% January 26/02/2008 3:30 PM USA Core PPI yy 2.0% January 26/02/2008 3:30 PM USA Producer Price Index (PPI) yy 6.3% January 26/02/2008 5:00 PM USA Consumer Confidence 85.0 87.9 February 26/02/2008 5:00 PM USA Richmond Fed srvs -12.0 February 26/02/2008 11:45 PM New Zealand Building Permits -5.2% January 27/02/2008 9:00 AM Germany GFK Consumer Sentiment 4.5 4.5 March 27/02/2008 11:00 AM Europe M3 Money Supply yy 11.3% 11.5% January 27/02/2008 11:30 AM U.K. Gross Domestic Product (GDP) yy 2.9% 2.9% Quarter 4 27/02/2008 11:30 AM U.K. Gross Domestic Product (GDP) qq 0.6% 0.6% Quarter 4 27/02/2008 3:30 PM USA New orders XD 2.7% January 27/02/2008 3:30 PM USA Durable Goods Orders -1.2% 5.0% January 27/02/2008 5:00 PM USA Fed Chairman Bernanke Speaks 27/02/2008 5:00 PM USA New Home sales 0.6m 0.604m January 28/02/2008 1:50 AM Japan Retail Sales yy 0.0% 0.2% January 28/02/2008 1:50 AM Japan Industrial Production mm -0.8% 1.4% January 28/02/2008 10:15 AM Swiss Non-Farm Payroll 3.871m Quarter 4 28/02/2008 11:00 AM Germany Unemployment Rate 8.0% 8.1% February 28/02/2008 3:30 PM USA Core PCE qq 2.7% 2.7% Quarter 4 28/02/2008 3:30 PM USA Gross Domestic Product (GDP) qq 1.9% 1.9% Quarter 4 28/02/2008 3:30 PM USA Initial Jobless Claims 349.0K Last Week 28/02/2008 3:30 PM USA Personal Consumption Exp. qq 3.9% Quarter 4 28/02/2008 5:00 PM USA Fed Chairman Bernanke Speaks 28/02/2008 6:00 PM USA KC Fed 7.0 February 28/02/2008 11:45 PM New Zealand International Trade Balance mm 33m January 29/02/2008 1:15 AM Japan Manufacturing PMI 52.3 February 29/02/2008 1:15 AM Japan House'hold Spending 0.2% 2.2% January 29/02/2008 1:30 AM Japan Consumer Price Index (CPI) yy 0.9% 0.8% January 29/02/2008 1:30 AM Japan Consumer Price Index (CPI) mm 0.7% January 29/02/2008 1:30 AM Japan Unemployment 3.8% 3.8% January 29/02/2008 7:00 AM Japan Housing Starts yy -12.3% -19.2% January 29/02/2008 7:00 AM Japan Construction Orders 4.7% January 29/02/2008 9:00 AM Germany Consumer Price Index (CPI) mm -0.3% 0.5% January 29/02/2008 9:00 AM Germany Consumer Price Index (CPI) yy 2.7% 2.8% January 29/02/2008 9:00 AM Germany Harm. Index of Consumer Prices mm -0.3% 0.7% January 29/02/2008 9:00 AM Germany Harm. Index of Consumer Prices yy 3.0% 3.1% January 29/02/2008 11:30 AM U.K. Consumer Credit mm 0.8b 0.557b January 29/02/2008 12:00 PM Europe Harm. Index of Consumer Prices mm -0.4% 0.4% January 29/02/2008 12:00 PM Europe Harm. Index of Consumer Prices yy 3.2% 3.2% January 29/02/2008 12:00 PM Europe Unemployment Rate 7.2% 7.2% January 29/02/2008 12:30 PM U.K. GFK Consumer Sentiment -14.0 -13.0 February 29/02/2008 12:30 PM Swiss KOF Purchasing Manager ind 1.64 1.7 February 29/02/2008 3:30 PM Canada Producer Price Index (PPI) yy -0.9% January 29/02/2008 3:30 PM Canada Current Account 1.04b Quarter 4 29/02/2008 3:30 PM Canada Producer Price Index (PPI) mm 1.1% January 29/02/2008 3:30 PM USA Personal Consumption Exp. yy 3.5% January 29/02/2008 3:30 PM USA Core PCE mm 0.2% 0.2% January 29/02/2008 3:30 PM USA Core PCE yy 2.2% January 29/02/2008 3:30 PM USA Personal Income 0.2% 0.5% January 29/02/2008 3:30 PM USA Personal Consumption 0.2% 0.2% January 29/02/2008 3:30 PM USA Personal Consumption Exp. mm 0.2% January 29/02/2008 4:45 PM USA Chicago PMI 51.0 51.5 February 29/02/2008 5:00 PM USA U.Michigan Consumer Sentiment 69.6 78.4 February * GMT +02:00 Results for the week of: 18/02/2008 - 23/02/2008 18 February 2008 - 23 February 2008 18/02/2008 12:00 AM USA Market Holiday 18/02/2008 7:00 AM Japan Leading Economic Indicators 45.5 40.0 December 18/02/2008 10:15 AM Swiss Retail Sales mm 1.2% 2.7% 2.9% December 19/02/2008 2:00 PM Canada Consumer Price Index (CPI) yy 2.2% 2.2% 2.4% January 19/02/2008 2:00 PM Canada Consumer Price Index (CPI) mm - core 0.1% 0.1% -0.3% January 19/02/2008 2:00 PM Canada Consumer Price Index (CPI) yy - core 1.4% 1.4% 1.5% January 19/02/2008 2:00 PM Canada Consumer Price Index (CPI) mm -0.2% -0.2% 0.1% January 19/02/2008 3:30 PM Canada Wholesale Trade -2.9% -0.6% 0.3% December 20/02/2008 1:50 AM Japan Protocol of last interest rate meeting January 20/02/2008 9:00 AM Germany Producer Price Index (PPI) mm 0.8% 0.3% -0.1% January 20/02/2008 9:00 AM Germany Producer Price Index (PPI) yy 3.3% 2.8% 2.5% January 20/02/2008 11:30 AM U.K. Protocol of last interest rate meeting 20/02/2008 1:00 PM U.K. CBI Orders 3.0 -1.0 2.0 February 20/02/2008 3:30 PM Canada Leading Economic Indicators 0.2% 0.0% -0.1% January 20/02/2008 3:30 PM USA Consumer Price Index (CPI) yy 4.3% 4.2% 4.1% January 20/02/2008 3:30 PM USA Building Permits 1.048M 1.04m 1.08m January 20/02/2008 3:30 PM USA Core CPI mm 0.3% 0.2% 0.2% January 20/02/2008 3:30 PM USA Consumer Price Index (CPI) mm 0.4% 0.3% 0.4% January 20/02/2008 3:30 PM USA Core CPI yy 2.5% 2.4% 2.4% January 20/02/2008 3:30 PM USA Housing Starts yy 1.012M 1.01M 1.006M January 20/02/2008 9:00 PM USA Protocol of last interest rate meeting 21/02/2008 1:50 AM Japan International Trade Balance mm -79.3b 35.0b 877.9b January 21/02/2008 9:15 AM Swiss International Trade Balance mm 1215m 198.1m January 21/02/2008 10:15 AM Swiss Producer Price Index (PPI) mm 0.5% 0.0% -0.1% January 21/02/2008 10:15 AM Swiss Producer Price Index (PPI) yy 3.7% 3.1% 3.0% January 21/02/2008 11:00 AM Europe Current Account -10.3b 0.2b 0.7b December 21/02/2008 11:00 AM Europe Capital Flow -19.5b 21.2b December 21/02/2008 11:30 AM U.K. Retail Sales mm 0.8% 0.2% -0.4% January 21/02/2008 11:30 AM U.K. Retail Sales yy 5.6% 4.7% 2.7% January 21/02/2008 3:30 PM USA Initial Jobless Claims 349k 350k 348k Last Week 21/02/2008 5:00 PM USA Leading Economic Indicators -0.1% -0.1% -0.2% January 21/02/2008 5:00 PM USA Philadelphia Fed Survey -24 -11 -20.9 February 22/02/2008 11:00 AM Europe Manufacturing PMI 52.3 52.3 52.8 February 22/02/2008 11:00 AM Europe Services PMI 52.3 50.7 50.6 February 22/02/2008 12:00 PM Europe Factory Orders mm -3.6% -1.0% 2.7% December 22/02/2008 12:00 PM Europe Factory Orders yy 2.1% 8.4% 11.9% December 22/02/2008 3:30 PM Canada Core Retail Sales mm -0.4% 0.4% 1.7% December 22/02/2008 3:30 PM Canada Retail Sales mm 0.6% 0.7% 0.7% December Results for the week of: 07/02/2008 - 15/02/2008 7 February 2008 - 15 February 2008 Date Hour Country Data Result Forecast Previous Period 07/02/2008 08:45 Swiss Unemployment Rate 2.8% 2.8% 2.8% January 07/02/2008 11:30 U.K. Industrial Production yy 0.6% 1.0% 0.4% December 07/02/2008 11:30 U.K. Industrial Production mm -0.1% 0.2% -0.1% December 07/02/2008 13:00 Germany Factory Orders mm -1.7% -1.2% 3.4% December 07/02/2008 14:00 U.K. Interest Rate Decision 5.25% 5.25% 5.5% February 07/02/2008 14:45 Europe Interest Rate Decision 4.0% 4.0% 4.0% February 07/02/2008 15:30 Europe ECB President Trichet Speaks 07/02/2008 15:30 USA Initial Jobless Claims 356k 340k 375k Last Week 07/02/2008 17:00 USA Pending Homes Sales -1.5% -1.0% -2.6% December 08/02/2008 01:50 Japan Machinery Orders mm -3.2% -0.9% -2.8% December 08/02/2008 01:50 Japan M3 Money Supply yy 2.1% 2.1% 2.1% January 08/02/2008 08:45 Swiss Consumer Price Index (CPI) mm -0.3% -0.5% 0.2% January 08/02/2008 08:45 Swiss Consumer Confidence 14.0 11.0 15.0 Quarter 1 08/02/2008 08:45 Swiss Consumer Price Index (CPI) yy 2.4% 2.2% 2.0% January 08/02/2008 09:00 Germany International Trade Balance mm 15.6b 17.7b 19.8b December 08/02/2008 14:00 Canada Unemployment Rate 5.8% 6.0% 5.9% January 08/02/2008 14:00 Canada Non-Farm Payroll 46.4k 10.0k -2.9k January 08/02/2008 15:15 Canada Housing Starts yy 222.7k 210k 187.5k January 08/02/2008 17:00 USA Wholesale Trade -0.7% 2.2% December 08/02/2008 17:00 USA Wholsale Inventories 1.1% 0.3% 0.6% December 11/02/2008 00:00 Japan Market Holiday 11/02/2008 11:30 U.K. Producer Price Index (PPI) yy 18.9% 14.6% 11.2% January 11/02/2008 11:30 U.K. Producer Price Index (PPI) mm 2.6% 0.8% 0.5% January 11/02/2008 11:30 U.K. Core PPI yy 3.2% 2.6% 2.6% January 11/02/2008 11:30 U.K. Core PPI mm 0.8% 0.3% 0.4% January 11/02/2008 11:30 U.K. International Trade Balance mm -7.574b -7.35b -7.38b December 11/02/2008 15:30 Canada House Prices 0.1% 0.3% 0.5% December 12/02/2008 11:30 U.K. Retail Price Index (RPI) mm -0.5% -0.5% 0.6% January 12/02/2008 11:30 U.K. Consumer Price Index (CPI) yy 2.2% 2.3% 2.1% January 12/02/2008 11:30 U.K. Consumer Price Index (CPI) mm -0.7% -0.6% 0.6% January 12/02/2008 11:30 U.K. RPIX ex. Mortgage (RPIY) 3.4% 3.3% 3.1% January 12/02/2008 11:30 U.K. RPI ex. Mortgage (RPIX) mm -0.4% -0.4% 0.5% January 12/02/2008 11:30 U.K. Retail Price Index (RPI) yy 4.1% 4.1% 4.0% January 12/02/2008 12:00 Germany ZEW Economic Sentiment 33.7 50.8 56.6 February 12/02/2008 17:00 USA IBD Consumer Sentiment 44.5 43.2 February 12/02/2008 21:00 USA Budget 17.84B 39b 38.24b January 12/02/2008 23:45 New Zealand Producer Price Index (PPI) mm 1.5% 1.2% 1.6% Quarter 4 13/02/2008 07:00 Japan Consumer Confidence 38 January 13/02/2008 11:30 U.K. Unemployment Rate 5.3% December 13/02/2008 11:30 U.K. Initial Jobless Claims -6.4k January 13/02/2008 12:00 Europe Industrial Production mm 0.6% -0.5% December 13/02/2008 12:00 Europe Industrial Production yy 2.3% 2.7% December 13/02/2008 12:30 U.K. Bank of England Quarterly Inflation Report 13/02/2008 15:30 USA Retail Sales mm 0.2% -0.4% January 13/02/2008 15:30 USA Core Retail Sales mm 0.2% -0.4% January 13/02/2008 17:00 USA Business Inventories 0.3% 0.4% December 14/02/2008 01:50 Japan Gross Domestic Product (GDP) yy 1.5% Quarter 4 14/02/2008 01:50 Japan Gross Domestic Product (GDP) qq -0.4% Quarter 4 14/02/2008 02:30 Australia Unemployment Rate 4.3% 4.3% January 14/02/2008 02:30 Australia Non-Farm Payroll 15000 20100 January 14/02/2008 06:30 Japan Industrial Production mm 1.4% December 14/02/2008 09:00 Germany Gross Domestic Product (GDP) yy 1.8% 2.4% Quarter 4 14/02/2008 09:00 Germany Gross Domestic Product (GDP) qq 0.3% 0.7% Quarter 4 14/02/2008 12:00 Europe Gross Domestic Product (GDP) yy 2.2% 2.7% Quarter 4 14/02/2008 12:00 Europe Gross Domestic Product (GDP) qq 0.3% 0.8% Quarter 4 14/02/2008 12:00 Swiss ZEW Economic Sentiment -32.7 February 14/02/2008 15:30 Canada International Trade Balance mm 3.7B December 14/02/2008 15:30 USA International Trade Balance mm -61B -63.12B December 14/02/2008 15:30 USA Initial Jobless Claims Last Week 14/02/2008 19:00 Europe ECB President Trichet Speaks 14/02/2008 23:45 New Zealand Retail Sales yy 6.9% December 14/02/2008 23:45 New Zealand Retail Sales mm 2.0% December 14/02/2008 23:45 New Zealand Core Retail Sales mm 0.9% December 15/02/2008 08:00 Japan Interest Rate Decision 0.5% February 15/02/2008 12:00 Europe International Trade Balance mm 2.6B December 15/02/2008 15:30 USA Import Prices 0.4% 0.0% January 15/02/2008 15:30 USA Export Prices 0.4% 0.4% January 15/02/2008 15:30 USA New-York Fed Survey 7.5 9.03 February 15/02/2008 16:00 USA Capital Flow 149.9B December 15/02/2008 16:15 USA Industrial Production mm 0.1% 0.0% January 15/02/2008 16:15 USA Capacity Utilization 81.4% 81.4% January 15/02/2008 16:45 Europe ECB President Trichet Speaks 15/02/2008 17:00 USA U.Michigan Consumer Sentiment 78.4 February Results for the week of: 04/02/2008 - 09/02/2008 4 February 2008 - 8 February 2008 Date Hour * Country Data Result Forecast Previous Period 04/02/2008 2:30 AM Australia International Trade Balance mm -1.936b -2.00b -2.254b January 04/02/2008 12:00 PM Europe Producer Price Index (PPI) mm 0.1% 0.1% 0.8% December 04/02/2008 12:00 PM Europe Producer Price Index (PPI) yy 4.3% 4.3% 4.1% December 04/02/2008 5:00 PM USA Durable Goods Orders 5.0% 5.0% 5.2% December 04/02/2008 5:00 PM USA New orders XD 2.7% 2.9% December 04/02/2008 5:00 PM USA Factory Orders mm 2.3% 2.5% 1.5% December 05/02/2008 2:30 AM Australia Building Permits -16.0% -4.0% 8.9% February 05/02/2008 2:30 AM Australia Retail Sales mm 0.5% 0.6% 0.8% December 05/02/2008 5:30 AM Australia Interest Rate Decision 7.00% 7.00% 6.75% February 05/02/2008 10:55 AM Germany Services PMI 49.2 50.7 51.2 January 05/02/2008 11:00 AM Europe Services PMI 50.6 52.0 53.1 January 05/02/2008 11:30 AM U.K. Services PMI 52.5 52.0 52.4 January 05/02/2008 12:00 PM Europe Retail Sales mm -0.1% 0.3% -0.5% December 05/02/2008 12:00 PM Europe Retail Sales yy -2.0% -0.6% -1.4% December 05/02/2008 5:00 PM USA Services PMI 41.9 52.7 54.4 January 06/02/2008 7:00 AM Japan Leading Economic Indicators 40.0 18.2 December 06/02/2008 3:30 PM Canada Building Permits 0.4% 0.0% -9.9% December 06/02/2008 3:30 PM USA Productivity and Costs 1.8% 0.4% 6.3% Quarter 4 06/02/2008 5:00 PM Canada Services PMI 56.2 46.8 45.9 January 06/02/2008 11:45 PM New Zealand Unemployment Rate 3.4% 3.6% 3.5% Quarter 4 07/02/2008 8:45 AM Swiss Unemployment Rate 2.8% 2.8% 2.8% January 07/02/2008 11:30 AM U.K. Industrial Production mm -0.1% 0.2% -0.1% December 07/02/2008 11:30 AM U.K. Industrial Production yy 0.6% 1.0% 0.4% December 07/02/2008 1:00 PM Germany Factory Orders mm -1.7% -1.2% 3.4% December 07/02/2008 2:00 PM U.K. Interest Rate Decision 5.25% 5.25% 5.5% February 07/02/2008 2:45 PM Europe Interest Rate Decision 4.0% 4.0% 4.0% February 07/02/2008 3:30 PM Europe ECB President Trichet Speaks 07/02/2008 3:30 PM USA Initial Jobless Claims 356k 340k 375k Last Week 07/02/2008 5:00 PM USA Pending Homes Sales -1.5% -1.0% -2.6% December 08/02/2008 1:50 AM Japan Machinery Orders mm -3.2% -0.9% -2.8% December 08/02/2008 1:50 AM Japan M3 Money Supply yy 2.1% 2.1% 2.1% January 08/02/2008 8:45 AM Swiss Consumer Confidence 14.0 11.0 15.0 Quarter 1 08/02/2008 8:45 AM Swiss Consumer Price Index (CPI) mm -0.3% -0.5% 0.2% January 08/02/2008 8:45 AM Swiss Consumer Price Index (CPI) yy 2.4% 2.2% 2.0% January 08/02/2008 9:00 AM Germany International Trade Balance mm 15.6b 17.7b 19.8b December 08/02/2008 2:00 PM Canada Unemployment Rate 5.8% 6.0% 5.9% January 08/02/2008 2:00 PM Canada Non-Farm Payroll 46.4k 10.0k -2.9k January 08/02/2008 3:15 PM Canada Housing Starts yy 222.7k 210k 187.5k January 08/02/2008 5:00 PM USA Wholsale Inventories 1.1% 0.3% 0.6% December 08/02/2008 5:00 PM USA Wholesale Trade -0.7% 2.2% December * GMT +02:00 Results for the week of: 28/01/2008 - 01/02/2008 28 January 2008 - 1 February 2008 Date Hour * Country Data Result Forecast Previous Period 28/01/2008 11:00 AM Europe M3 Money Supply yy 11.5% 12.2% 12.3% December 28/01/2008 5:00 PM USA New Home sales 0.604m 0.64m 0.647m December 28/01/2008 7:00 PM USA Mid-West Mnfg Activity 104.7 105 December 29/01/2008 1:30 AM Japan House'hold Spending 2.2% -0.2% -0.6% December 29/01/2008 1:30 AM Japan Unemployment Rate 3.8% 3.9% 3.8% December 29/01/2008 1:50 AM Japan Retail Sales yy 0.2% 0.1% 1.6% December 29/01/2008 9:15 AM Swiss International Trade Balance mm 198.1m 950m 1810.2m December 29/01/2008 11:00 AM Europe Capital Flow 21.2b -32.6b November 29/01/2008 11:00 AM Europe Current Account 0.7b 1.6b 1.3b November 29/01/2008 1:00 PM U.K. CBI Sales 4 0 8.0 January 29/01/2008 3:30 PM USA New orders XD 2.9% 0.2% 1.2% December 29/01/2008 3:30 PM USA Durable Goods Orders 5.2% 1.5% -0.1% December 29/01/2008 5:00 PM USA Consumer Confidence 87.9 87.5 88.6 January 29/01/2008 11:45 PM New Zealand Building Permits -5.2% -0.1% December 30/01/2008 1:50 AM Japan Industrial Production mm 1.4% 2.0% -1.6% December 30/01/2008 11:30 AM U.K. Consumer Credit mm 0.557b 1.10b 1.12b December 30/01/2008 12:30 PM Swiss KOF Purchasing Manager ind 1.70 1.94 1.99 January 30/01/2008 3:15 PM USA ADP employment 130k 45.0k 40.0k January 30/01/2008 3:30 PM USA Gross Domestic Product (GDP) yy - adjusted 2.5% 2.6% 1.0% Quarter 4 30/01/2008 3:30 PM USA Core PCE qq 2.7% 2.2% 2.0% Quarter 4 30/01/2008 3:30 PM USA Gross Domestic Product (GDP) qq 0.6% 1.2% 4.9% Quarter 4 30/01/2008 3:30 PM USA Personal Consumption Exp. qq 3.9% 3.8% 1.8% Quarter 4 30/01/2008 9:15 PM USA Interest Rate Decision 3.0% 3.0% 3.5% January 31/01/2008 7:00 AM Japan Construction Orders 4.7% -3.8% December 31/01/2008 7:00 AM Japan Housing Starts yy -19.2% -19.0% -27.0% December 31/01/2008 9:00 AM Germany Retail Sales yy -6.9% -4.8% -3.4% December 31/01/2008 9:00 AM Germany Retail Sales mm -0.1% 1.5% -1.9% December 31/01/2008 11:00 AM Germany Unemployment Rate 8.1% 8.3% 8.4% January 31/01/2008 12:00 PM Europe Economic Sentiment 101.7 104.0 104.7 January 31/01/2008 12:00 PM Europe Industrial Sentiment 1.0 1.0 2.0 January 31/01/2008 12:00 PM Europe Harm. Index of Consumer Prices yy 3.2% 3.1% 3.1% January 31/01/2008 12:00 PM Europe Service Sentiment 12 12 14.0 January 31/01/2008 12:00 PM Europe Unemployment Rate 7.2% 7.1% 7.2% December 31/01/2008 12:30 PM U.K. GFK Consumer Sentiment -13 -15 -14 January 31/01/2008 3:30 PM Canada Gross Domestic Product (GDP) mm 0.1% 0.1% 0.2% December 31/01/2008 3:30 PM USA Personal Consumption Exp. yy 3.5% 3.6% December 31/01/2008 3:30 PM USA Personal Consumption 0.0% 0.5% December 31/01/2008 3:30 PM USA Personal Income 0.5% 0.4% 0.4% December 31/01/2008 3:30 PM USA Personal Consumption Exp. yy - core 2.2% 2.2% December 31/01/2008 3:30 PM USA Unit Labor Cost 0.8% 0.8% 0.8% Quarter 4 31/01/2008 3:30 PM USA Initial Jobless Claims 375k 315k 301K Last Week 31/01/2008 3:30 PM USA Personal Consumption Exp. mm 0.2% 0.6% December 31/01/2008 3:30 PM USA Personal Consumption Exp. mm - core 0.2% 0.2% 0.2% December 31/01/2008 4:45 PM USA Chicago PMI 51.5 52.0 52.0 January 31/01/2008 6:00 PM USA KC Fed 7.0 12.0 January 01/02/2008 10:30 AM Swiss Manufacturing PMI 61.6 60.0 61.3 January 01/02/2008 10:55 AM Germany Manufacturing PMI 54.4 53.6 53.6 January 01/02/2008 11:00 AM Europe Manufacturing PMI 52.8 52.6 52.6 January 01/02/2008 11:30 AM U.K. Manufacturing PMI 50.6 52.5 52.9 January 01/02/2008 3:30 PM Canada Producer Price Index (PPI) yy -0.9% -0.6% December 01/02/2008 3:30 PM Canada Producer Price Index (PPI) mm 1.1% 0.7% 0.6% December 01/02/2008 3:30 PM USA Non-Farm Payroll -17.9k 80.0k 82k January 01/02/2008 3:30 PM USA Unemployment Rate 4.9% 5.0% 5.0% January 01/02/2008 5:00 PM USA Manufacturing PMI 50.7 47.3 48.4 January 01/02/2008 5:00 PM USA Construction Spending -1.1% -0.5% 0.1% December 01/02/2008 5:00 PM USA U.Michigan Consumer Sentiment 78.4 79.0 75.5 January * GMT +02:00 Results for the week of: 20/01/2008 - 26/01/2008 20 January 2008 - 25 January 2008 Date Hour * Country Data Result Forecast Previous Period 21/01/2008 12:00 AM USA Market Holiday 21/01/2008 9:00 AM Germany Producer Price Index (PPI) yy 2.5% 2.8% 2.5% December 21/01/2008 9:00 AM Germany Producer Price Index (PPI) mm -0.1% 0.2% 0.8% December 21/01/2008 10:15 AM Swiss Producer Price Index (PPI) mm -0.1% 0.2% 0.3% December 21/01/2008 10:15 AM Swiss Producer Price Index (PPI) yy 3.0% 3.2% 3.0% December 21/01/2008 3:30 PM Canada Wholesale Trade 0.3% 0.5% 0.5% November 22/01/2008 6:00 AM Japan Interest Rate Decision 0.5% 0.5% January 22/01/2008 10:15 AM Swiss Retail Sales mm 2.9% 6.1% November 22/01/2008 1:00 PM U.K. CBI Orders 2.0 0.0 2.0 January 22/01/2008 3:30 PM Canada Retail Sales mm 0.7% 0.2% 0.1% November 22/01/2008 3:30 PM USA Interest Rate Decision 3.5% 3.75% 4.25% January 22/01/2008 4:00 PM Canada Interest Rate Decision 4.0% 4.0% 4.25% February 22/01/2008 5:00 PM USA Richmond Fed srvs -12.0 0.0 January 23/01/2008 2:30 AM Australia Consumer Price Index (CPI) yy 3.0% 2.9% 1.9% Quarter 4 23/01/2008 11:00 AM Europe Manufacturing PMI 52.6 52.0 52.6 January 23/01/2008 11:00 AM Europe Services PMI 52.0 52.8 53.1 January 23/01/2008 11:30 AM U.K. Gross Domestic Product (GDP) qq 0.6% 0.5% 0.7% Quarter 4 23/01/2008 11:30 AM U.K. Gross Domestic Product (GDP) yy 2.9% 2.8% 3.3% Quarter 4 23/01/2008 11:30 AM U.K. Protocol of last interest rate meeting 23/01/2008 3:30 PM Canada Leading Economic Indicators -0.1% 0.0% December 23/01/2008 10:00 PM New Zealand Interest Rate Decision 8.25% 8.25% 8.25% January 24/01/2008 1:50 AM Japan International Trade Balance yy 927.2B 941.5b 797.4b December 24/01/2008 11:00 AM Germany IFO Business Climate: index 103.4 102.3 103.0 January 24/01/2008 3:30 PM USA Initial Jobless Claims 301.0k 325.0k 301.0k Last Week 24/01/2008 5:00 PM USA New Home sales 4.89m 4.95m 5.0m December 25/01/2008 1:30 AM Japan Consumer Price Index (CPI) mm 0.8% 0.6% 0.4% December 25/01/2008 9:00 AM Germany GFK Consumer Sentiment 4.5 4.3 4.5 February 25/01/2008 2:00 PM Canada Core CPI mm -0.3% -0.1% 0.0% December 25/01/2008 2:00 PM Canada Core CPI yy 1.5% 1.7% 1.6% December 25/01/2008 2:00 PM Canada Consumer Price Index (CPI) mm 0.1% 0.1% 0.3% December 25/01/2008 2:00 PM Canada Consumer Price Index (CPI) yy 2.4% 2.4% 2.5% December Results for the week of: 14/01/2008 - 19/01/2008 14 January 2008 - 18 January 2008 Date Hour * Country Data Result Forecast Previous Period 14/01/2008 12:00 AM Japan Market Holiday 14/01/2008 11:30 AM U.K. Producer Price Index (PPI) mm 0.5% 0.8% 1.7% December 14/01/2008 11:30 AM U.K. Producer Price Index (PPI) yy 11.2% 10.4% 10.2% December 14/01/2008 11:30 AM U.K. Core PPI mm 0.4% 0.2% 0.1% December 14/01/2008 11:30 AM U.K. Core PPI yy 2.6% 2.3% 2.2% December 14/01/2008 12:00 PM Europe Industrial Production mm -0.5% -0.8% 0.4% November 14/01/2008 12:00 PM Europe Industrial Production yy 2.7% 2.8% 3.8% November 15/01/2008 10:00 AM Germany Gross Domestic Product (GDP) yy 2.5% 2.5% 2.9% December 15/01/2008 11:30 AM U.K. RPI ex. Mortgage (RPIX) mm 0.5% 0.6% 0.4% December 15/01/2008 11:30 AM U.K. RPI ex. Mortgage (RPIX) yy 3.1% 3.1% 3.2% December 15/01/2008 11:30 AM U.K. Consumer Price Index (CPI) mm 0.6% 0.5% 0.3% December 15/01/2008 11:30 AM U.K. Consumer Price Index (CPI) yy 2.1% 2.1% 2.1% December 15/01/2008 11:30 AM U.K. Retail Price Index (RPI) mm 0.5% 0.6% 0.4% December 15/01/2008 11:30 AM U.K. Retail Price Index (RPI) yy 4.0% 4.0% 4.3% December 15/01/2008 12:00 PM Germany ZEW Economic Sentiment 56.6 60.0 63.5 January 15/01/2008 3:30 PM USA Producer Price Index (PPI) mm -0.1% 0.2% 3.2% December 15/01/2008 3:30 PM USA Producer Price Index (PPI) yy 6.3% 7.2% December 15/01/2008 3:30 PM USA Core PPI mm 0.2% 0.2% 0.4% December 15/01/2008 3:30 PM USA New-York Fed Survey 9.03 8.75 10.31 January 15/01/2008 3:30 PM USA Core PPI yy 2.0% 2.0% December 15/01/2008 3:30 PM USA Retail Sales mm -0.4% 0.0% 1.2% December 15/01/2008 3:30 PM USA Core Retail Sales mm -0.4% 0.1% 1.8% December 15/01/2008 5:00 PM USA Business Inventories 0.4% 0.4% 0.1% November 16/01/2008 1:30 AM Australia Consumer Confidence -8.3% 1.8% January 16/01/2008 1:50 AM Japan Current Account 2.1% 6.5% 45.7% November 16/01/2008 1:50 AM Japan Machinery Orders mm -2.8% -4.7% 12.7% November 16/01/2008 9:00 AM Germany Consumer Price Index (CPI) mm - final 0.5% 0.5% 0.5% December 16/01/2008 9:00 AM Germany Consumer Price Index (CPI) yy - final 2.8% 2.8% 3.1% December 16/01/2008 9:00 AM Germany Harm. Index of Consumer Prices mm - final 0.7% 0.7% 0.5% December 16/01/2008 9:00 AM Germany Harm. Index of Consumer Prices yy - final 3.1% 3.1% 3.3% December 16/01/2008 11:30 AM U.K. Initial Jobless Claims -6.4k -5.0K -11.1K December 16/01/2008 11:30 AM U.K. ILO Unemployment 5.3% 5.3% 5.3% November 16/01/2008 12:00 PM Europe Consumer Price Index (CPI) mm - final 0.4% 0.4% 0.5% December 16/01/2008 12:00 PM Europe Consumer Price Index (CPI) yy - final 3.1% 3.1% 3.1% December 16/01/2008 3:30 PM USA Consumer Price Index (CPI) mm - core 0.2% 0.2% 0.3% December 16/01/2008 3:30 PM USA Consumer Price Index (CPI) mm 0.3% 0.2% 0.8% December 16/01/2008 3:30 PM USA Consumer Price Index (CPI) yy - core 2.4% 2.4% 2.3% December 16/01/2008 3:30 PM USA Consumer Price Index (CPI) yy 4.1% 4.1% 4.3% December 16/01/2008 4:00 PM USA Capital Flow 149.B 97.8B November 16/01/2008 4:15 PM USA Capacity Utilization 81.4% 81.2% 81.5% December 16/01/2008 4:15 PM USA Industrial Production mm 0.0% -0.2% 0.3% December 16/01/2008 9:00 PM USA Fed Beige Book December 16/01/2008 11:45 PM New Zealand Consumer Price Index (CPI) mm 1.2% 1.0% 0.5% Quarter 4 16/01/2008 11:45 PM New Zealand Consumer Price Index (CPI) yy 3.2% 3.0% 1.8% Quarter 4 17/01/2008 2:30 AM Australia Non-Farm Payroll 20.1K 20.0k 52.6k December 17/01/2008 2:30 AM Australia Unemployment Rate 4.3% 4.4% 4.5% December 17/01/2008 12:00 PM Europe International Trade Balance mm 2.6B 5.5B 6.1B November 17/01/2008 12:00 PM Swiss ZEW Economic Sentiment -32.7 -29.7 January 17/01/2008 3:30 PM USA Initial Jobless Claims 301k 335.0K 322.0K Last Week 17/01/2008 3:30 PM USA Building Permits 1.068M 1.14M 1.162M December 17/01/2008 3:30 PM USA Housing Starts yy 1.006M 1.14M 1.187M December 17/01/2008 5:00 PM USA Philadelphia Fed Survey -20.9 -1.2 -1.6 January 17/01/2008 5:00 PM USA Fed Chairman Bernanke Speaks 17/01/2008 11:45 PM New Zealand Core Retail Sales mm 0.9% 0.6% -1.1% November 17/01/2008 11:45 PM New Zealand Retail Sales mm 2.0% 0.7% -0.7% November 18/01/2008 7:00 AM Japan Consumer Confidence 38.0 39.8 December 18/01/2008 11:30 AM U.K. Retail Sales mm -0.4% 0.2% 0.4% December 18/01/2008 11:30 AM U.K. Retail Sales yy 2.7% 3.3% 4.4% December 18/01/2008 5:00 PM USA Leading Economic Indicators -0.2% -0.1% -0.4% December 18/01/2008 5:00 PM USA U.Michigan Consumer Sentiment 80.5 74.5 75.5 January * GMT +02:00 Results for the week of: 06/01/2008 - 12/01/2008 6 January 2008 - 11 January 2008 06/01/2008 11:45 PM New Zealand International Trade Balance mm -646m -450m -690m November 06/01/2008 11:45 PM New Zealand International Trade Balance yy -5.653b -5.43b -5.80b November 07/01/2008 8:45 AM Swiss Unemployment Rate 2.6% 2.6% 2.6% December 07/01/2008 12:00 PM Europe Industrial Sentiment 2 2.0 3.0 December 07/01/2008 12:00 PM Europe Producer Price Index (PPI) mm 0.8% 0.8% 0.6% November 07/01/2008 12:00 PM Europe Producer Price Index (PPI) yy 4.1% 4.0% 3.3% November 07/01/2008 12:00 PM Europe Service Sentiment 14.0 13.0 14.0 December 07/01/2008 12:00 PM Europe Unemployment Rate 7.2% 7.2% 7.2% November 07/01/2008 12:00 PM Europe Economic Sentiment 104.7 104.3 104.8 December 08/01/2008 12:00 PM Europe Retail Sales yy -1.4% 0.5% 0.2% November 08/01/2008 12:00 PM Europe Retail Sales mm -0.5% 0.5% -0.7% November 08/01/2008 1:00 PM Germany Factory Orders mm 3.4% -1.8% 4.0% November 08/01/2008 5:00 PM USA IBD Consumer Sentiment 43.2 44.4 January 08/01/2008 5:00 PM USA Pending Homes Sales -2.6% -0.5% 0.6% November 08/01/2008 10:00 PM USA Consumer Credit mm 15.4b 7.5b 4.71b November 09/01/2008 2:30 AM Australia Retail Sales mm 0.8% 0.5% 0.2% November 09/01/2008 9:00 AM Germany International Trade Balance mm 19.8b 17.5b 18.2b November 09/01/2008 12:00 PM Europe Gross Domestic Product (GDP) qq 0.8% 0.7% 0.3% Quarter 3 09/01/2008 12:00 PM Europe Gross Domestic Product (GDP) yy 2.7% 2.7% 2.5% Quarter 3 09/01/2008 1:00 PM Germany Industrial Production mm -0.9% 0.5% -0.3% November 09/01/2008 3:15 PM Canada Housing Starts yy 187.5k 221.0k 227.9K December 10/01/2008 2:30 AM Australia International Trade Balance mm -2254m -2500m -2983m November 10/01/2008 7:00 AM Japan Leading Economic Indicators 10.0 18.2 November 10/01/2008 11:30 AM U.K. International Trade Balance mm -7.377b -7.23b -7.1B November 10/01/2008 2:00 PM U.K. Interest Rate Decision 5.5% 5.5% 5.5% January 10/01/2008 2:45 PM Europe Interest Rate Decision 4.0% 4.0% 4.0% January 10/01/2008 3:30 PM Europe ECB President Trichet Speaks 10/01/2008 3:30 PM Canada Building Permits -9.9% -2.0% 6.8% November 10/01/2008 3:30 PM USA Initial Jobless Claims 322k 340k 336k Last Week 10/01/2008 5:00 PM USA Wholsale Inventories 0.6% 0.4% 0.0% November 10/01/2008 5:00 PM USA Wholesale Trade 2.2% 0.7% November 10/01/2008 8:00 PM USA Fed Chairman Bernanke Speaks 11/01/2008 1:50 AM Japan M3 Money Supply yy 2.1% 2.0% 2.0% December 11/01/2008 9:00 AM Germany Wholesale Price Index (WPI) mm -0.5% 0.3% 1.0% December 11/01/2008 11:30 AM U.K. Industrial Production mm -0.1% 0.1% 0.4% November 11/01/2008 11:30 AM U.K. Industrial Production yy 0.4% 0.5% 1.0% November 11/01/2008 2:00 PM Canada Unemployment Rate 5.9% 5.9% 5.9% December 11/01/2008 2:00 PM Canada Non-Farm Payroll -18.7k 15.0k 42.6k December 11/01/2008 3:30 PM Canada International Trade Balance mm 3.70b 3.30b 3.32b November 11/01/2008 3:30 PM USA Export Prices 0.4% 0.5% 0.9% December 11/01/2008 3:30 PM USA Import Prices 0.0% 0.2% 2.7% December 11/01/2008 3:30 PM USA International Trade Balance mm -63.12b -58.0b -57.82b November 11/01/2008 9:00 PM USA Budget 48.2b 50.0b 41.96b December * GMT +02:00 Results for the week of: 30/12/2007 - 05/01/2008 30 December 2007 - 4 January, 2008 Date Hour * Country Data Result Forecast Previous Period 31/12/2007 5:00 PM USA Existing Home Sales (Units) 5.00M 4.97M 4.97M November 01/01/2008 12:00 AM Japan Market Holiday 01/01/2008 12:00 AM U.K. Market Holiday 01/01/2008 12:00 AM Germany Market Holiday 01/01/2008 12:00 AM USA Market Holiday 01/01/2008 12:00 AM Swiss Market Holiday 02/01/2008 10:55 AM Germany Manufacturing PMI 53.6 53.2 53.7 December 02/01/2008 11:00 AM Europe Manufacturing PMI 52.6 52.5 52.8 December 02/01/2008 11:30 AM U.K. Manufacturing PMI 52.9 53.6 54.4 December 02/01/2008 5:00 PM USA Construction Spending 0.1% -0.4% -0.8% November 02/01/2008 5:00 PM USA Manufacturing PMI 47.7 50.4 50.8 December 03/01/2008 12:00 AM Japan Market Holiday 03/01/2008 10:30 AM Swiss Services PMI 61.3 61.4 63.4 December 03/01/2008 11:00 AM Europe M3 Money Supply yy 12.3% 12.2% 12.3% November 03/01/2008 11:00 AM Germany Unemployment Rate 8.4% 8.5% 8.6% December 03/01/2008 3:15 PM USA ADP employment 40k 50k 189 December 03/01/2008 3:30 PM USA Initial Jobless Claims 336,000 345,000 349,000 Last Week 03/01/2008 5:00 PM USA Durable Goods Orders -0.1% 0.1% November 03/01/2008 5:00 PM USA New orders XD 1.2% 1.2% November 03/01/2008 5:00 PM USA Factory Orders mm 1.5% 0.7% 0.5% November 04/01/2008 8:45 AM Swiss Consumer Price Index (CPI) mm 0.2% 0.1% 0.5% December 04/01/2008 8:45 AM Swiss Consumer Price Index (CPI) yy 2.0% 1.9% 1.8% December 04/01/2008 10:55 AM Germany Services PMI 51.2 52.4 53.1 December 04/01/2008 11:00 AM Europe Services PMI 53.1 53.2 54.1 December 04/01/2008 11:30 AM U.K. Services PMI 52.4 51.6 51.9 December 04/01/2008 11:30 AM U.K. Consumer Credit mm 1.12b 1.20b 1.439b November 04/01/2008 12:00 PM Europe Harm. Index of Consumer Prices yy 3.1% 3.1% 3.1% December 04/01/2008 3:30 PM Canada Producer Price Index (PPI) mm 0.6% 0.1% -1.1% November 04/01/2008 3:30 PM Canada Producer Price Index (PPI) yy -0.6% -1.0% November 04/01/2008 3:30 PM USA Non-Farm Payroll 18k 70.0k 115k December 04/01/2008 3:30 PM USA Unemployment Rate 5.0% 4.8% 4.7% December 04/01/2008 5:00 PM Canada Services PMI 45.9 52.0 58.7 December 04/01/2008 5:00 PM USA Services PMI 53.9 53.6 54.1 December * GMT +02:00 </plaintext> </div> </body> </html>